0667
Myotonic Dystrophy type 1: susceptibility in Thalamus and Brainstem as biomarker of clinical impairment1Department of Biomedical and Neuromotor Sciences, University of Bologna, Bologna, Italy, 2Functional and Molecular Neuroimaging Unit, IRCCS Istituto delle Scienze Neurologiche di Bologna, Bologna, Italy, 3Clinica Neurologica Unit, IRCCS Istituto delle Scienze Neurologiche di Bologna, Bologna, Italy, 4Department of Medicine and Surgery, University of Parma, Parma, Italy, 5Department for Life Quality Sciences, University of Bologna, Bologna, Italy
Synopsis
Keywords: Other Neurodegeneration, Quantitative Susceptibility mapping, Myotonic Dystrophy type 1
Motivation: QSM is a valuable tool for investigating neurodegenerative conditions, including DM1, a genetic multisystem disorder affecting the central nervous system.
Goal(s): The objective of this research is to identify biomarkers of clinical impairment by exploring magnetic susceptibility in sub-cortical areas of DM1 brains.
Approach: We developed an automated pipeline for segmenting various structures and their sub-units. DM1 susceptibility values were compared to healthy controls and correlated with clinical and laboratory data.
Results: Thalamus and brainstem were identified as key structures, showing increased iron concentration and correlation with disability and polysomnography scores, contributing to a comprehensive understanding of DM1 and its symptomathology.
Impact: Examining iron accumulation in sub-cortical structures through QSM contributes to a complete understanding of DM1 as a neurodegenerative disorder. Thalamus and brainstem, crucial in autonomic functions, exhibit alterations and correlations with clinical measurements, suggesting central origins of DM1 symptomatology.
Background and aim
Myotonic Dystrophy type 1 (DM1) is an inherited multisystem disease manifesting a wide range of potential neuromuscular and extra-muscular symptoms, including central nervous system impairment, leading to sleep disturbances and cognitive and psychiatric disorders1. Various MR imaging techniques (e.g. structural, diffusion and spectroscopy) have revealed changes in DM1 brains2; to date, only one study has explored magnetic susceptibility χ and identified alterations in the thalamus3.The primary goal of this research was to examine iron concentration distribution in sub-cortical regions using Quantitative Susceptibility Mapping (QSM); we aim to establish connections between imaging findings and disability scores, pulmonary and cardiac evaluations and data from polysomnography records.
Materials and methods
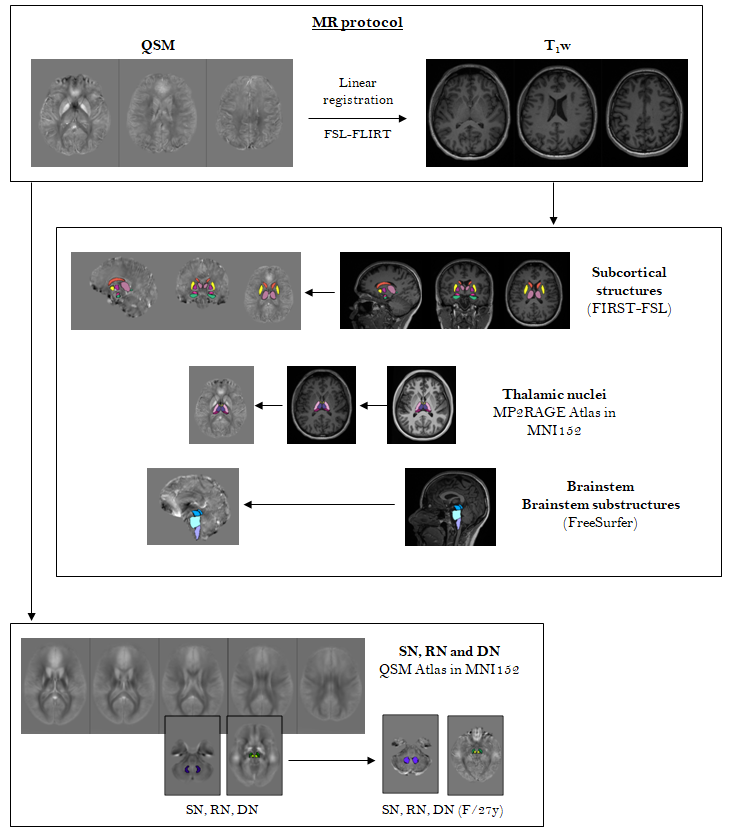
The study sample included 34 DM1 patients (F:M 20:14, 46.8±12.0y [20-71], diagnostic delay 16.8±9.7y [0.6-36.1]) and 35 age- and sex- matched healthy controls (F:M 20:15, 50.5±17.4yo [24-86]). The brain MR protocol (3T Siemens Magnetom Skyra, whole-body transmit and head/neck 64-channel receiver coil) included morphological T1w (3D-MPRAGE, TR/TE=2300/2.98ms, 1x1x1mm3) and QSM (3D-GRE T2*w, nTEs=5, TR/TE/ΔTE=53/9.42/9.42ms, 0.5x0.5x1.5mm3). To reconstruct χ maps, raw phase maps were processed by Laplacian unwrapping, V-SHARP background removal, weighted-sum for echo combination and iLSQR for dipole inversion4. Cerebro-spinal fluid was considered as reference tissue.Different automated segmentation methods were used: deep gray matter nuclei, among which the thalamus, were selected from FIRST-FSL; thalamic nuclei (anterior, medial, ventral, pulvinar) from an atlas-based method proposed in literature5; brainstem and its sub-units (midbrain, pons, medulla) from FreeSurfer; substantia nigra, red and dentate nuclei from an originally implemented χ-enhanced atlas (Fig.1).
ROI-based analysis was performed, averaging left and right hemispheres, comparing the median χ and volume distributions between DM1 and HC. χ values were corrected by age assuming a linear increase in the control group, volume was corrected by the total intracranial volume using the proportional method. The non-parametric Kruskal-Wallis test was used since χ values resulted not normally distributed from one-sample Kolmogorov-Smirnov test. Correlations were evaluated between χ values and clinical data (neurological evaluation including Neuromuscolar Impairment Function and Disability Scale6 [NIFDS], with neuropsychological, motor, myotonia, daily life activity items; pneumological and cardiological assessment and data from polysomnography, particularly the number of central apneas) using the Spearman’s test (* p-values < .05 and ** p-values < .01).
Results and discussion
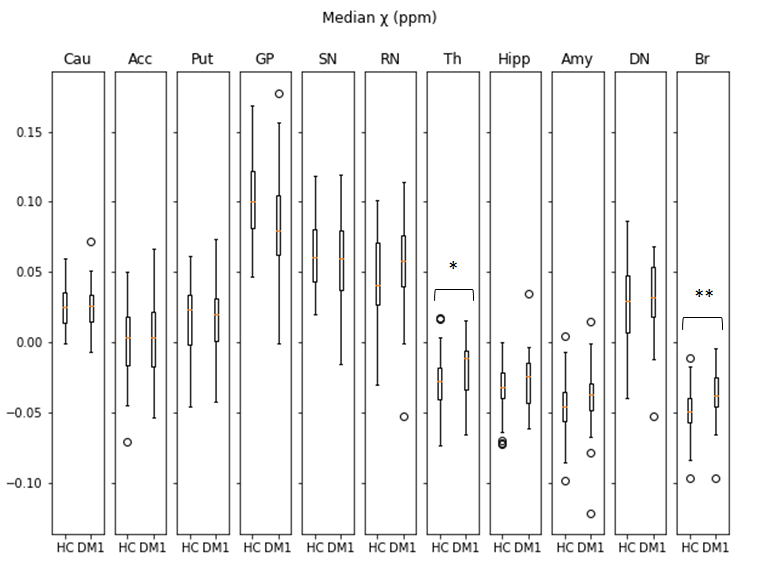
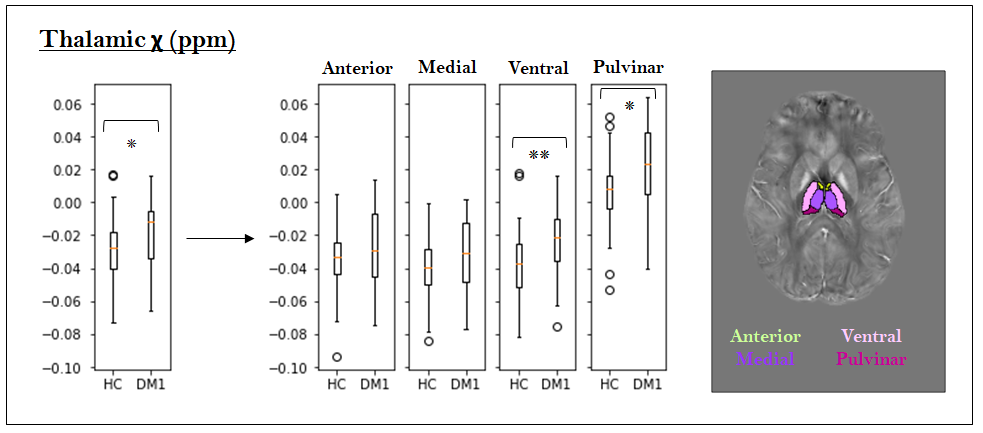
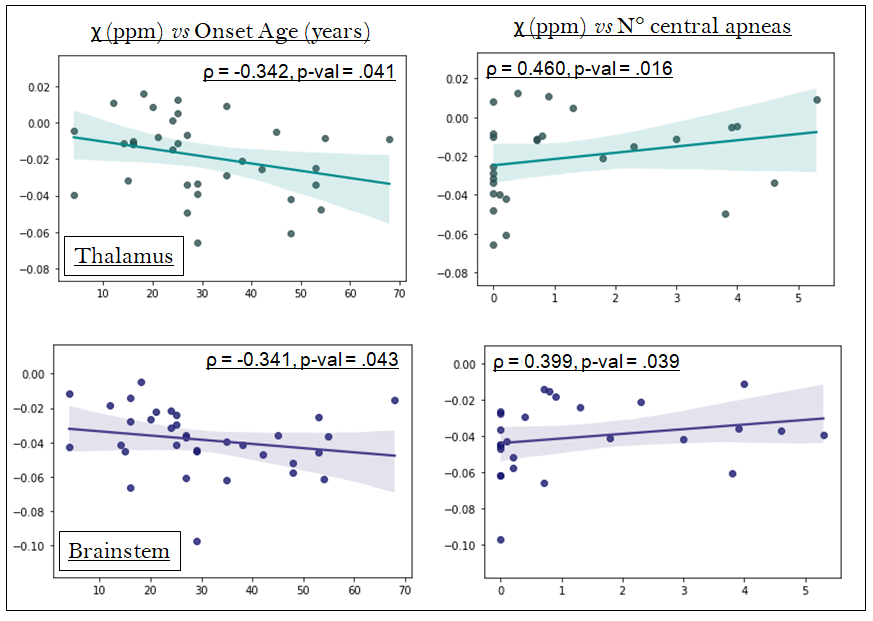
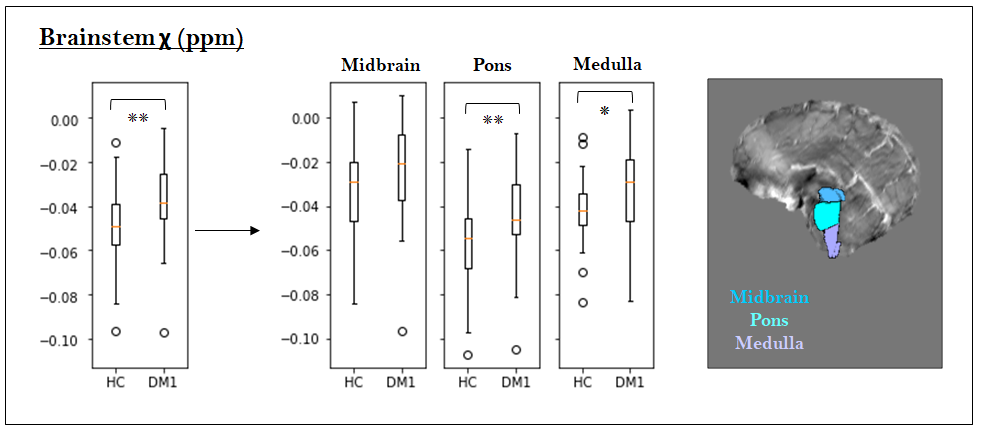
When comparing DM1 patients to controls, significant χ increase occurred in the thalamus (p-value=.020) (Fig.2), specifically in the ventral and pulvinar nuclei (Fig.3), without detecting significant changes in volume distributions. Thalamic χ values showed negative correlations with the age of onset (medial and pulvinar), positive correlations with motor, myotonic and daily life items of NIFDS (pulvinar) and positive correlations with the number of central apneas (medial) (Fig.4).Furthermore, the brainstem exhibited significantly higher susceptibility values in the DM1 group compared to controls (p-value=.003) (Fig.2), particularly in the pons and medulla (Fig.5). χ in the brainstem displayed a negative correlation with the age of disease onset, indicating that an earlier disease onset was associated with greater iron accumulation7. As in the thalamus, there was also a positive correlation with the number of central apneas (Fig.4). A recent study8 also linked magnetic susceptibility in the brainstem to sleep abnormalities in a cohort of patients with REM sleep Behavior Disorder.
Other deep gray matter structures appear to be involved: susceptibility in the amygdale correlated with motor and daily life domains in the NIFDS and the number of central apneas positively correlated with susceptibility in the putamen and hippocampus, whose morphometric alterations have already been linked with sleep disorders9.
Conclusion
This study contributes to a more comprehensive understanding of DM1 as a neurodegenerative condition, with a specific focus on the role of iron accumulation in the disease's progression measured by QSM. The analysis identified the thalamus and brainstem as key structures of interest, exhibiting a significant increase in susceptibility, reflecting an increase in iron concentration10, and showing associations with clinical and laboratory data.There was a noteworthy correlation between the number of central apneas in both the thalamus and the brainstem, particularly intriguing because sleep disorders are a common feature in DM1, and previous studies have suggested that these anomalies originate in the central nervous system, supporting our findings. Additionally, in both thalamus and brainstem increase in iron concentration is linked with earlier onset and, in the thalamus, susceptibility values correlated with NIFDS disability scores. Overall, the findings of this study indicate a progressive decline in structures central to autonomic functions, throughout the course of DM1, suggesting central origins of DM1 symptomatology.
Acknowledgements
No acknowledgement found.References
1. G. Meola and R. Cardani. Myotonic dystrophies: An update on clinical aspects, genetic, pathology, and molecular pathomechanisms. Biochimica et Biophysica Acta (BBA) - Molecular Basis of Disease, 2015; 1852(4):594–606
2. K. Okkersen, D.G. Monckton, N. Le et al. Brain imaging in myotonic dystrophy type 1: A systematic review. Neurology, 2017; 89(9)
3. S. Ates, A. Deistung, R. Schneider et al. Characterization of Iron Accumulation in Deep Gray Matter in Myotonic Dystrophy Type 1 and 2 Using Quantitative Susceptibility Mapping and R2* Relaxometry: A Magnetic Resonance Imaging Study at Tesla. Front Neurology, 2019
4. W. Li, N. Wang, F. Yu et al..A method for estimating and removing streaming artifacts in quantitative susceptibility mapping. Neuroimage. 2015;108:111-222
5. G. Brun, B. Testud, O.M. Girard, et al. Automatic segmentation of deep grey nuclei using a high-resolution 7T magnetic resonance imaging atlas-Quantification of T1 values in healthy volunteers. Eur J Neurosci, 2022; 55(2):438–460
6. S. Contardi, F. Pizza, F. Falzone et al. Development of a disability scale for myotonic dystrophy type 1. Acta Neurol Scand, 2012;125(6):431–438
7. B. Bilgic, A. Pfefferbaum, T. Rohlfing et al. MRI estimates of brain iron concentration in normal aging using quantitative susceptibility mapping. NeuroImage, 2012;59(3):2625–2635
8. J. Nepozitek, Z. Varga, S. Dostalova et al. Magnetic susceptibility changes in the brainstem reflect REM sleep without atonia severity in isolated REM sleep behavior disorder. NPJ Parkinsons Dis, 2023;9(1)
9. E.Y. Joo, H. Kim, S. Suh et al. Hippocampal substructural vulnerability to sleep disturbance and cognitive impairment in patients with chronic primary insomnia: magnetic resonance imaging morphometry. Sleep, 2014;37(1):1189-1198
10. S. Hamatner, V. Endmayr, A. Deistung et al. The influence of brain iron and myelin on magnetic susceptibility effective transverse relaxation – A biochemical and histological validation study. Neuroimage. 2018;179:117-133
Figures