0666
Magnetic Resonance Elastography Based Measure of Compressibility in Normal Pressure Hydrocephalus and Alzheimer’s Disease1Department of Radiology, Mayo Clinic College of Medicine, Rochester, MN, United States, 2Department of Physiology and Biomedical Engineering, Mayo Clinic College of Medicine, Rochester, MN, United States
Synopsis
Keywords: Dementia, Alzheimer's Disease, Biomarker's, Novel contrast mechanisms
Motivation: Magnetic resonance elastography (MRE) is typically used to assess shear mechanical properties of a tissue. A new measure related to the compressibility of a tissue could provide new insights into disease processes.
Goal(s): To test a new measure related to the tissue compressibility in application to neurological disorders.
Approach: A measure of compressibility was defined as the ratio of the magnitude of the divergence over the magnitude of the curl of displacements.
Results: Normal pressure hydrocephalus and Alzheimer’s disease displayed distinct patterns of compressibility measure compared to the control group.
Impact: An MRE-based compressibility measure demonstrates unique patterns in normal pressure hydrocephalus and Alzheimer’s disease. This may provide new insights into disease processes and guides future research.
INTRODUCTION
Normal pressure hydrocephalus (NPH) and Alzheimer’s disease (AD) are neurological disorders with overlapping clinical symptoms of dementia1, 2. However, unlike AD, NPH may be treated with a ventriculoperitoneal shunt surgery3. The surgery has a failure rate of around 20%4, 5. Since the surgery is highly invasive, it is important to identify biomarkers for improving the diagnosis of NPH and the prediction of surgical outcomes. Enlargement of the ventricle in NPH compresses the brain tissue, whereas brain tissue is not compressed in the setting of ventriculomegaly and atrophy in AD6. In this study, we tested the hypothesis that the two disease groups have distinct patterns of a compressibility as derived from magnetic resonance elastography (MRE).METHODS
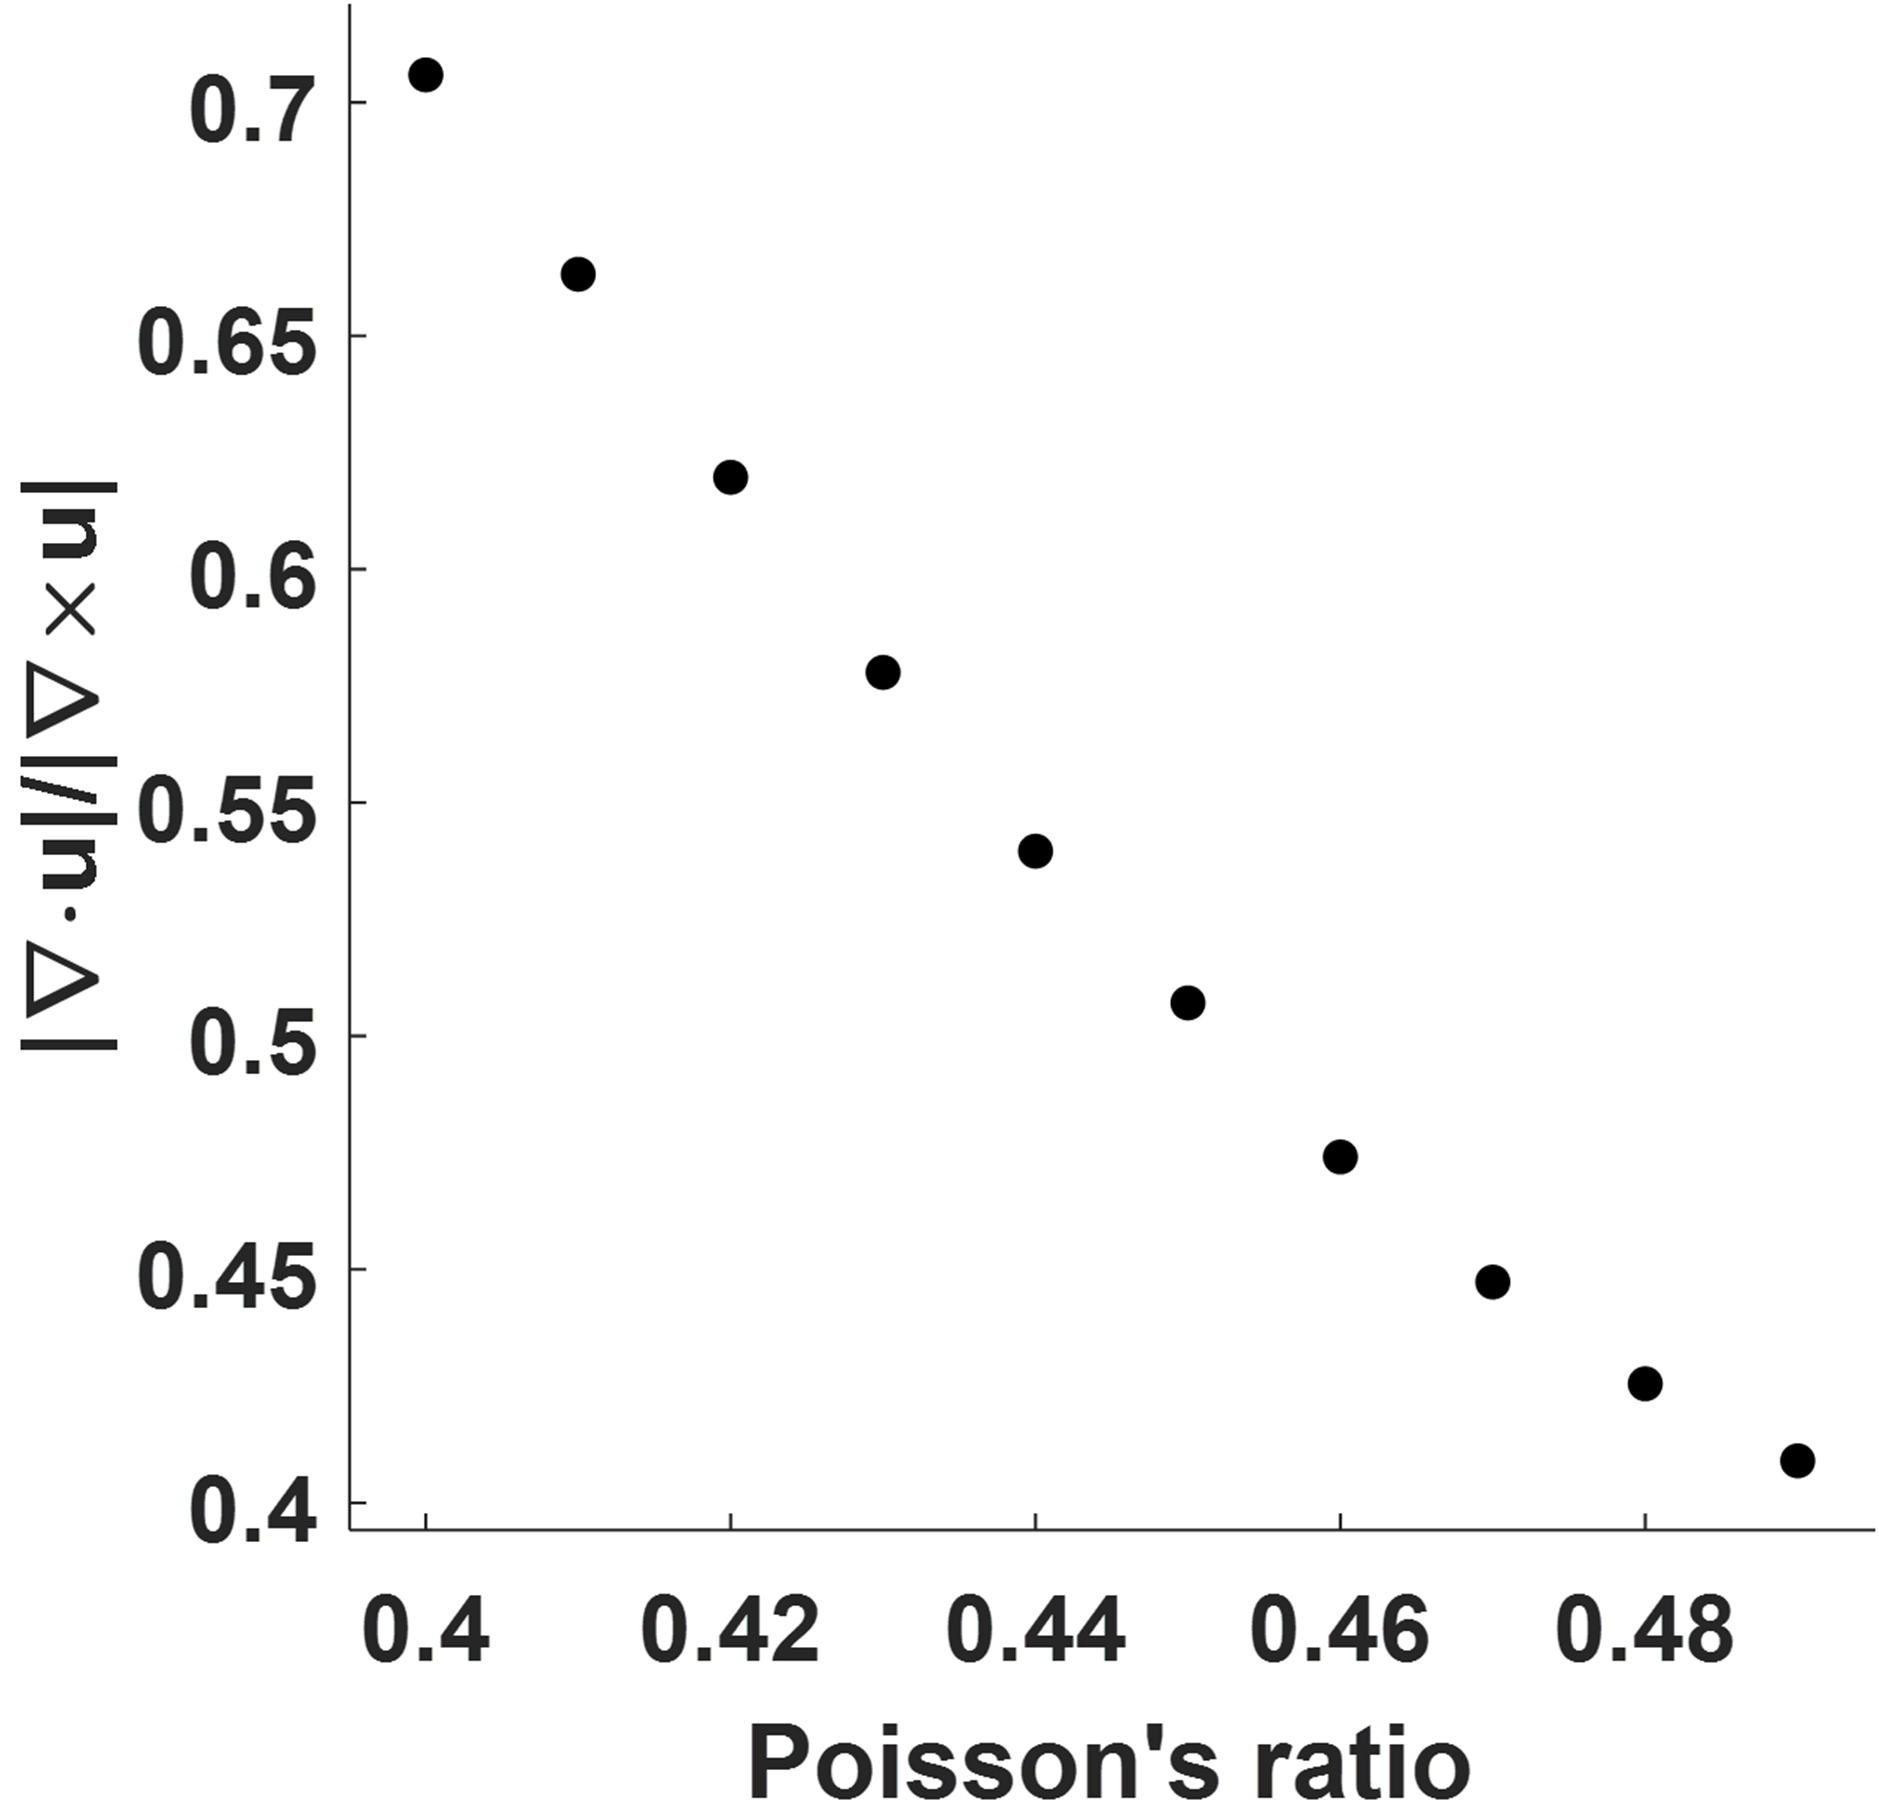
We calculated a measure of compressibility defined as the ratio of the magnitude of the divergence over the magnitude of the curl of the displacement data. The behavior of this quantity was first evaluated in a simulation experiment. In a spherical object, shear modulus and boundary conditions were held constant while Poisson’s ratio was progressively increased from 0.40 to 0.49. In each simulation, the compressibility measure was computed as the mean over the entire object. Next, we evaluated compressibility in an in vivo study of 72 participants, with 44 cognitively unimpaired controls, 8 AD patients, and 20 NPH patients. A 3T GE scanner was used to perform MRE and T1-weighted structural imaging. MRE was performed with spin-echo echo-planar-imaging pulse sequence. We computed the measure of compressibility for the participants in this study using a neural network inversion that jointly estimates the shear modulus and gradient of displacements7. After the computation, maps were warped into template space for analyses8. We compared the mean values of the compressibility measure of the whole brain between the groups using the Wilcoxon rank sum test and Welch’s t-test. We then tested the voxel-wise differences between the maps comparing control with AD and NPH respectively. For voxel-wise analysis, a false discovery rate corrected Q<0.05 was considered significant.RESULTS
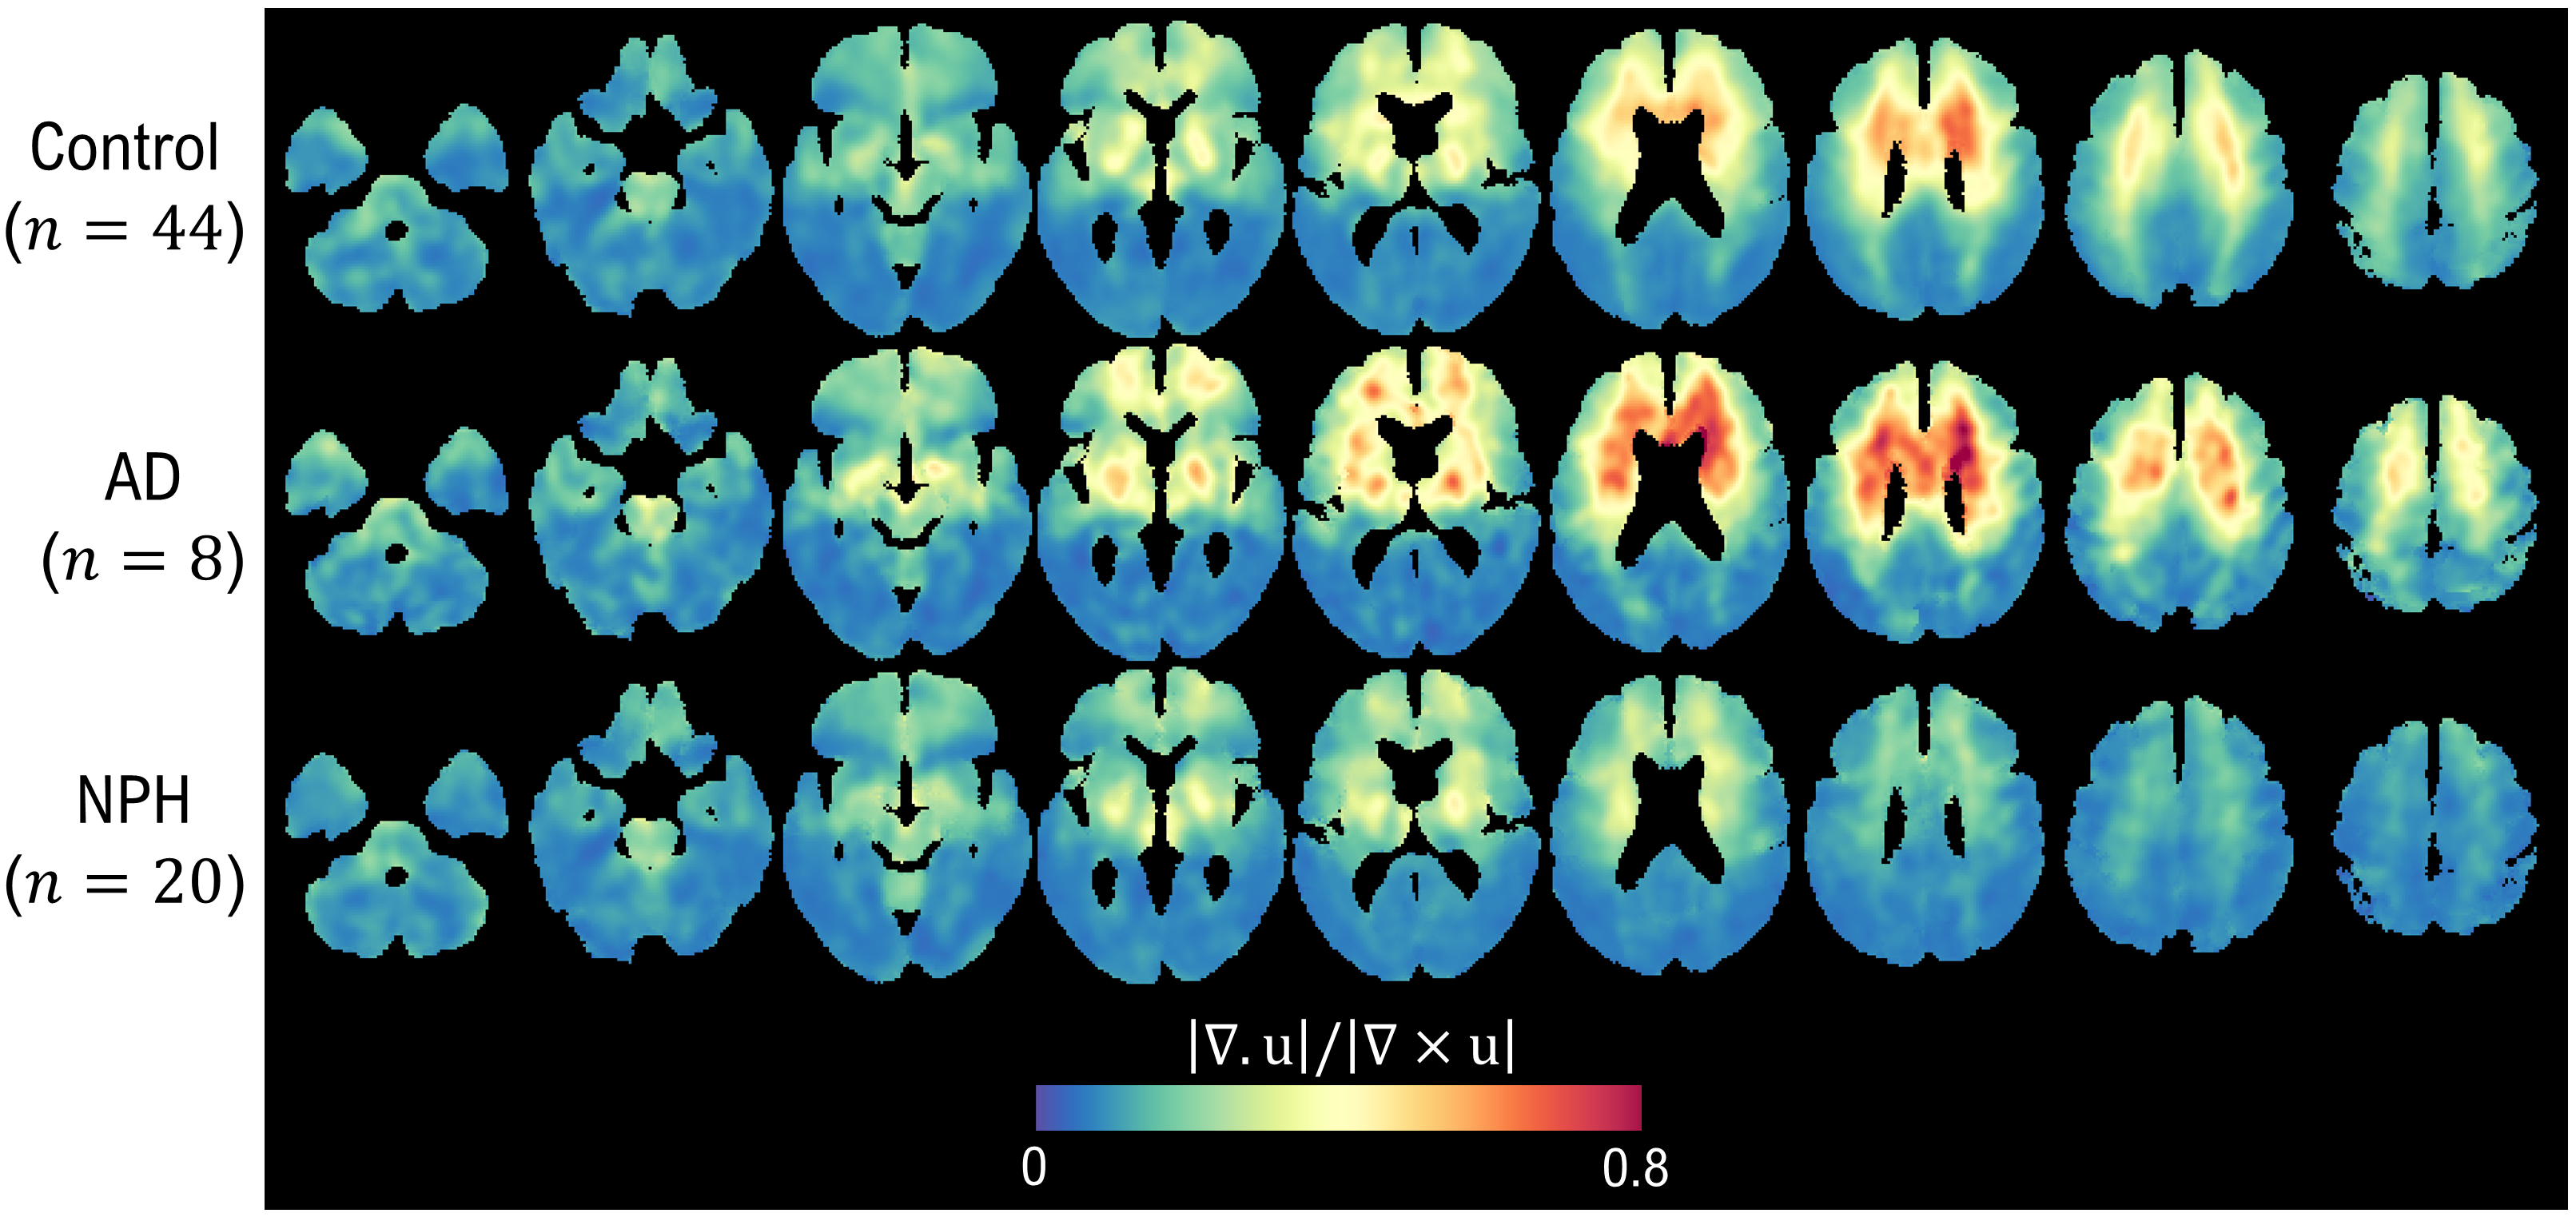
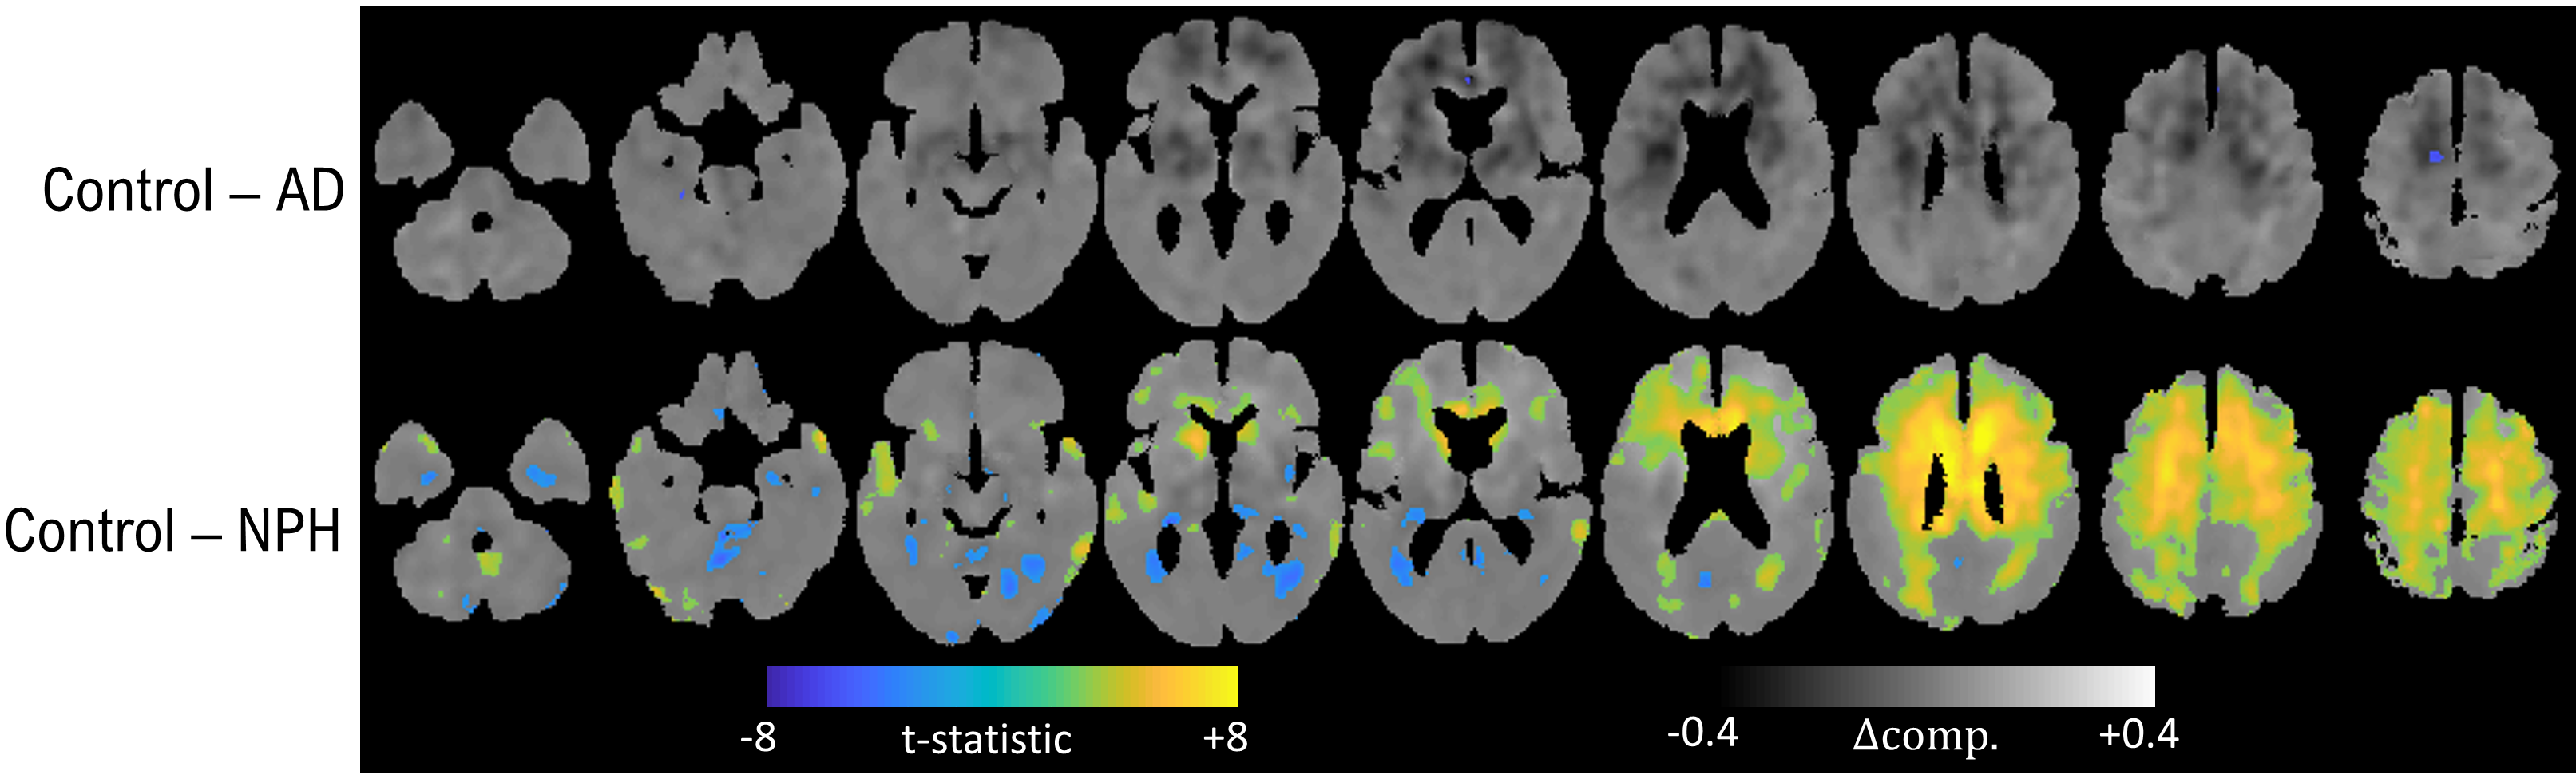
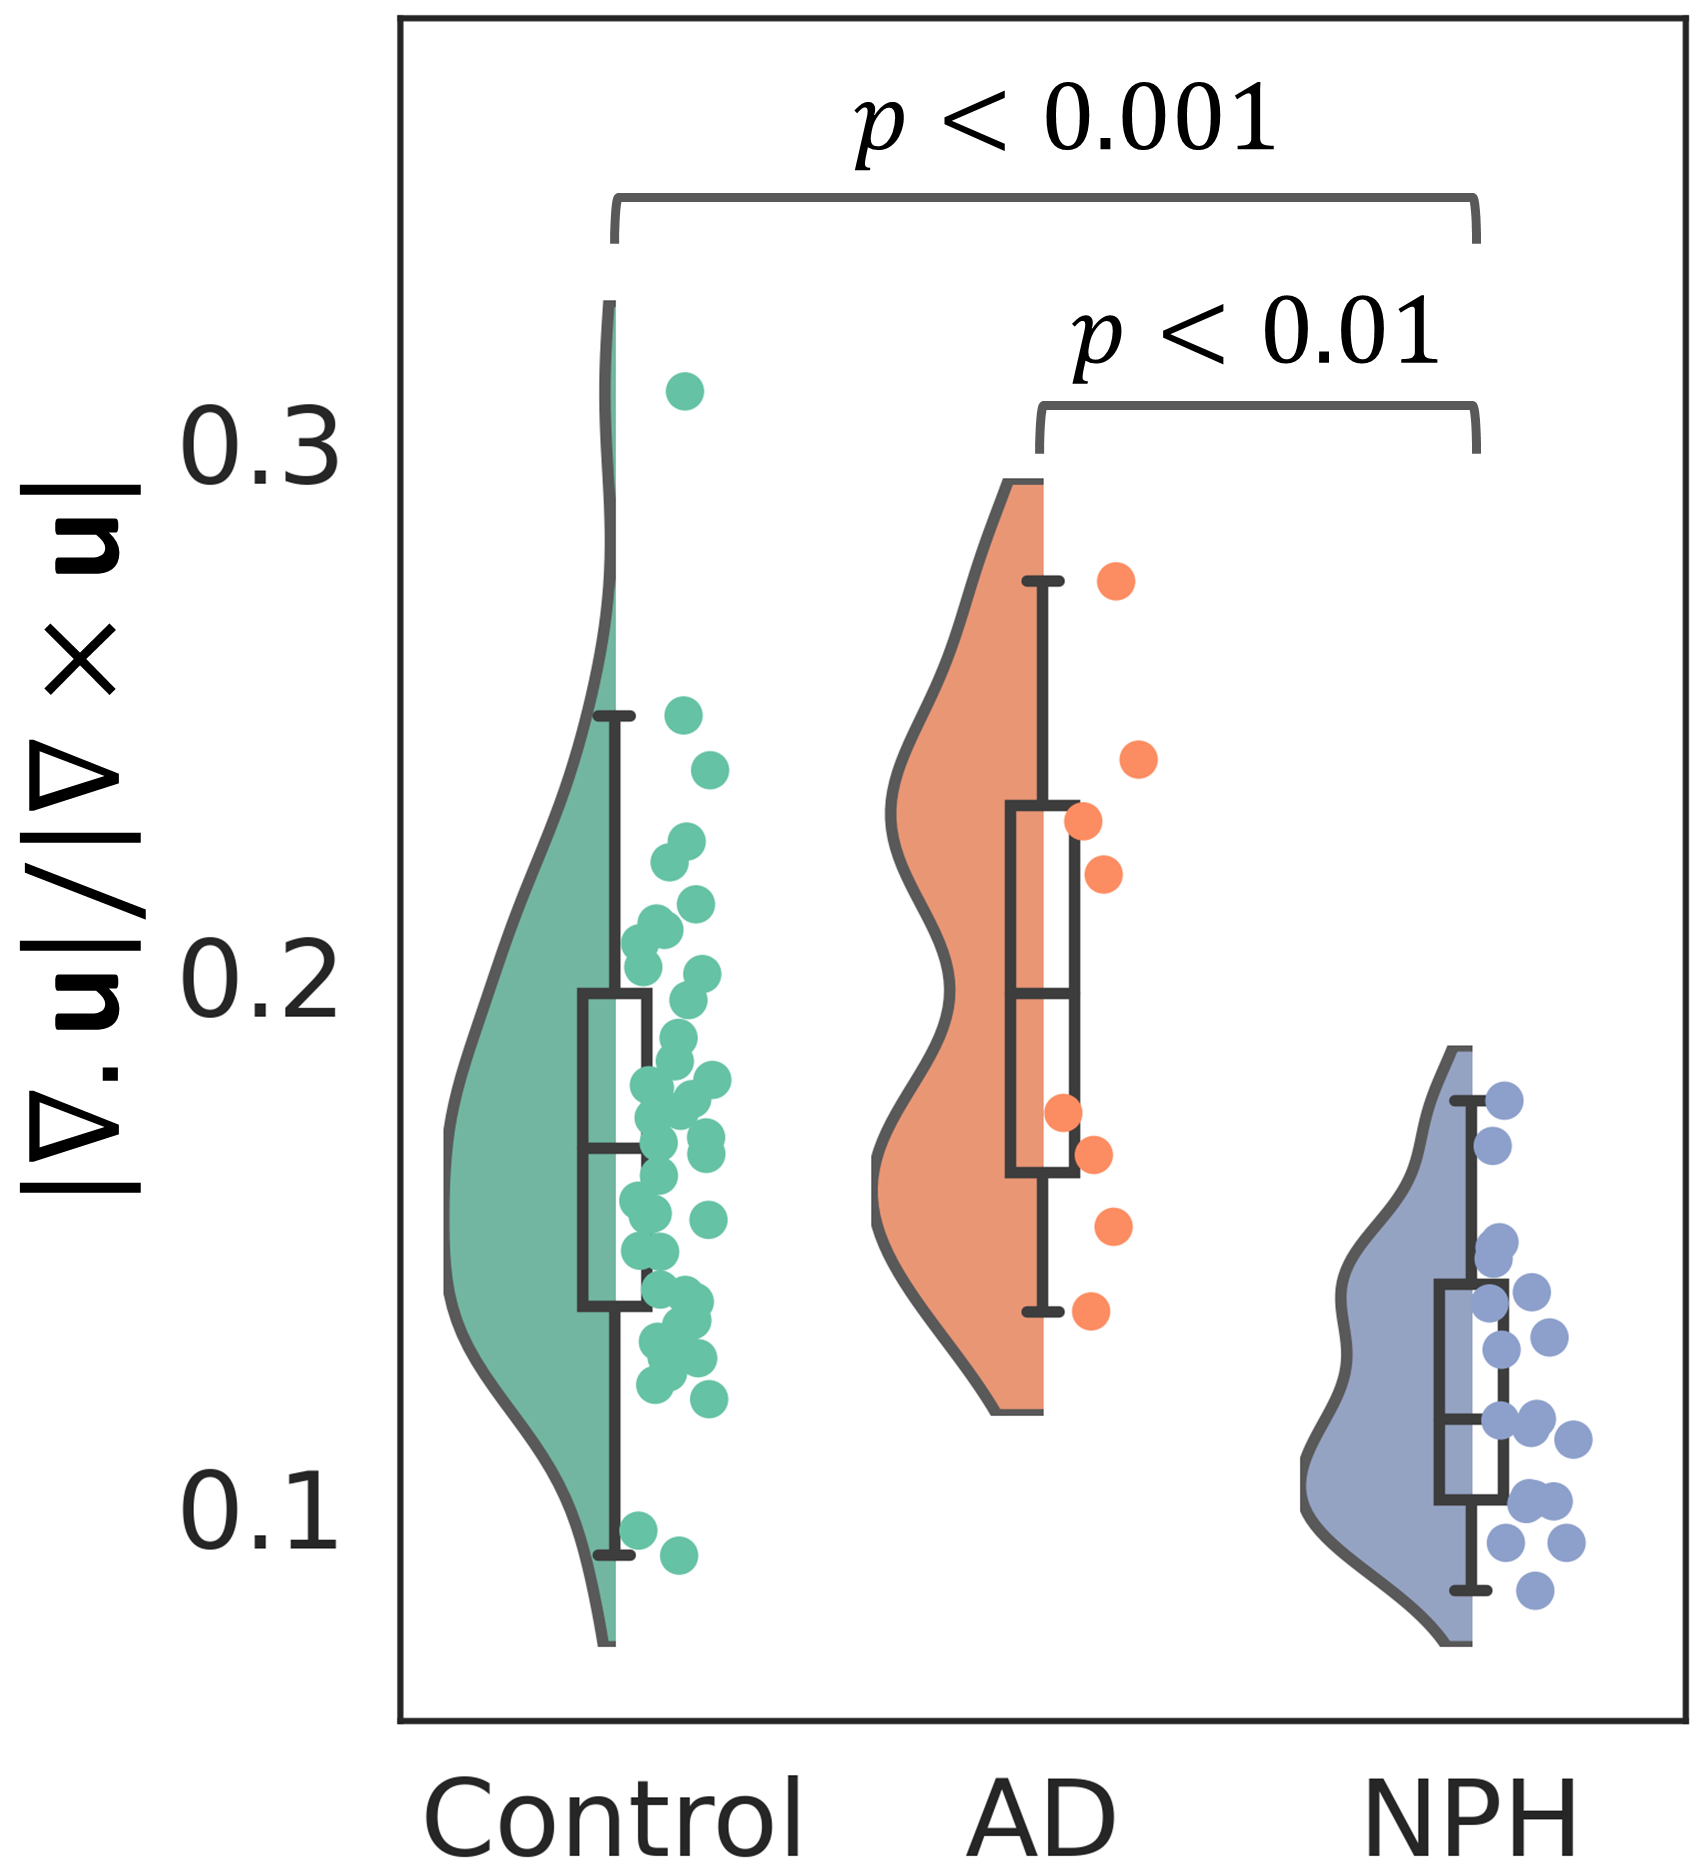
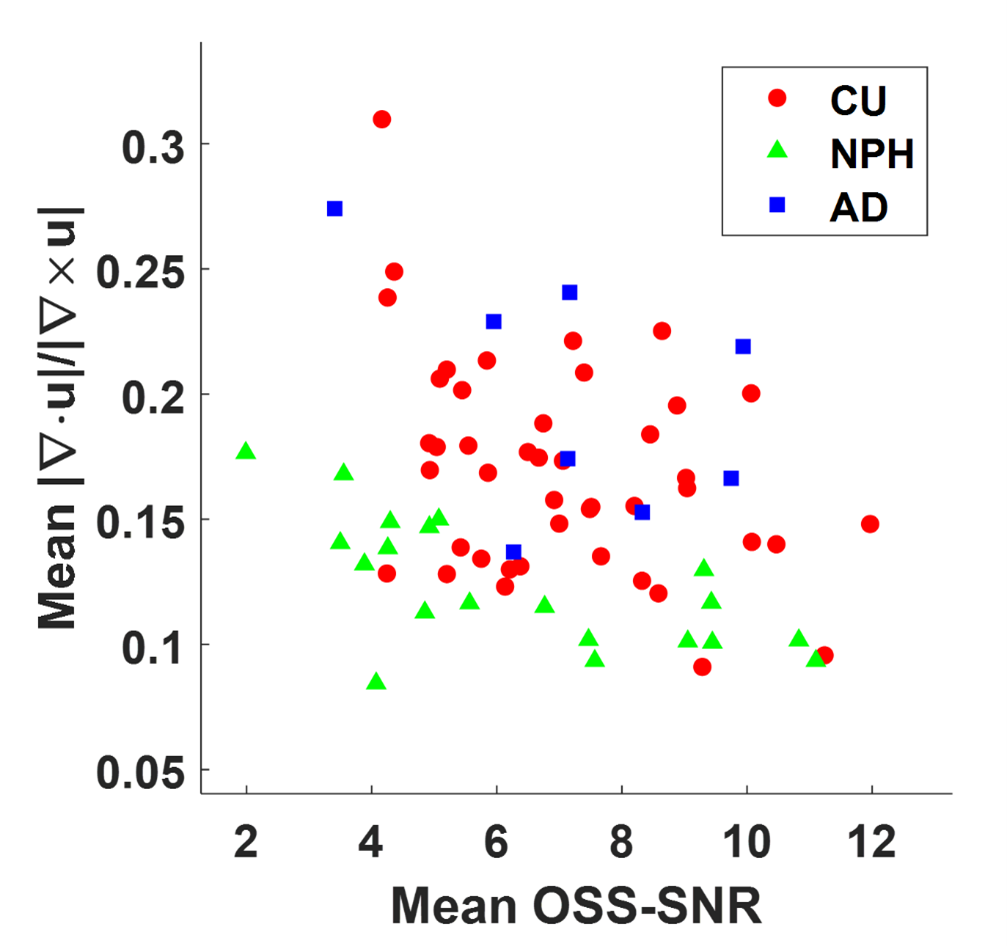
Figure 1 shows that the measure decreases with increasing Poisson’s ratio, reflecting the prescribed decrease in compressibility. The group averaged compressibility maps are presented in Figure 2. The three groups had distinct patterns for the measure of compressibility. Controls had higher values than NPH around the frontal periventricular region and towards the vertex of the brain. Similar patterns but with higher discrepancies were observed in the AD group. Figure 3 shows positive false discovery rate (pFDR) thresholded (Q<0.05) t-statistic maps overlaid on the voxel-wise difference maps comparing control with the other two groups. Between control and NPH, 103966 voxels reached a significant difference. Only 99 voxels reached the level of significance between control and AD. In Figure 4, we present the group-wise violin and box plots overlaid with jitter plots for mean values of the measure of compressibility over the entire brain. The Wilcoxon rank sum test and the Welch’s t-test showed significant differences between the NPH and AD groups (P<0.01) and NPH and control groups (P<0.001). Figure 5 shows a scatter plot of the compressibility measure versus octahedral shear strain signal to noise ratio (OSS-SNR) in each participant9. There were no statistically significant differences in OSS-SNR between groups, and the NPH group exhibited on average the lowest compressibility measurements across the range of observed SNR.DISCUSSION
The NPH brain is already compressed at the vertex, as evidenced by high convexity tight sulci (HCTS)10. Therefore, NPH showing decreased measure of compressibility towards the vertex of the brain is consistent with the pathophysiology of HCTS. However, pronounced increasing patterns of compressibility measure in AD was an interesting observation. This could be due to brain shrinkage caused by atrophy. However, the mechanical origin of such a behavior is not clear and warrants further investigation. Understanding disease processes is important in neurological disorders with overlapping symptoms. This is especially the case in NPH and AD, since NPH has a treatable form dementia compared to AD where the dementia can only be managed through support and medication11. Early detection of AD is important in delaying the development of the disease12.CONCLUSION
Tissue mechanical properties are sensitive to microstructure and can be assessed by MRE13. The compressibility measure presented with distinct structural patterns in NPH and AD, potentially arising due to different pathophysiological processes. Further investigation is needed to understand how this measure is affected by boundary conditions and shear properties. Nonetheless, compressibility measure is a promising biomarker for neurological diseases.Acknowledgements
No acknowledgement found.References
[1] L. M. Oliveira, R. Nitrini, and G. C. Román, "Normal-pressure hydrocephalus: A critical review," (in eng), Dement Neuropsychol, vol. 13, no. 2, pp. 133-143, Apr-Jun 2019, doi: 10.1590/1980-57642018dn13-020001.
[2] Z. Breijyeh and R. Karaman, "Comprehensive Review on Alzheimer's Disease: Causes and Treatment," (in eng), Molecules, vol. 25, no. 24, Dec 8 2020, doi: 10.3390/molecules25245789.
[3] M. B. Wallenstein and G. M. McKhann, "Salomón Hakim and the discovery of normal-pressure hydrocephalus," (in eng), Neurosurgery, vol. 67, no. 1, pp. 155-9; discussion 159, 2010/07// 2010, doi: 10.1227/01.neu.0000370058.12120.0e.
[4] A. K. Toma, M. C. Papadopoulos, S. Stapleton, N. D. Kitchen, and L. D. Watkins, "Systematic review of the outcome of shunt surgery in idiopathic normal-pressure hydrocephalus," (in eng), Acta Neurochir (Wien), vol. 155, no. 10, pp. 1977-80, Oct 2013, doi: 10.1007/s00701-013-1835-5.
[5] E. M. Wu et al., "Ventriculoperitoneal Shunt Outcomes of Normal Pressure Hydrocephalus: A Case Series of 116 Patients," (in eng), Cureus, vol. 11, no. 3, p. e4170, Mar 4 2019, doi: 10.7759/cureus.4170.
[6] A. Chandra, G. Dervenoulas, and M. Politis, "Magnetic resonance imaging in Alzheimer's disease and mild cognitive impairment," (in eng), J Neurol, vol. 266, no. 6, pp. 1293-1302, Jun 2019, doi: 10.1007/s00415-018-9016-3.
[7] J. M. Scott et al., "Impact of material homogeneity assumption on cortical stiffness estimates by MR elastography," (in eng), Magn Reson Med, vol. 88, no. 2, pp. 916-929, Aug 2022, doi: 10.1002/mrm.29226.
[8] J. Ashburner and K. J. Friston, "Unified segmentation," (in eng), Neuroimage, vol. 26, no. 3, pp. 839-51, Jul 1 2005, doi: 10.1016/j.neuroimage.2005.02.018.
[9] M. D. McGarry, E. E. Van Houten, P. R. Perriñez, A. J. Pattison, J. B. Weaver, and K. D. Paulsen, "An octahedral shear strain-based measure of SNR for 3D MR elastography," (in eng), Phys Med Biol, vol. 56, no. 13, pp. N153-64, Jul 7 2011, doi: 10.1088/0031-9155/56/13/n02.
[10] M. Hashimoto, M. Ishikawa, E. Mori, and N. Kuwana, "Diagnosis of idiopathic normal pressure hydrocephalus is supported by MRI-based scheme: a prospective cohort study," (in eng), Cerebrospinal Fluid Res, vol. 7, p. 18, Oct 31 2010, doi: 10.1186/1743-8454-7-18.
[11] K. G. Yiannopoulou and S. G. Papageorgiou, "Current and Future Treatments in Alzheimer Disease: An Update," (in eng), J Cent Nerv Syst Dis, vol. 12, p. 1179573520907397, 2020, doi: 10.1177/1179573520907397.
[12] J. Rasmussen and H. Langerman, "Alzheimer's Disease - Why We Need Early Diagnosis," (in eng), Degener Neurol Neuromuscul Dis, vol. 9, pp. 123-130, 2019, doi: 10.2147/dnnd.S228939.
[13] L. V. Hiscox et al., "Magnetic resonance elastography (MRE) of the human brain: technique, findings and clinical applications," (in eng), Phys Med Biol, vol. 61, no. 24, pp. R401-r437, Dec 21 2016, doi: 10.1088/0031-9155/61/24/r401.
Figures