0665
Hyperintense globus pallidus rim sign on 7T MRI is a novel biomarker of neurological Wilson’s disease1Department of Neurology, Beijing Tiantan Hospital, Capital Medical University, Beijing, China, 2Tiantan Neuroimaging Center of Excellence, Beijing Tiantan Hospital, Capital Medical University, Beijing, China, 3Department of Hepatology, Beijing Youan Hospital, Capital Medical University, Beijing, China, 4Department of Neurology, Xuanwu Hospital, Capital Medical University, National Clinical Research Center for Geriatric Disorders, Beijing, China, 5Senior Department of Hepatology, the Fifth Medical Center of PLA General Hospital, Beijing, China, 6Hinda and Arthur Marcus Institute for Aging Research, Hebrew SeniorLife, Roslindale, MA, United States, 7Pacific Parkinson’s Research Centre, Djavad Mowafaghian Centre for Brain Health, University of British Columbia, Vancouver, BC, Canada, 8MR Research Collaboration Team, Siemens Healthineers, Beijing, China, 9Department of Neurology and Centre of Clinical Neuroscience, First Faculty of Medicine, Charles University and General University Hospital, Prague, Czech Republic, 10Department of Neurology, Jiading Branch of Shanghai General Hospital, Shanghai Jiao Tong University School of Medicine, Shanghai, China
Synopsis
Keywords: Other Neurodegeneration, Neurodegeneration, Wilson's disease; 7T MRI; biomarker; metal deposition pattern
Motivation: Excessive subcortical metal deposition seen on susceptibility imaging has suggested a characteristic pattern in neurological Wilson’s disease (NWD).
Goal(s): To develop a novel imaging biomarker of NWD using 7T SWI.
Approach: WD patients, monoallelic ATP7B variant carriers, health controls, and patients with comparable clinical or imaging manifestations were recruited for development of a novel biomarker of NWD and exploratory comparative analysis. All underwent 7T SWI with quantitative susceptibility mapping and principal component analysis performed.
Results: The novel biomarker of NWD termed "hyperintense globus pallidus rim sign" showed high diagnostic accuracy. It revealed a special metal deposition pattern in the lenticular nucleus in NWD.
Impact: A novel imaging biomarker of neurological Wilson’s disease (NWD) termed "hyperintense globus pallidus rim sign" could aid the diagnosis and monitoring of NWD.
Introduction
Non-invasive, fast, and accurate neuroimaging features of neurological Wilson’s disease (NWD), a rare inherited disorder, could reduce diagnosis error or delay. Excessive subcortical iron deposition on susceptibility imaging suggested a special metal deposition pattern in NWD. With submillimeter spatial resolution and increased contrast, 7 Tesla (7T) susceptibility-weighted imaging (SWI) may provide an access to a novel imaging biomarker of NWD.Methods
Using 7T SWI, we conducted a diagnostic study aimed at developing a novel imaging biomarker of NWD and investigating its diagnostic value and underlying mechanism. Between May 2021 and June 2023, 72 WD patients (41 NWD patients, 31 non-NWD (nNWD) patients), 22 monoallelic ATP7B variant carriers, and 41 health controls (HC) were recruited from two movement disorder centers and two hepatology centers in China for the present study. Patients with other diseases with comparable clinical or imaging manifestations, including early-onset Parkinson’s disease (EOPD) (n = 15), multiple system atrophy (MSA) (n = 30), progressive supranuclear palsy (PSP) (n = 15), and neurodegeneration with brain iron accumulation (NBIA) (n = 12) were assessed for exploratory comparative analysis. All participants underwent 7T MRI (MAGNETOM Terra, Siemens Healthcare, Erlangen, Germany) using a 32-channel Rx/8Tx head-coil (Nova Medical, Wilmington, Massachusetts, USA) with a circular polarized B1 mode. High-resolution SWI was scanned with the following parameters: transverse scan, acquisition voxel = 0.3×0.3×1.2 mm3, 104 slices, TE = 12 ms, TR = 19 ms, flip angle = 14°, acceleration factor = 3, scan time = 6:47. Investigators were blinded to participant diagnosis during imaging evaluation. QSM was reconstructed using the multi-scale dipole inversion method from the single-echo gradient-echo data in MATLAB (version R2020b, MathWorks, Natick, MA). The quantitative magnetic susceptibility (with the unit of parts per million [ppm]) was extracted in the regions of interest including the globus pallidus and putamen. Voxel-wise PCA was performed on MNI-space QSM data.Results
We identified a linear signal intensity change consisting of a hyperintense strip at the lateral border of the globus pallidus and a hypointense signal of the globus pallidus and putamen in NWD patients on the SWI images, and we termed this “hyperintense globus pallidus rim sign”.The presence of the hyperintense globus pallidus rim sign was defined as a linear pseudo-hyperintense signal at the lateral border of the globus pallidus due to hypointense signal of the globus pallidus and putamen, with more than 50% of the length of lateral border of the globus pallidus on at least three serial planes of axial SWI images, starting from the thalamus level above the red nucleus, substantia nigra, and subthalamic nucleus and moving rostrally. This feature was detected in 38 of the 41 NWD patients, and was negative in all nNWD patients, monoallelic ATP7B variant carriers, HC, EOPD, MSA, PSP, and NBIA patients. Its sensitivity to differentiate between NWD and HC was 92.7% and specificity was 100%. Correlation analysis established a positive correlation between severity of the hyperintense globus pallidus rim sign measured by semiquantitative scale and neurological severity measured by UWDRS scores after regression of age, disease duration, and treatment duration (r = 0.874, p < 0.001). QSM and PCA showed increased susceptibility of the lenticular nucleus with high regional weights in the lateral globus pallidus and medial putamen in NWD patients.Discussion
In this diagnostic study, we identified a novel neuroimaging feature of NWD termed “hyperintense globus pallidus rim sign”, which demonstrated excellent diagnostic performance. The hyperintense globus pallidus rim sign was positive in the only one NWD patient with monoallelic ATP7B variants and was negative in all 22 monoallelic ATP7B variant carriers in our study. The hyperintense globus pallidus rim sign can thus assist in the diagnosis of individuals with monoallelic ATP7B variants. We also established a semiquantitative scoring criterion, termed “hyperintense globus pallidus rim sign score”, and confirmed its positive correlation with UWDRS scores in NWD patients. Thus, it could also be utilized as a reliable biomarker for monitoring of neurological impairment. QSM and PCA showed excessive metal deposition in the lenticular nucleus with high regional weights in the lateral globus pallidus and medial putamen in NWD patients, implying a special metal deposition pattern of NWD. However, alterations of the hyperintense globus pallidus rim sign in NWD patients due to treatment effect and in nNWD patients who later develop neurological symptoms require further verification in cohort studies.Conclusion
The hyperintense globus pallidus rim sign showed high sensitivity and excellent specificity for diagnosis and differential diagnosis of NWD. This feature is related to a special metal deposition pattern in lenticular nucleus in NWD.Acknowledgements
This work was supported by the National Natural Science Foundation of China (No. 82271459 and No. 82071422) and Natural Science Foundation of Beijing Municipality (No. 7212031). We would like to acknowledge the support of the participants and their families for taking part in the study. We thank all research staff at the four participating sites and Dr. Michael L. Schilsky for revision of the manuscript. Their dedication made the study feasible.
The authors report no competing interests.
References
1. Czlonkowska A, Litwin T, Dusek P, et al. Wilson disease. Nat Rev Dis Primers. 2018 Sep 6;4(1):21.
2. Ferenci P, Caca K, Loudianos G, et al. Diagnosis and phenotypic classification of Wilson disease. Liver international : official journal of the International Association for the Study of the Liver. 2003;23(3):139-42.
3. Shribman S, Poujois A, Bandmann O, Czlonkowska A, Warner TT. Wilson's disease: update on pathogenesis, biomarkers and treatments. J Neurol Neurosurg Psychiatry. 2021 Oct;92(10):1053-61.
4. Beinhardt S, Leiss W, Stättermayer AF, et al. Long-term outcomes of patients with Wilson disease in a large Austrian cohort. Clin Gastroenterol Hepatol. 2014;12(4):683-9.
5. Merle U, Schaefer M, Ferenci P, Stremmel W. Clinical presentation, diagnosis and long-term outcome of Wilson's disease: a cohort study. Gut. 2007;56(1):115-20.
6. EASL Clinical Practice Guidelines: Wilson's disease. Journal of hepatology. 2012;56(3):671-85.
7. Das SK, Ray K. Wilson's disease: an update. Nat Clin Pract Neurol. 2006;2(9):482-93.
8. Dusek P, Bahn E, Litwin T, et al. Brain iron accumulation in Wilson disease: a post mortem 7 Tesla MRI - histopathological study. Neuropathol Appl Neurobiol. 2017 Oct;43(6):514-32.
9. Litwin T, Gromadzka G, Szpak G, Jabłonka-Salach K, Bulska E, Członkowska A. Brain metal accumulation in Wilson's disease. Journal of the neurological sciences. 2013;329:55-8.
10. Li G, Wu R, Tong R, et al. Quantitative Measurement of Metal Accumulation in Brain of Patients With Wilson's Disease. Movement disorders : official journal of the Movement Disorder Society. 2020;35(10):1787-95.
11. Dusek P, Lescinskij A, Ruzicka F, et al. Associations of Brain Atrophy and Cerebral Iron Accumulation at MRI with Clinical Severity in Wilson Disease. Radiology. 2021;299(3):662-72.
12. Su D, Zhang Z, Zhang Z, et al. Microstructural and functional impairment of the basal ganglia in Wilson's disease: a multimodal neuroimaging study. Frontiers In Neuroscience. 2023;17:1146644.
13. Cong F, Liu X, Liu C, et al. Improved depiction of subthalamic nucleus and globus pallidus internus with optimized high-resolution quantitative susceptibility mapping at 7 T. NMR in biomedicine. 2020;33(11):e4382.
14. Yao B, Li T, Gelderen P, Shmueli K, de Zwart J, Duyn J. Susceptibility contrast in high field MRI of human brain as a function of tissue iron content. NeuroImage. 2009;44(4):1259-66.
15. Acosta-Cabronero J, Milovic C, Mattern H, Tejos C, Speck O, Callaghan MF. A robust multi-scale approach to quantitative susceptibility mapping. NeuroImage. 2018;183.
Figures
Figure 1 Sketch map and scoring criteria of the hyperintense globus pallidus rim sign.
(A) A sketch map of the hyperintense globus pallidus rim sign with a linear hyperintensity (arrow) at the lateral border of the globus pallidus and a hypointense signal of the globus pallidus and putamen on axial SWI image of the basal ganglia. (B) Scoring criteria of the hyperintense globus pallidus rim sign show NWD patients with a score of 2 (a) and a score of 1 (b) on both sides, and HC (c) and EOPD patient (d) with a score of 0 on both sides.
Figure 2 Flowchart of the image assessment procedures.
First, all participants underwent 7T MRI scanning. Second, a novel imaging feature, the hyperintense globus pallidus rim sign, was identified and subsequently evaluated in other diseases and T2/SWI hypointensity were also assessed in all participants. Meanwhile, a semiquantitative scale was developed for correlation analysis. Finally, quantitative susceptibility mapping and principal component analysis of the putamen and globus pallidus were performed.
Figure 3 SWI images of the basal ganglia in the NWD, nNWD, and HC groups.
Axial 7T SWI images of the basal ganglia show typical NWD patients (A1)-(A6), age-matched HC (B1)-(B6) and nNWD patients (C1)-(C6). The hyperintense globus pallidus rim sign is only observed in NWD patients.
Figure 4 SWI images of the basal ganglia in the monoallelic ATP7B variant carriers, EOPD, MSA-P, MSA-C, PSP, and NBIA groups.
Axial 7T SWI images of the basal ganglia show negative hyperintense globus pallidus rim sign in monoallelic ATP7B variant carriers (A1)-(A3), EOPD patients (B1)-(B3), MSA-P patients (C1)-(C3), MSA-C patients (D1)-(D3), PSP patients (E1)-(E3), and NBIA patients (F1)-(H3).
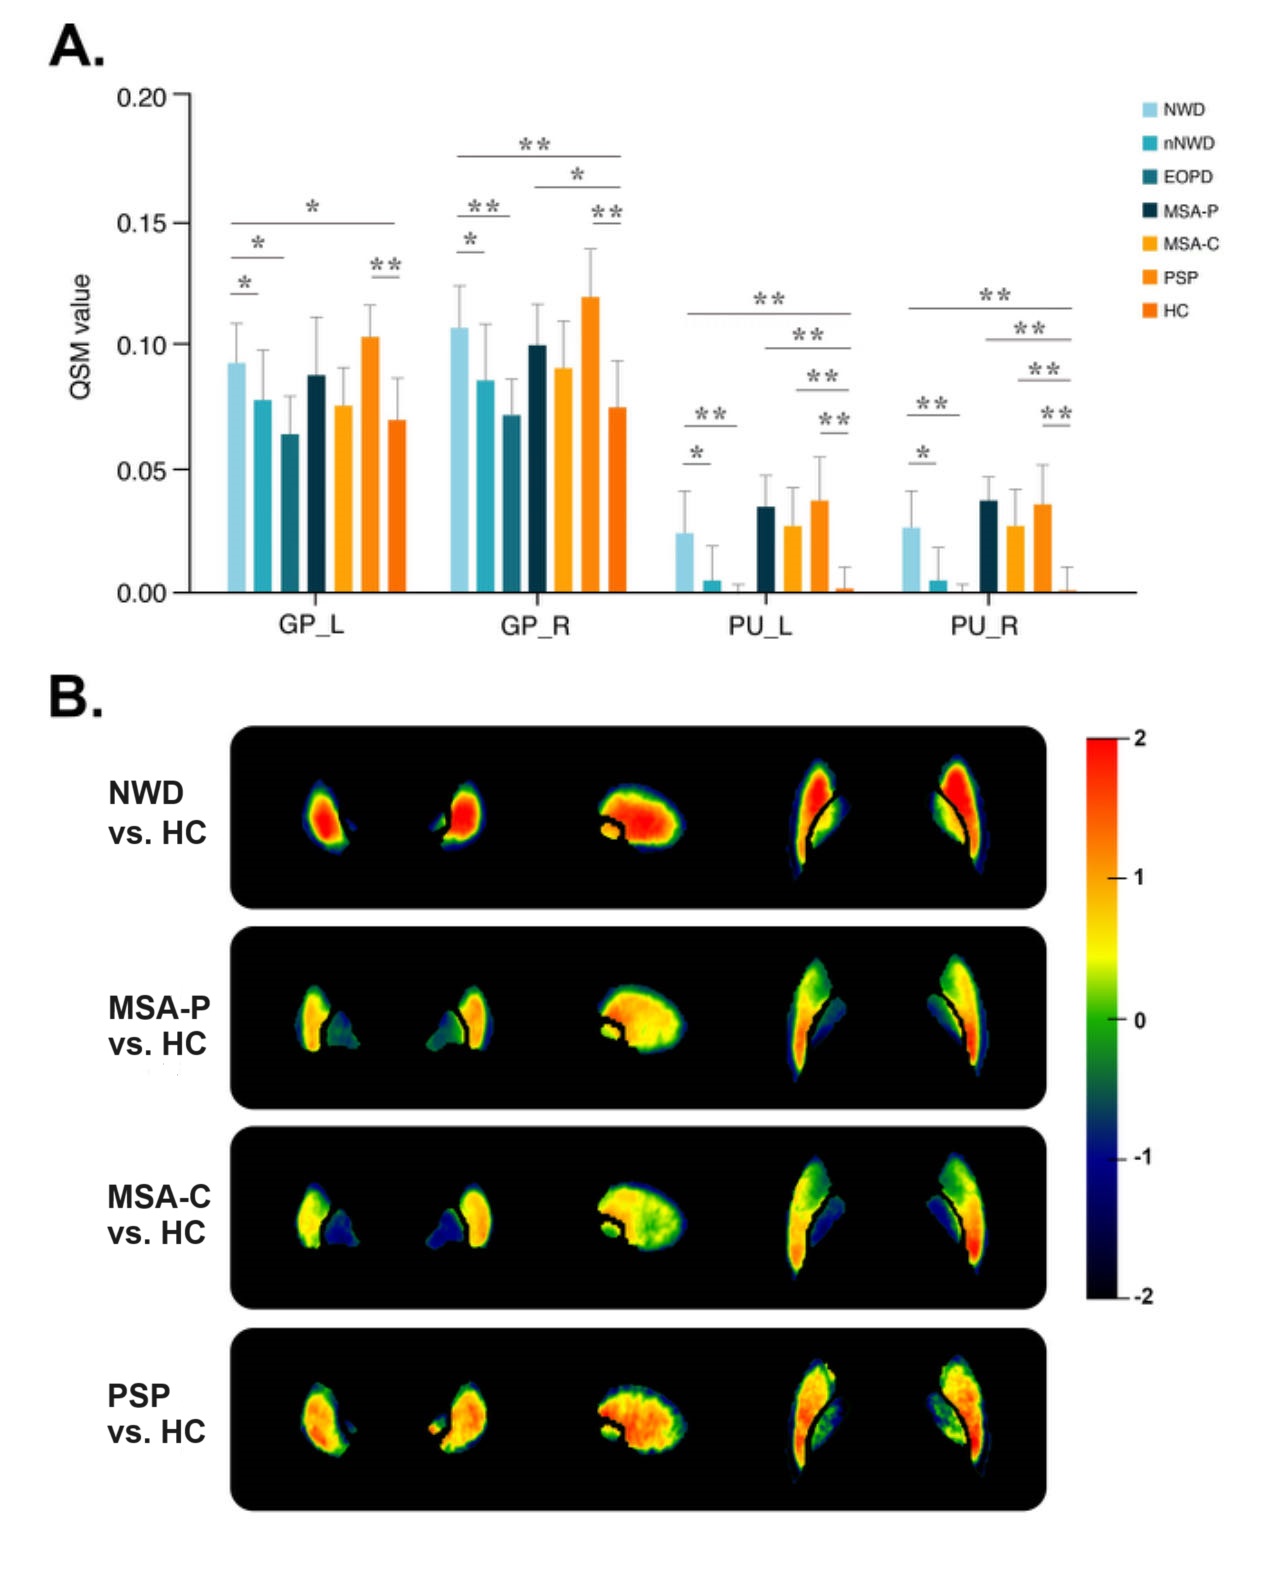
Figure 5 Comparison of QSM values and PCA of QSM.
(A) Comparison of QSM values of the NWD, nNWD, EOPD, MSA-P, MSA-C, PSP, and HC groups. (B) Regional weights of the QSM component in the NWD, MSA-P, MSA-C, and PSP groups compared with HC, respectively. The colours represent the region-specific weights on each component.* P < 0.05, ** P < 0.001.