0664
Difference in the spatial pattern of brain atrophy associated with Alzheimer’s and LATE neuropathology1Department of Biomedical Engineering, Illinois Institute of Technology, Chicago, IL, United States, 2Rush Alzheimer’s Disease Center, Rush University Medical Center, Chicago, IL, United States
Synopsis
Keywords: Other Neurodegeneration, Aging, LATE, Alzheimer’s, Neuropathology, Aging, Postmortem MRI
Motivation: Alzheimer’s disease neuropathologic change (AD-NC) and limbic-predominant age-related TDP-43 encephalopathy neuropathologic change (LATE-NC) are common age-related pathologies and are associated with brain atrophy, especially in the medial temporal lobe. However, the difference in atrophy patterns associated with the two pathologies is not well known.
Goal(s): To investigate the difference in brain atrophy patterns associated with AD-NC and LATE-NC.
Approach: Ex-vivo MRI and detailed neuropathology were combined in a large number of community-based older adults that came to autopsy.
Results: LATE-NC stages 2 or 3 are associated with more atrophy in the anterior portion of the hippocampus compared to moderate or severe AD-NC.
Impact: Atrophy in the anterior portion of the hippocampus is more severe with LATE-NC stages 2 or 3 than with moderate or severe AD-NC.
Introduction
Alzheimer’s disease neuropathologic change (AD-NC) 1 and limbic-predominant age-related TDP-43 encephalopathy neuropathologic change (LATE-NC) 2 are common in older adults and have been associated with brain atrophy, cognitive decline, and dementia 3. Furthermore, AD-NC and LATE-NC are often comorbid increasing the odds for dementia 4,5. Since AD-NC and LATE-NC are often comorbid and due to the fact that LATE-NC can only be detected at autopsy, the differential effects of the two pathologies on brain morphometry have not been systematically investigated. In this work, we combined deformation-based morphometry (DBM) 6,7,8,9,10 on ex-vivo brain MRI and detailed neuropathological evaluation in a large number of community-based older adults (N=912) that came to autopsy to investigate the difference in brain atrophy patterns associated with AD-NC and LATE-NC.Methods
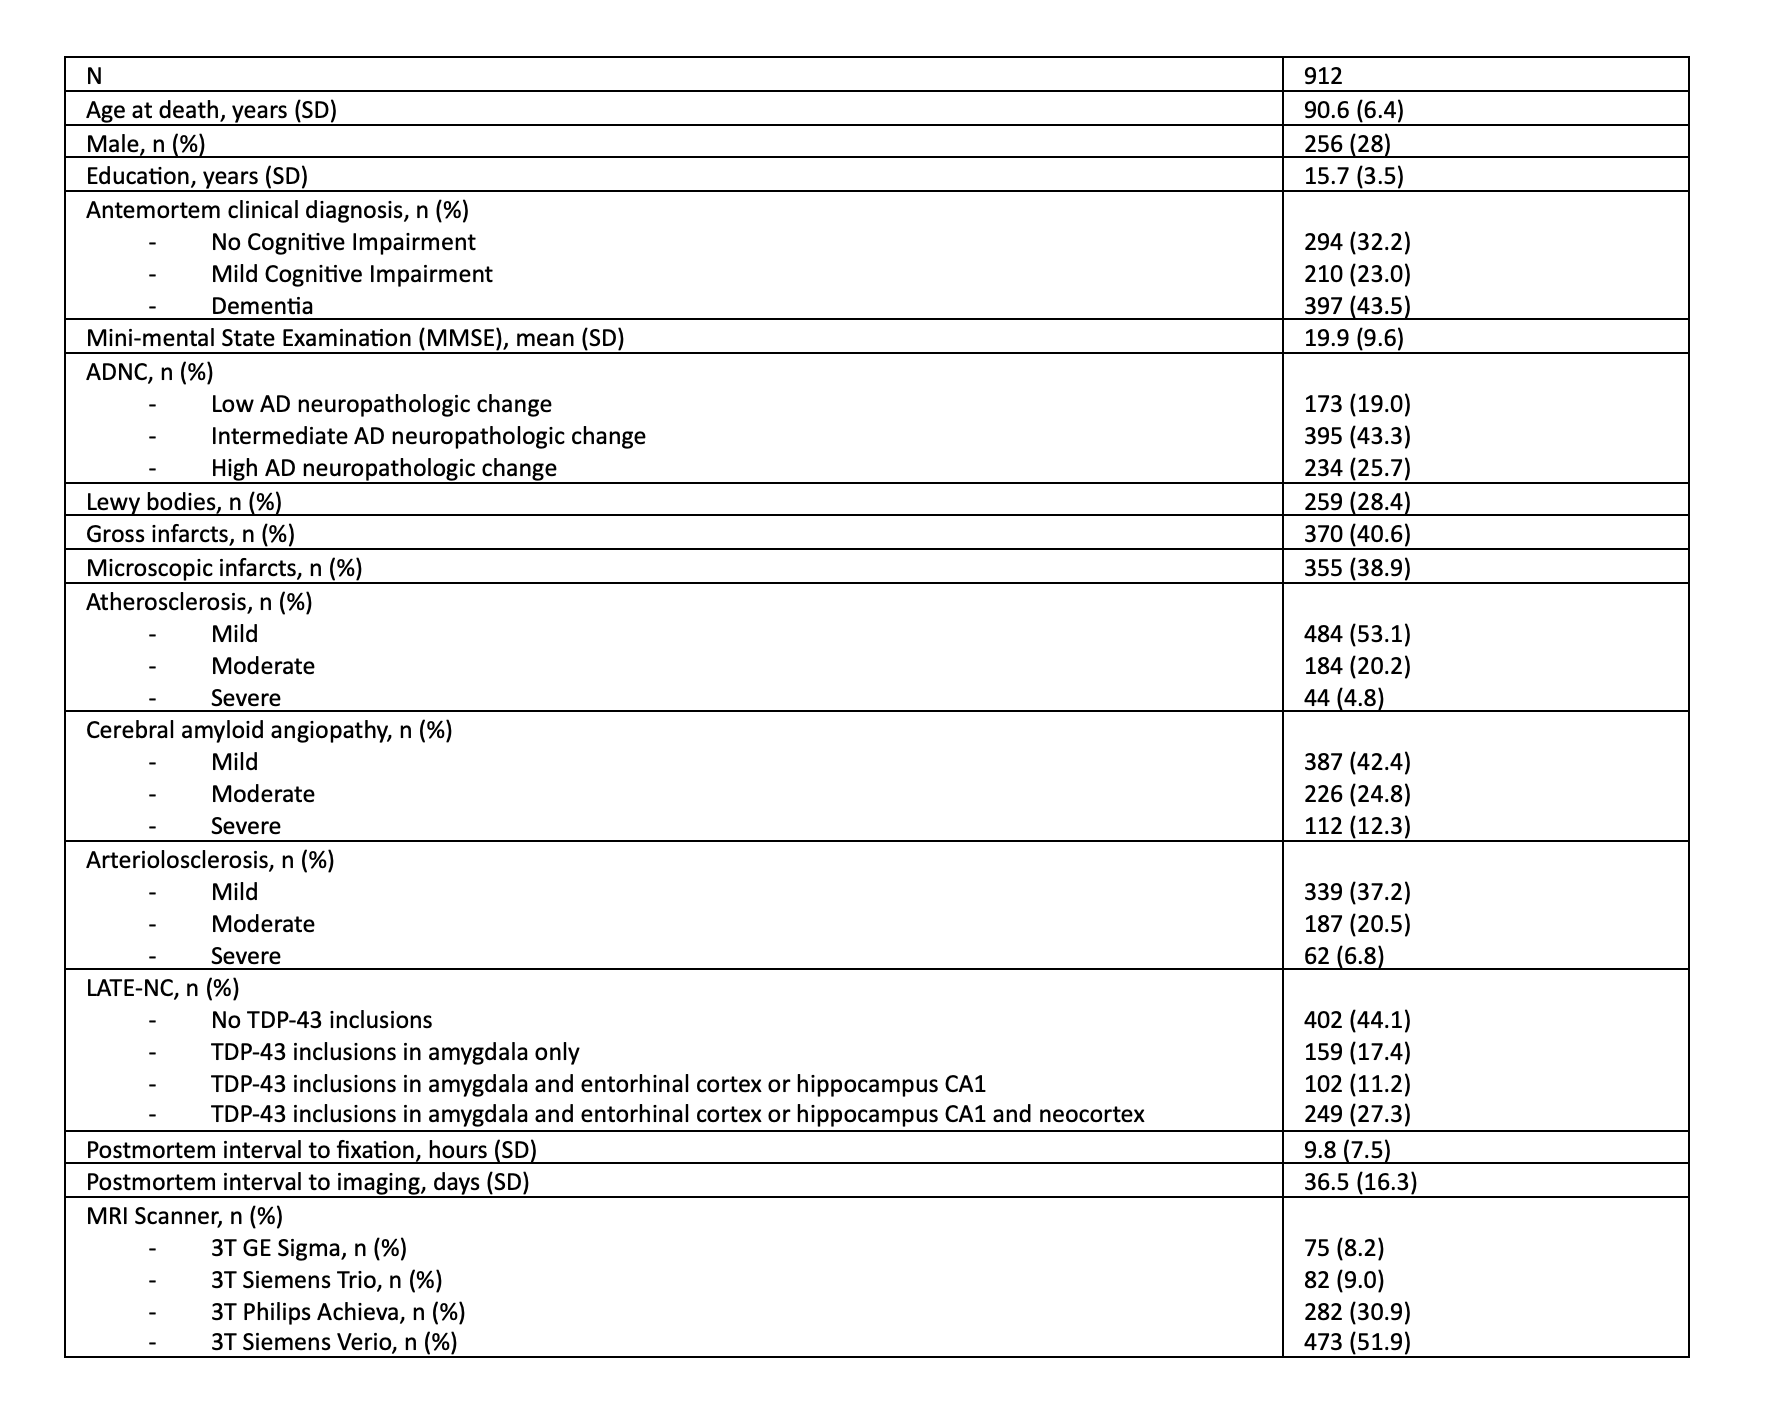
Participants and DataCerebral hemispheres from 912 older adults participating in four longitudinal, clinical-pathologic cohort studies of aging were included in this work: the Rush Memory and Aging Project (MAP), Religious Orders Study (ROS), Minority Aging Research Study (MARS), and the African American Clinical Core (AA Core) of the Rush Alzheimer’s Disease Research Center (Rush ADRC) (Fig.1) 11,12. All hemispheres were imaged ex-vivo on 3T clinical MRI scanners approximately 1-month postmortem while immersed in 4% formaldehyde solution. T2-weighted images of all hemispheres were non-linearly registered to a brain hemisphere template using ANTs 13. The logarithm of the Jacobian determinant (LogJ) of the deformation field was calculated in each voxel, and the resulting maps were smoothed by a Gaussian filter with FWHM=4mm. Following ex-vivo MRI, all hemispheres underwent detailed neuropathologic examination by a board-certified neuropathologist. The pathologies that were assessed were AD-NC, LATE-NC, Lewy bodies, gross infarcts, microscopic infarcts, arteriolosclerosis, atherosclerosis, and cerebral amyloid angiopathy. Participants were divided into four groups: AD-NC-neg LATE-NC-neg (n=453), AD-NC-pos LATE-NC-neg (n=108), AD-NC-neg LATE-NC-pos (n=225), and AD-NC-pos LATE-NC-pos (n=126), where AD-NC-pos was defined as moderate or severe AD-NC according to the NIA-AA criteria 1 , and LATE-NC-pos was defined as LATE-NC stages 2 or 3.
Statistical analysis
Voxel-wise linear regression was used to test the association of the deformations observed in the smoothed log Jacobian maps with the four different groups, controlling for all other neuropathologies, demographics (age, sex, years of education), postmortem intervals, and scanner. The analysis was conducted using FSL PALM 14, assuming different variances across scanners. Permutations were performed exclusively among participants imaged on the same scanner. We used 5000 permutations, and statistical significance was set at p<0.05 after family wise error (FWE) correction. Significant clusters were defined using threshold-free cluster enhancement (TFCE).
Results and Discussion
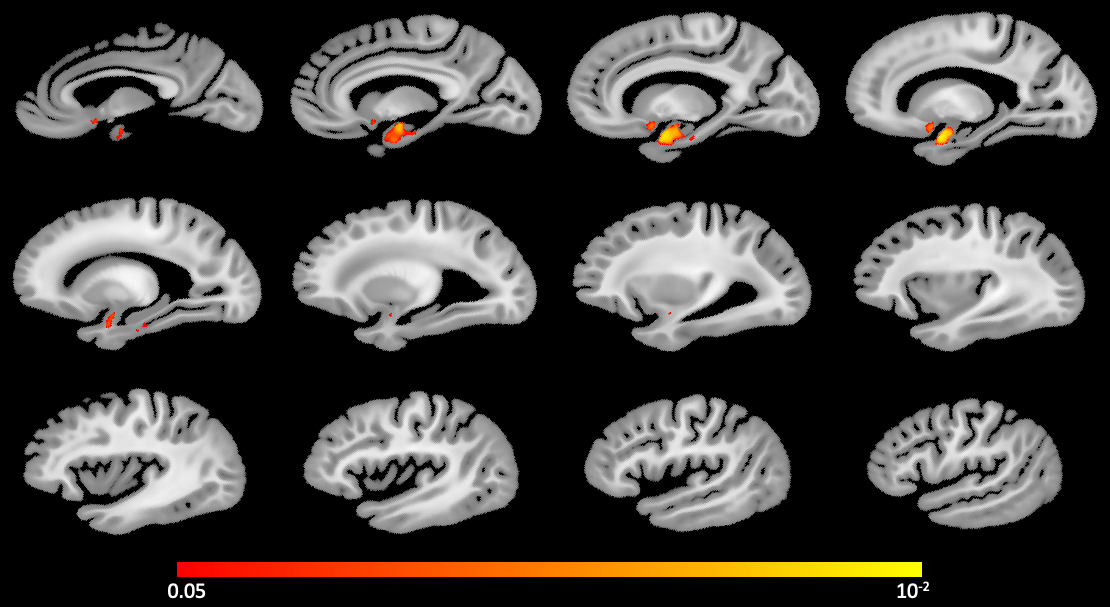
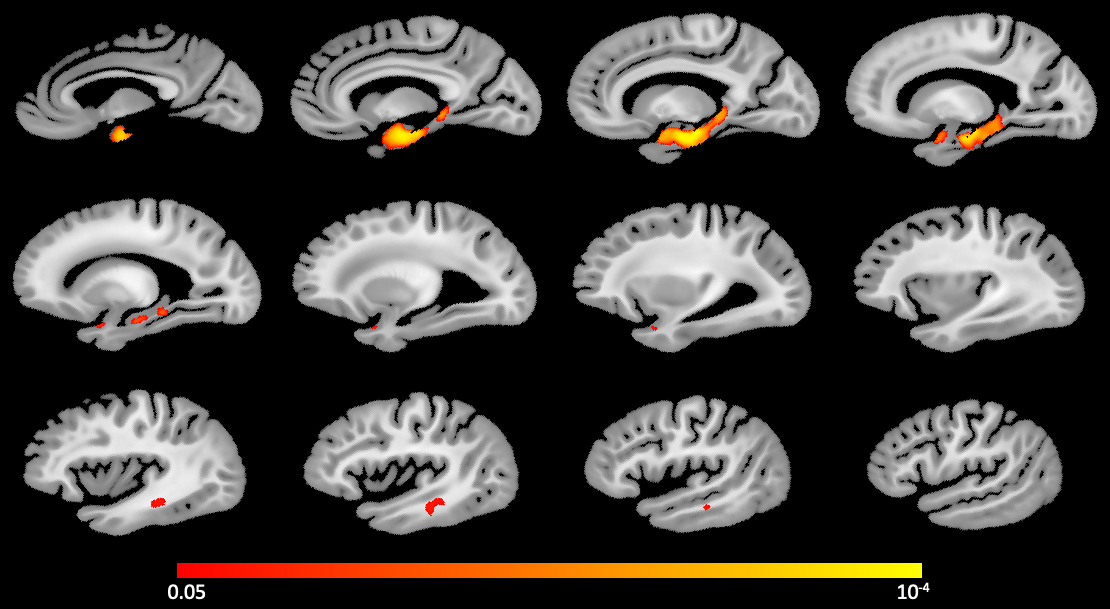
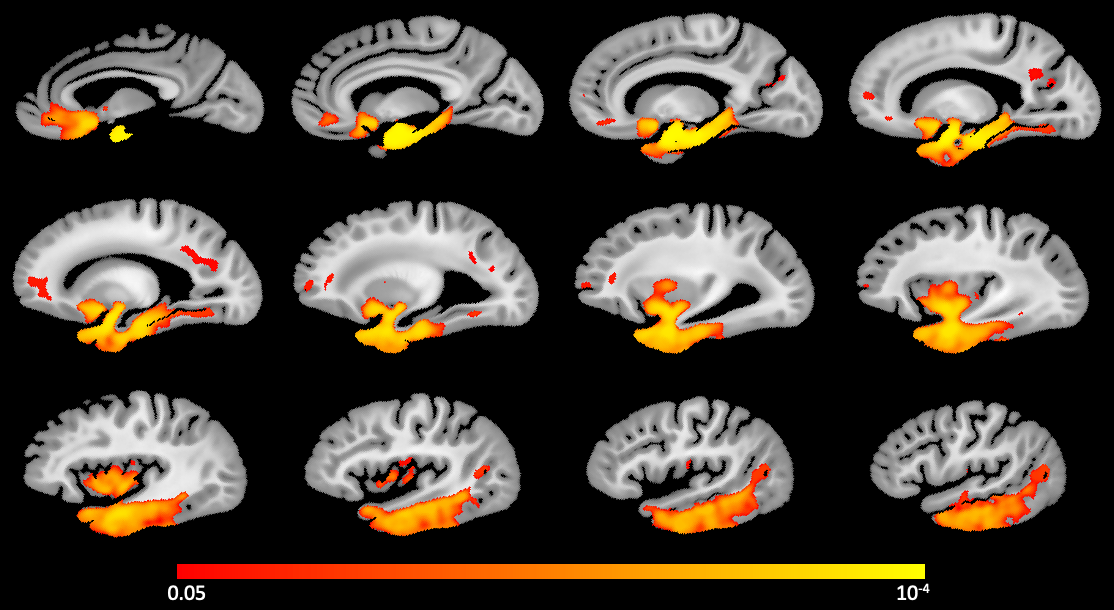
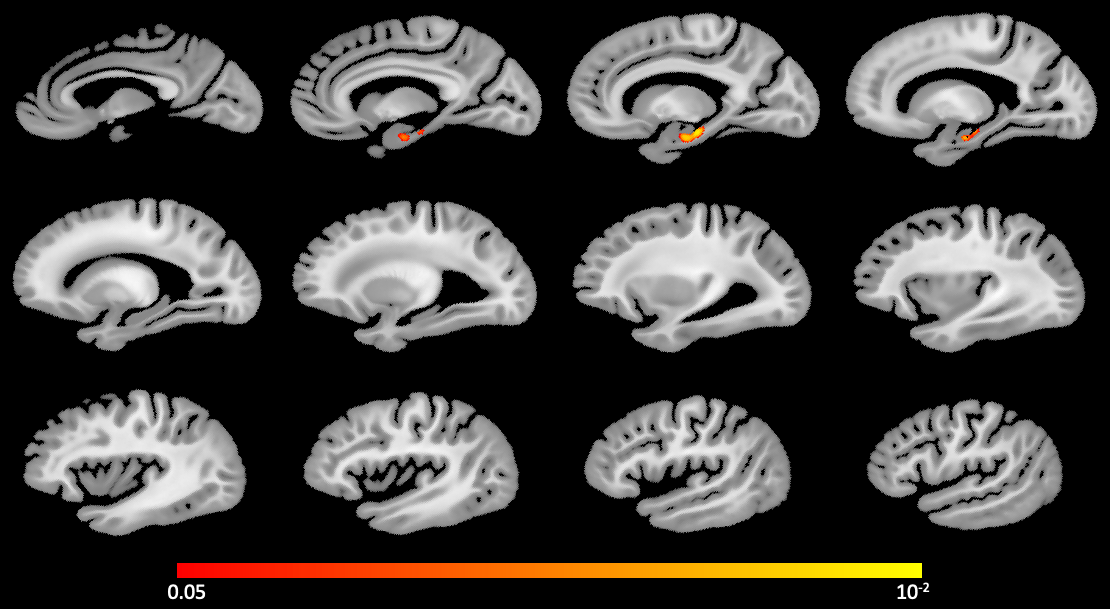
Both the AD-NC-pos LATE-NC-neg group (Fig.2) as well as the AD-NC-neg LATE-NC-pos group (Fig.3) were associated with lower tissue volume mainly in medial temporal lobe structures, controlling for all other pathologies and demographics 15-23. The AD-NC-pos LATE-NC-pos group (Fig.4) showed substantially lower volume in the temporal, frontal, and parietal lobes 4,24,25,27-29. Interestingly, the AD-NC-neg LATE-NC-pos group showed lower volume in the anterior portion of the hippocampus than the AD-NC-pos LATE-NC-neg group (Fig.5), controlling for all other pathologies and demographics. These results are in agreement with previous research focusing exclusively on the hippocampus and demonstrate greater atrophy with LATE-NC stages 2 or 3 than with moderate or severe AD-NC 18,30,31.Conclusion
This is the largest study combining brain morphometry and pathology in community-based older adults to date, and as such it provides strong evidence on the brain atrophy patterns associated with AD-NC and LATE-NC. Both AD-NC and LATE-NC are associated with lower volume mainly in the medial temporal lobes. When the two pathologies are comorbid, the brain tissue volume is lower and in more regions than when only one of the two pathologies is present. Furthermore, LATE-NC stages 2 or 3 are associated with more atrophy in the anterior portion of the hippocampus compared to moderate or severe AD-NC. This finding suggests that in the presence of LATE-NC, the volume of the hippocampus cannot serve as a marker of AD-NC.Acknowledgements
This study was supported by the following grants:
National Institute on Aging (NIA): R01AG064233, R01AG067482, R01AG017917, R01AG015819, RF1AG022018, R01AG056405, R01AG052200, P30AG010161, P30AG072975
National Institute of Neurological Disorders and Stroke (NINDS): UH2-UH3NS100599, UF1NS100599
References
1. Hyman BT, Phelps CH, Beach TG, et al. National Institute on Aging-Alzheimer's Association guidelines for the neuropathologic assessment of Alzheimer's disease. Alzheimers Dement. 2012;8(1):1-13. doi:10.1016/j.jalz.2011.10.007
2. Nelson PT, Dickson DW, Trojanowski JQ, et al. Limbic-predominant age-related TDP-43 encephalopathy (LATE): consensus working group report [published correction appears in Brain. 2019 Jul 1;142(7):e37]. Brain. 2019;142(6):1503-1527. doi:10.1093/brain/awz099
3. Boyle PA, Yang J, Yu L, et al. Varied effects of age-related neuropathologies on the trajectory of late life cognitive decline. Brain. 2017;140(3):804-812. doi:10.1093/brain/aww341
4. James BD, Wilson RS, Boyle PA, Trojanowski JQ, Bennett DA, Schneider JA. TDP-43 stage, mixed pathologies, and clinical Alzheimer's-type dementia. Brain. 2016;139(11):2983-2993. doi:10.1093/brain/aww224
5. Robinson JL, Lee EB, Xie SX, et al. Neurodegenerative disease concomitant proteinopathies are prevalent, age-related and APOE4-associated. Brain. 2018;141(7):2181-2193. doi:10.1093/brain/awy146
6. Fleischman DA, Arfanakis K, Leurgans SE, et al. Associations of deformation-based brain morphometry with cognitive level and decline within older Blacks without dementia. Neurobiol Aging. 2022;111:35-43. doi:10.1016/j.neurobiolaging.2021.11.003
7. Ashburner J, Hutton C, Frackowiak R, et al. Identifying global anatomical differences: deformation-based morphometry. Hum Brain Mapp. 1998;6(5-6):348-357. doi:10.1002/(SICI)1097-0193(1998)6:5/6<348::AID-HBM4>3.0.CO;2-P
8. Gaser C, Nenadic I, Buchsbaum BR, et al. Deformation-based morphometry and its relation to conventional volumetry of brain lateral ventricles in MRI. Neuroimage. 2001;13(6 Pt 1):1140-1145. doi:10.1006/nimg.2001.0771
9. Hua X, Leow AD, Parikshak N, et al. Tensor-based morphometry as a neuroimaging biomarker for Alzheimer's disease: an MRI study of 676 AD, MCI, and normal subjects. Neuroimage. 2008;43(3):458-469. doi:10.1016/j.neuroimage.2008.07.013
10. Sarro L, Senjem ML, Lundt ES, et al. Amyloid-β deposition and regional grey matter atrophy rates in dementia with Lewy bodies. Brain. 2016;139(Pt 10):2740-2750. doi:10.1093/brain/aww193
11. Barnes LL, Shah RC, Aggarwal NT, et al. The Minority Aging Research Study: ongoing efforts to obtain brain donation in African Americans without dementia. Curr Alzheimer Res. 2012;9(6):734-745. doi:10.2174/156720512801322627
12. Bennett DA, Buchman AS, Boyle PA, et al. Religious Orders Study and Rush Memory and Aging Project. J Alzheimers Dis. 2018;64(s1):S161-S189. doi:10.3233/JAD-179939
13. Avants BB, Epstein CL, Grossman M, et al. Symmetric diffeomorphic image registration with cross-correlation: evaluating automated labeling of elderly and neurodegenerative brain. Med Image Anal. 2008;12(1):26-41. doi:10.1016/j.media.2007.06.004
14. Winkler AM, Webster MA, Vidaurre D, et al. Multi-level block permutation. Neuroimage. 2015;123:253-268. doi:10.1016/j.neuroimage.2015.05.092
15. Josephs KA. Dementia and the TAR DNA binding protein 43. Clin Pharmacol Ther. 2010;88(4):555-558. doi:10.1038/clpt.2010.112
16. Nelson PT, Abner EL, Schmitt FA, et al. Modeling the association between 43 different clinical and pathological variables and the severity of cognitive impairment in a large autopsy cohort of elderly persons. Brain Pathol. 2010;20(1):66-79. doi:10.1111/j.1750-3639.2008.00244.x
17. Wilson RS, Yu L, Trojanowski JQ, et al. TDP-43 pathology, cognitive decline, and dementia in old age. JAMA Neurol. 2013;70(11):1418-1424. doi:10.1001/jamaneurol.2013.3961
18. Dawe RJ, Bennett DA, Schneider JA, et al. Neuropathologic correlates of hippocampal atrophy in the elderly: a clinical, pathologic, postmortem MRI study. PLoS One. 2011;6(10):e26286. doi:10.1371/journal.pone.0026286
19. Bobinski M, de Leon MJ, Wegiel J, et al. The histological validation of post mortem magnetic resonance imaging-determined hippocampal volume in Alzheimer's disease. Neuroscience. 2000;95(3):721-725. doi:10.1016/s0306-4522(99)00476-5
20. Gosche KM, Mortimer JA, Smith CD, et al. Hippocampal volume as an index of Alzheimer neuropathology: findings from the Nun Study. Neurology. 2002;58(10):1476-1482. doi:10.1212/wnl.58.10.1476
21. Huesgen CT, Burger PC, Crain BJ, et al. In vitro MR microscopy of the hippocampus in Alzheimer's disease. Neurology. 1993;43(1):145-152. doi:10.1212/wnl.43.1_part_1.145
22. Barkhof F, Polvikoski TM, van Straaten EC, et al. The significance of medial temporal lobe atrophy: a postmortem MRI study in the very old. Neurology. 2007;69(15):1521-1527. doi:10.1212/01.wnl.0000277459.83543.99
23. Mortimer JA, Gosche KM, Riley KP, et al. Delayed recall, hippocampal volume and Alzheimer neuropathology: findings from the Nun Study. Neurology. 2004;62(3):428-432. doi:10.1212/01.wnl.0000106463.66966.65
24. Josephs KA, Whitwell JL, Weigand SD, et al. TDP-43 is a key player in the clinical features associated with Alzheimer's disease. Acta Neuropathol. 2014;127(6):811-824. doi:10.1007/s00401-014-1269-z
25. Josephs KA, Murray ME, Whitwell JL, et al. Staging TDP-43 pathology in Alzheimer's disease. Acta Neuropathol. 2014;127(3):441-450. doi:10.1007/s00401-013-1211-9
26. Josephs KA, Whitwell JL, Tosakulwong N, et al. TAR DNA-binding protein 43 and pathological subtype of Alzheimer's disease impact clinical features. Ann Neurol. 2015;78(5):697-709. doi:10.1002/ana.24493
27. Kapasi A, Yu L, Boyle PA, et al. Limbic-predominant age-related TDP-43 encephalopathy, ADNC pathology, and cognitive decline in aging. Neurology. 2020;95(14):e1951-e1962. doi:10.1212/WNL.0000000000010454
28. Josephs KA, Murray ME, Whitwell JL, et al. Updated TDP-43 in Alzheimer's disease staging scheme. Acta Neuropathol. 2016;131(4):571-585. doi:10.1007/s00401-016-1537-1
29. Hu WT, Josephs KA, Knopman DS, et al. Temporal lobar predominance of TDP-43 neuronal cytoplasmic inclusions in Alzheimer disease. Acta Neuropathol. 2008;116(2):215-220. doi:10.1007/s00401-008-0400-4
30. Yu L, Boyle PA, Dawe RJ, et al. Contribution of TDP and hippocampal sclerosis to hippocampal volume loss in older-old persons. Neurology. 2020;94(2):e142-e152. doi:10.1212/WNL.0000000000008679
31. Teipel S, Grothe MJ; Alzheimer's Disease Neuroimaging Initiative. MRI-based basal forebrain atrophy and volumetric signatures associated with limbic TDP-43 compared to Alzheimer's disease pathology. Neurobiol Dis. 2023;180:106070. doi:10.1016/j.nbd.2023.106070
Figures