0663
Deformation-based morphometry reveals lower brain tissue volume in autopsy confirmed limbic age-related TDP-43 encephalopathy (LATE)1Department of Biomedical Engineering, Illinois Institute of Technology, Chicago, IL, United States, 2Rush Alzheimer’s Disease Center, Rush University Medical Center, Chicago, IL, United States
Synopsis
Keywords: Other Neurodegeneration, Aging, LATE-NC, TDP-43, Neuropathology, Aging, Postmortem MRI
Motivation: The association of limbic-predominant age-related TDP-43 encephalopathy neuropathological change (LATE-NC) with brain morphometry has not been thoroughly investigated.
Goal(s): To investigate gray and white matter morphometric abnormalities in LATE-NC in a large number of community-based older adults.
Approach: This study combined deformation-based morphometry (DBM) in ex-vivo brain MRI and detailed neuropathological data on the same community-based older adults (N=897), and investigated the association of LATE-NC with brain morphometric characteristics using voxel-wise linear regression models.
Results: LATE-NC was associated with lower volume in gray and white matter areas of temporal and frontal lobes and basal ganglia, consistent with the known pathological distribution of LATE-NC.
Impact: The pattern of morphometric abnormality in LATE-NC that was generated in the present work may potentially be used in combination with other imaging and clinical information towards the development of a marker of this devastating neuropathology.
Introduction
Limbic-predominant age-related transactive response DNA binding protein 43 (TDP-43) encephalopathy neuropathological change (LATE-NC) is common in older adults and is associated with neurodegeneration, cognitive impairment and dementia1. Structural MRI studies of LATE-NC conducted so far have mostly focused on specific gray matter regions1–5. Deformation-based morphometry (DBM) is an image analysis technique that describes localized structural abnormalities at the voxel level from the non-linear deformation fields that align MRI scans to a common anatomical template6. In this work, we investigated the voxel-wise association of LATE-NC with brain morphometric anomalies by combining DBM on ex-vivo MRI with detailed neuropathology data in a large number of community-based older adults that came to autopsy (N=897). Furthermore, we investigated morphometric differences across LATE-NC stages and identified the earliest stage of the pathology exhibiting significant morphometric anomalies.Methods
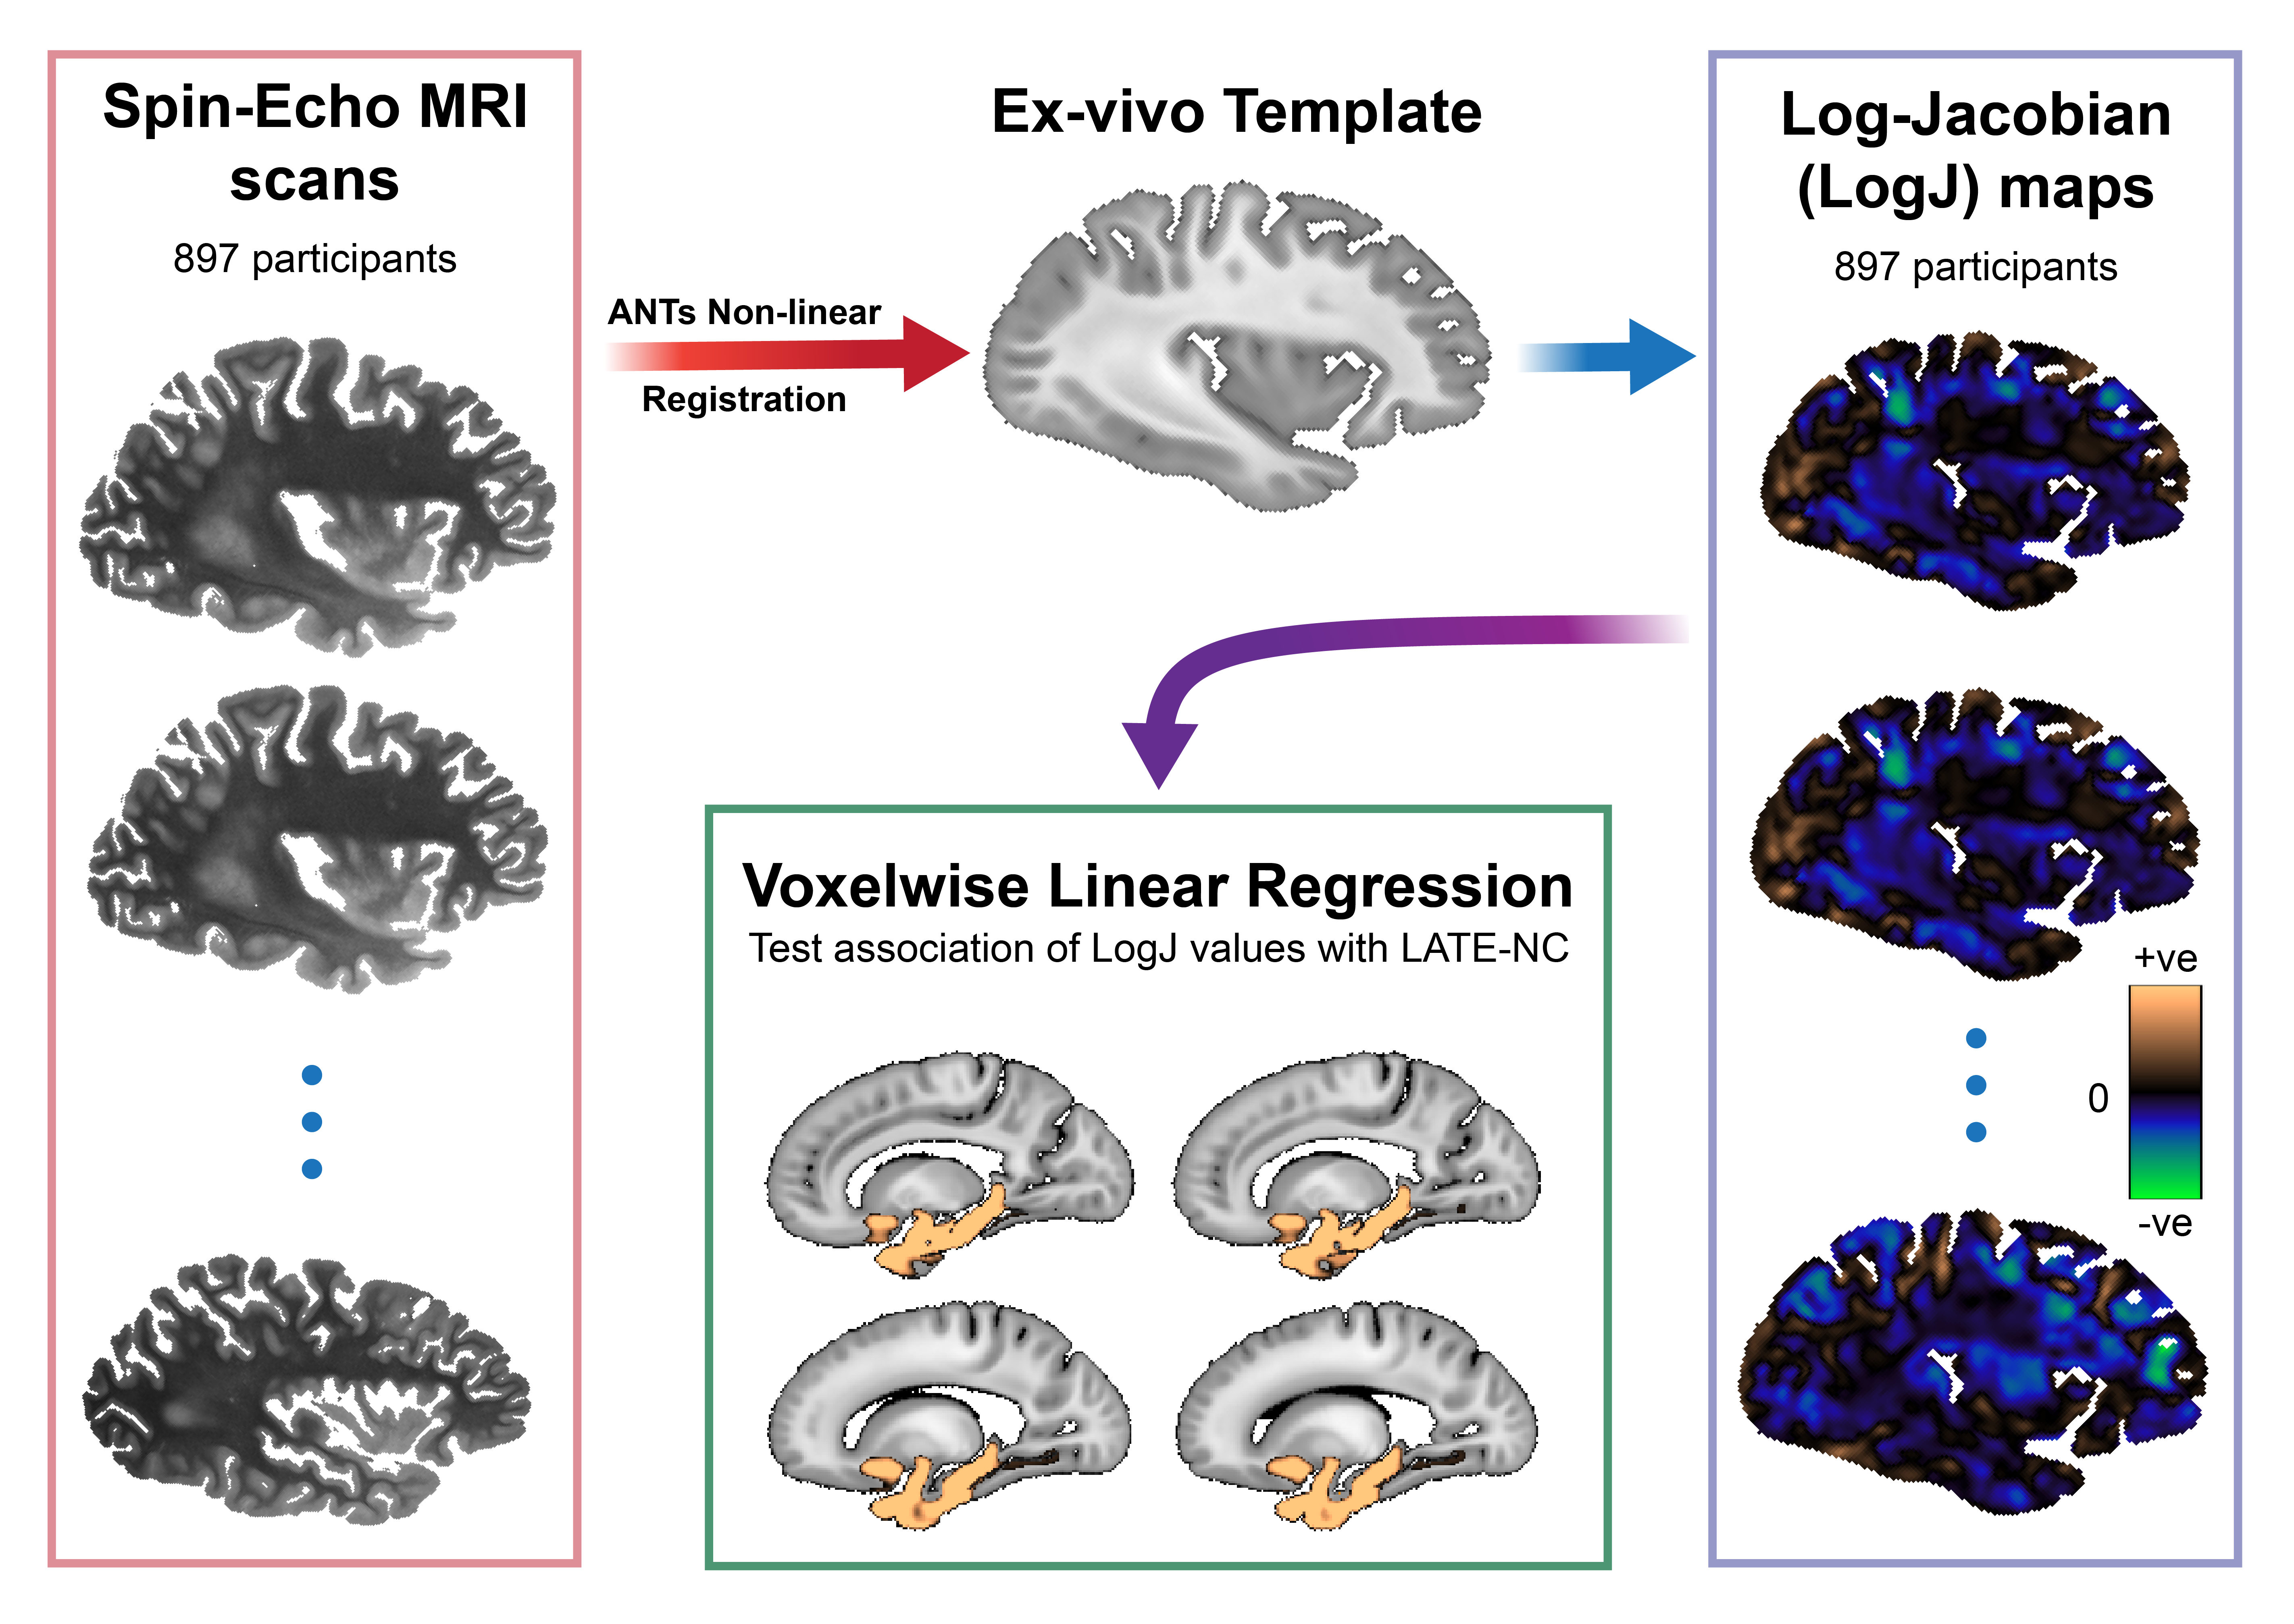
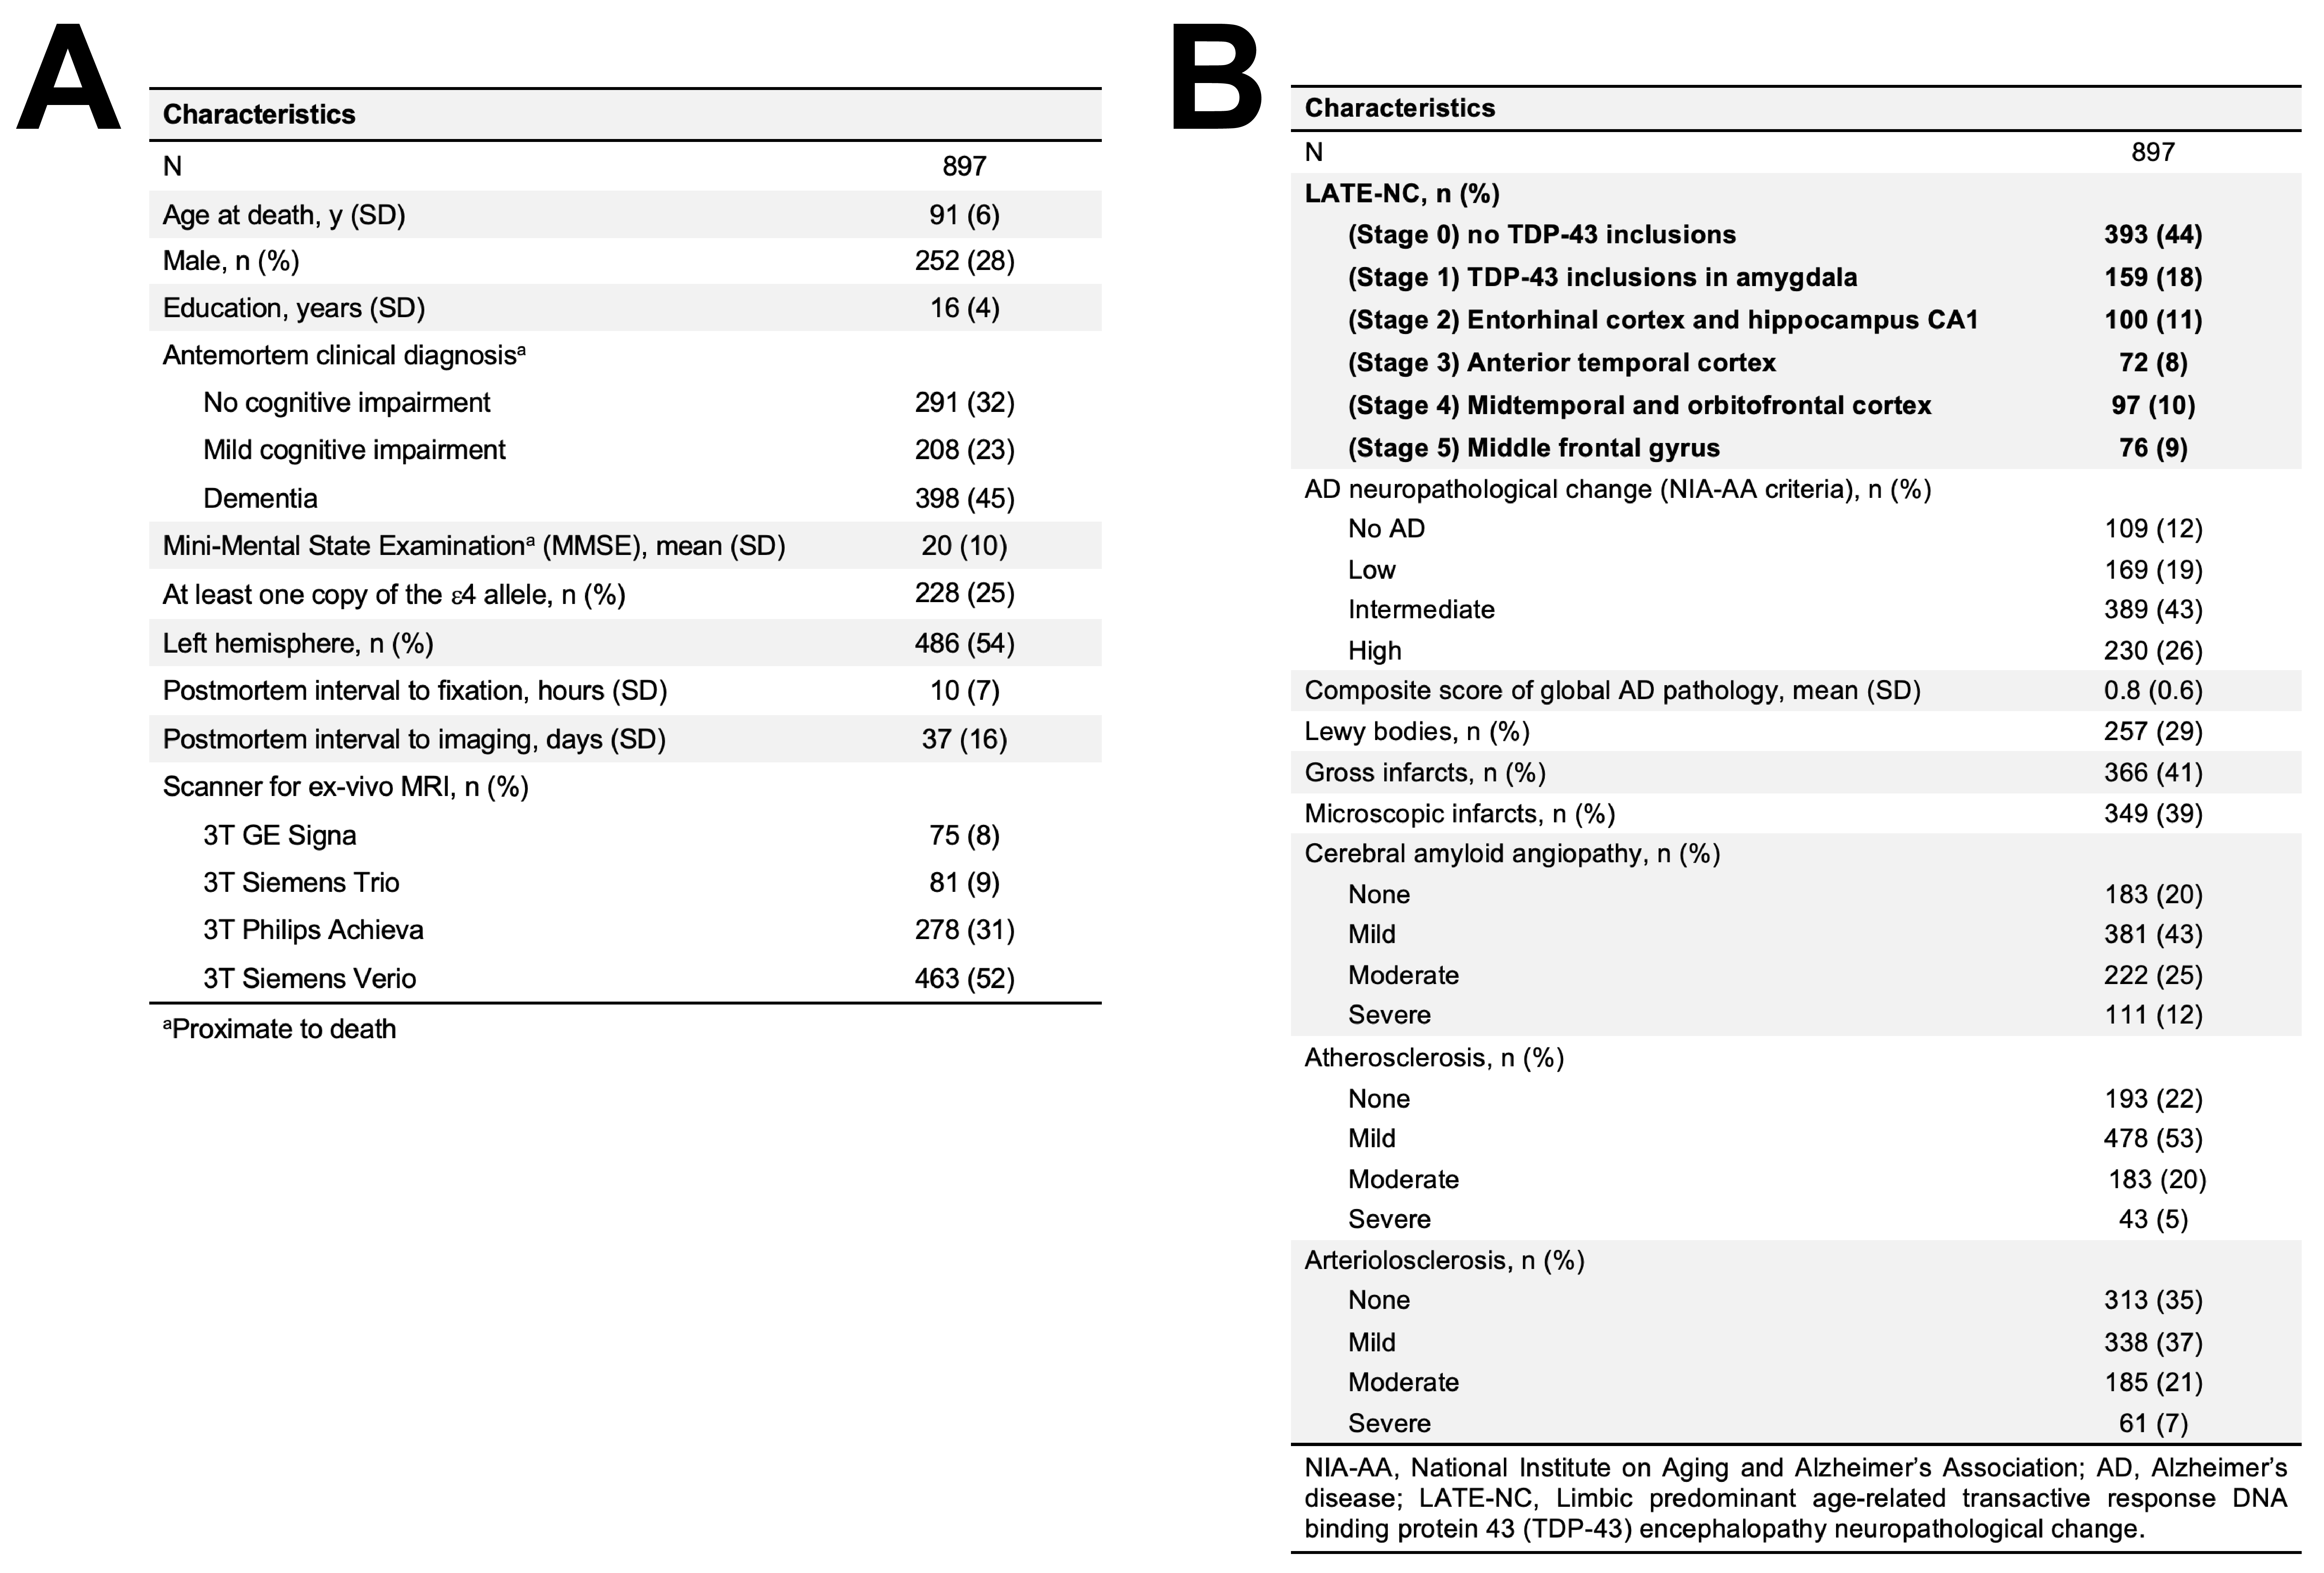
Participants, MRI, neuropathologyCerebral hemispheres were acquired from 897 deceased older adults participating in four epidemiological cohort studies of aging: Rush Memory and Aging Project, Religious Orders Study7, Minority Aging Research Study, and Rush Alzheimer’s Disease Center African American Clinical Core8. Hemispheres were imaged ex-vivo on 3T clinical MRI scanners within approximately 1-month postmortem while immersed in 4% formaldehyde solution, using a 2D spin-echo sequence (Fig.1) with multiple echo times ranging from 10–50ms and 0.6×0.6×1.5mm3 voxel size (Fig.2A). The images from the first echo were non-linearly registered to an ex-vivo brain hemisphere template using ANTs9 (Fig.1). The logarithm of the Jacobian determinant (LogJ) of the deformation fields was calculated in each voxel, and the resulting LogJ maps were smoothed by a 4mm FWHM Gaussian filter6. Following ex-vivo MRI, hemispheres underwent detailed neuropathologic examination by a board-certified neuropathologist (Fig.2B).
Statistical analyses
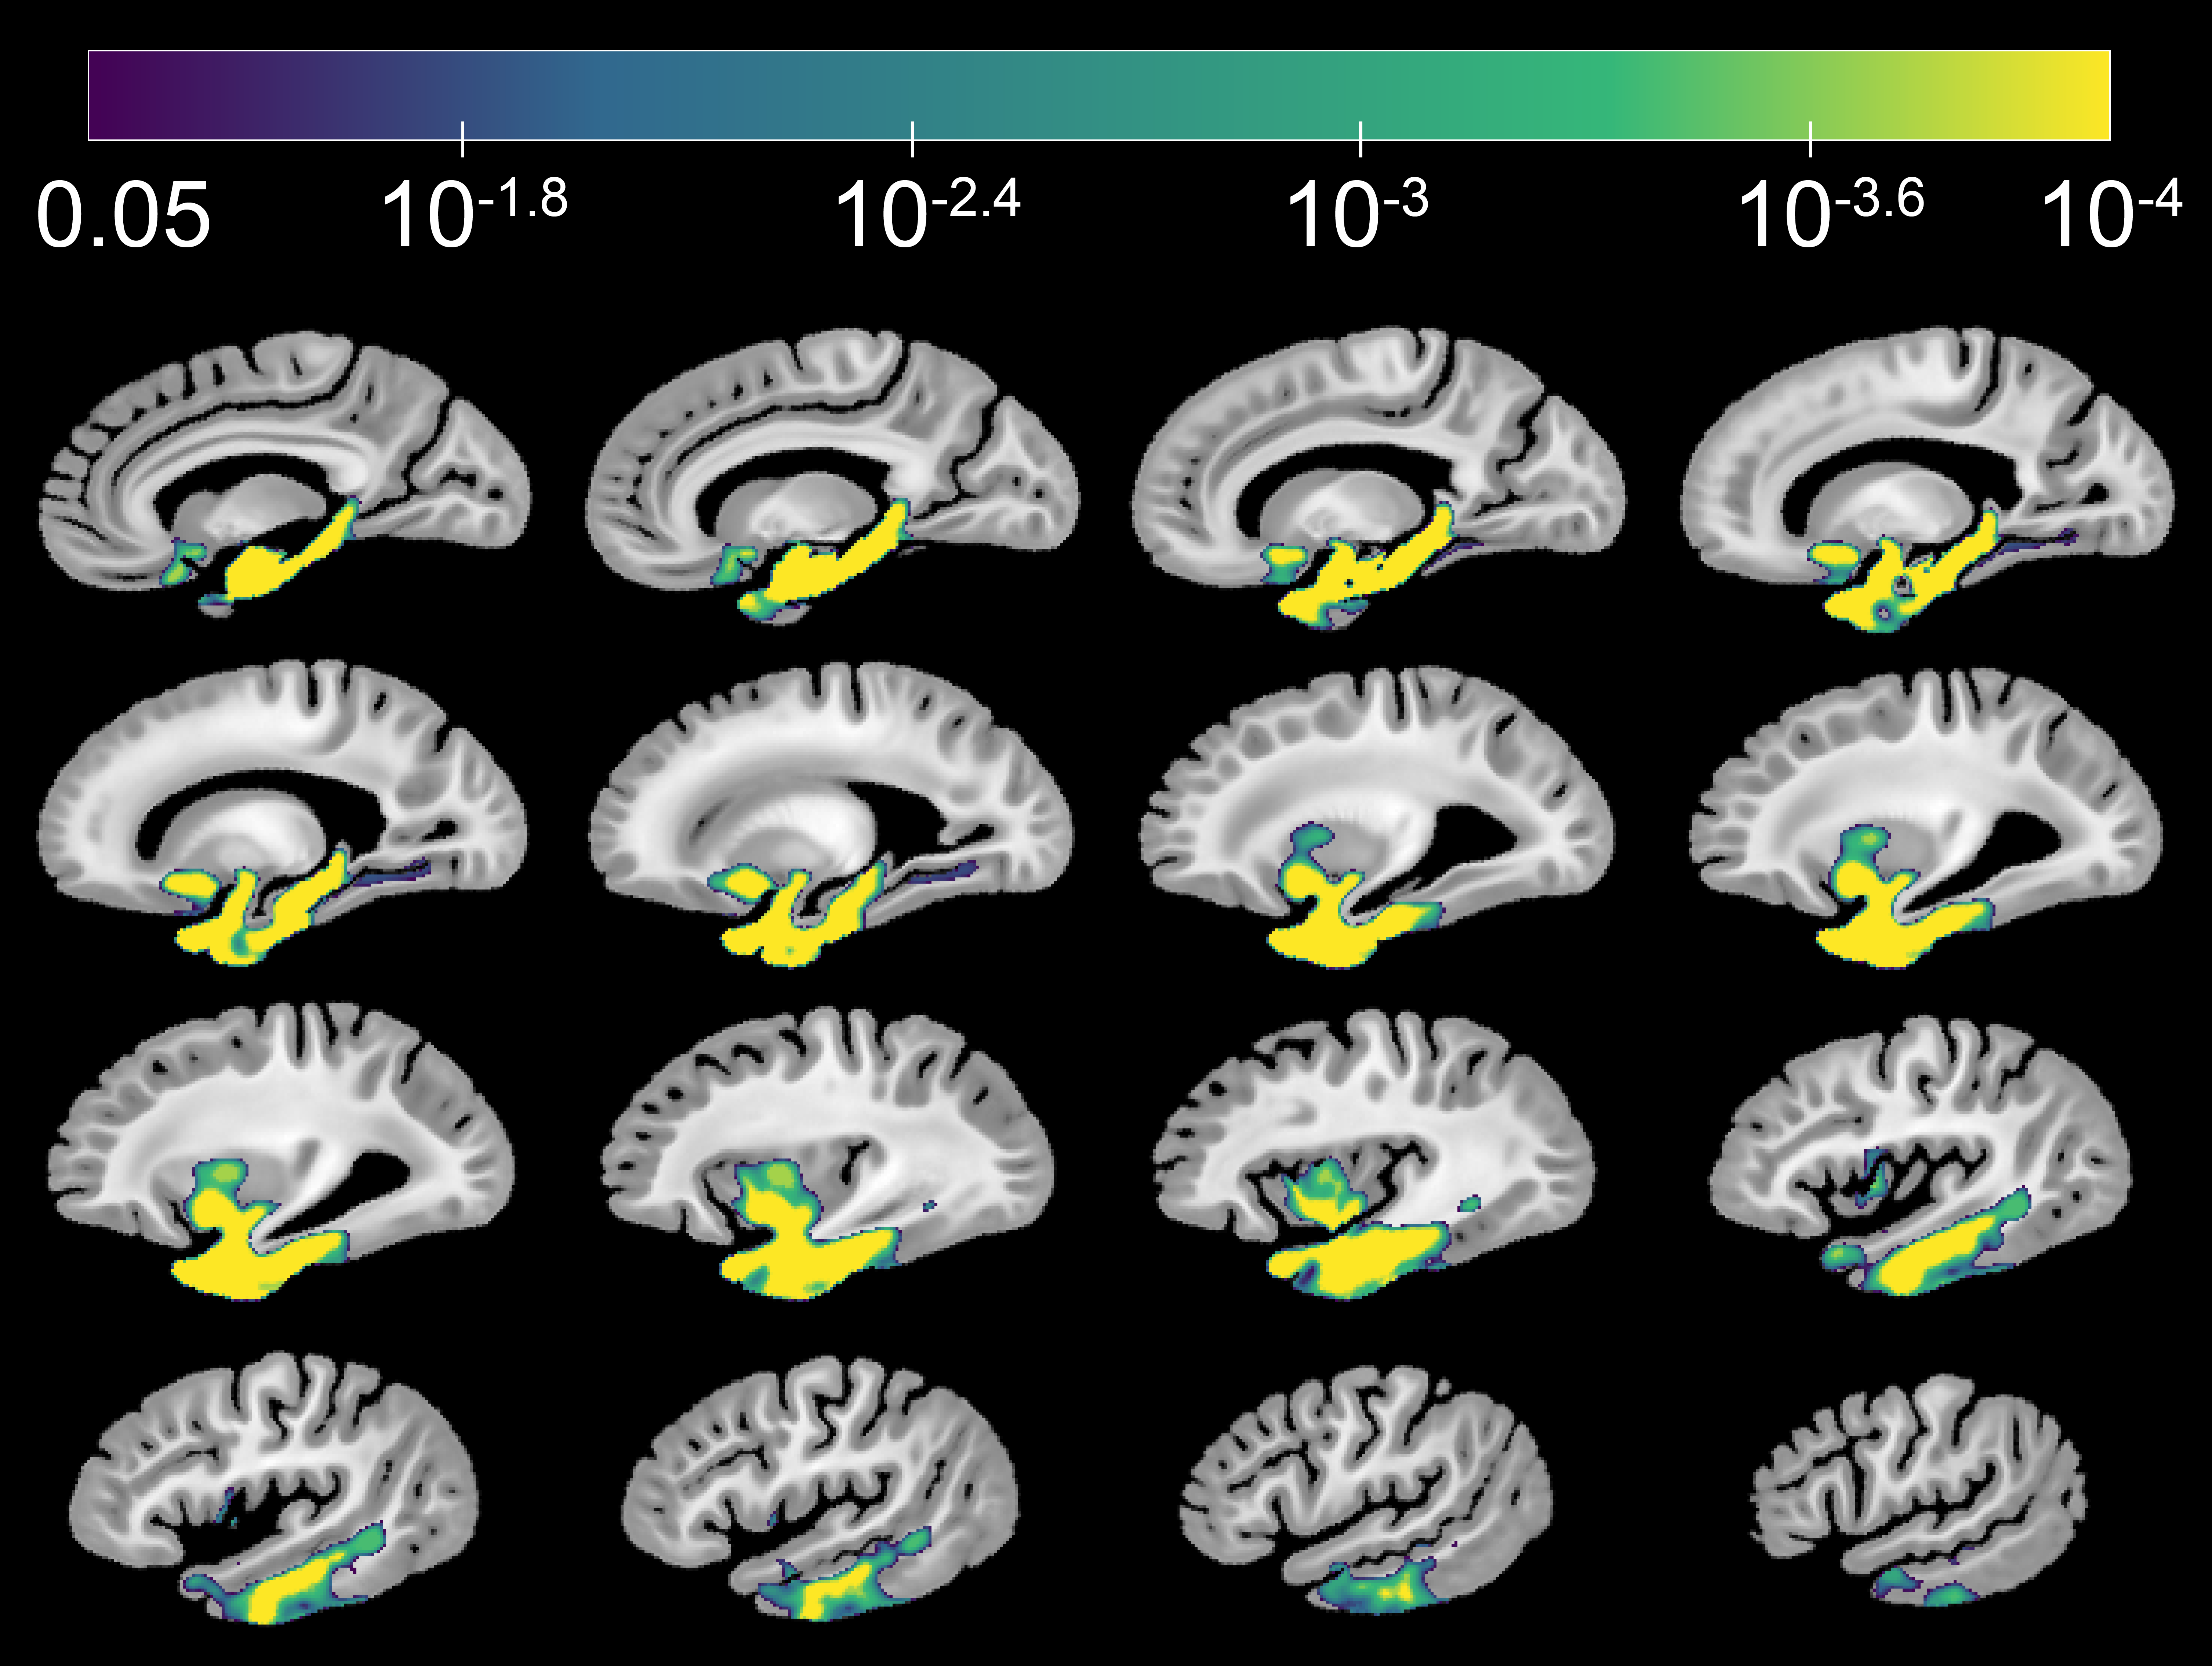
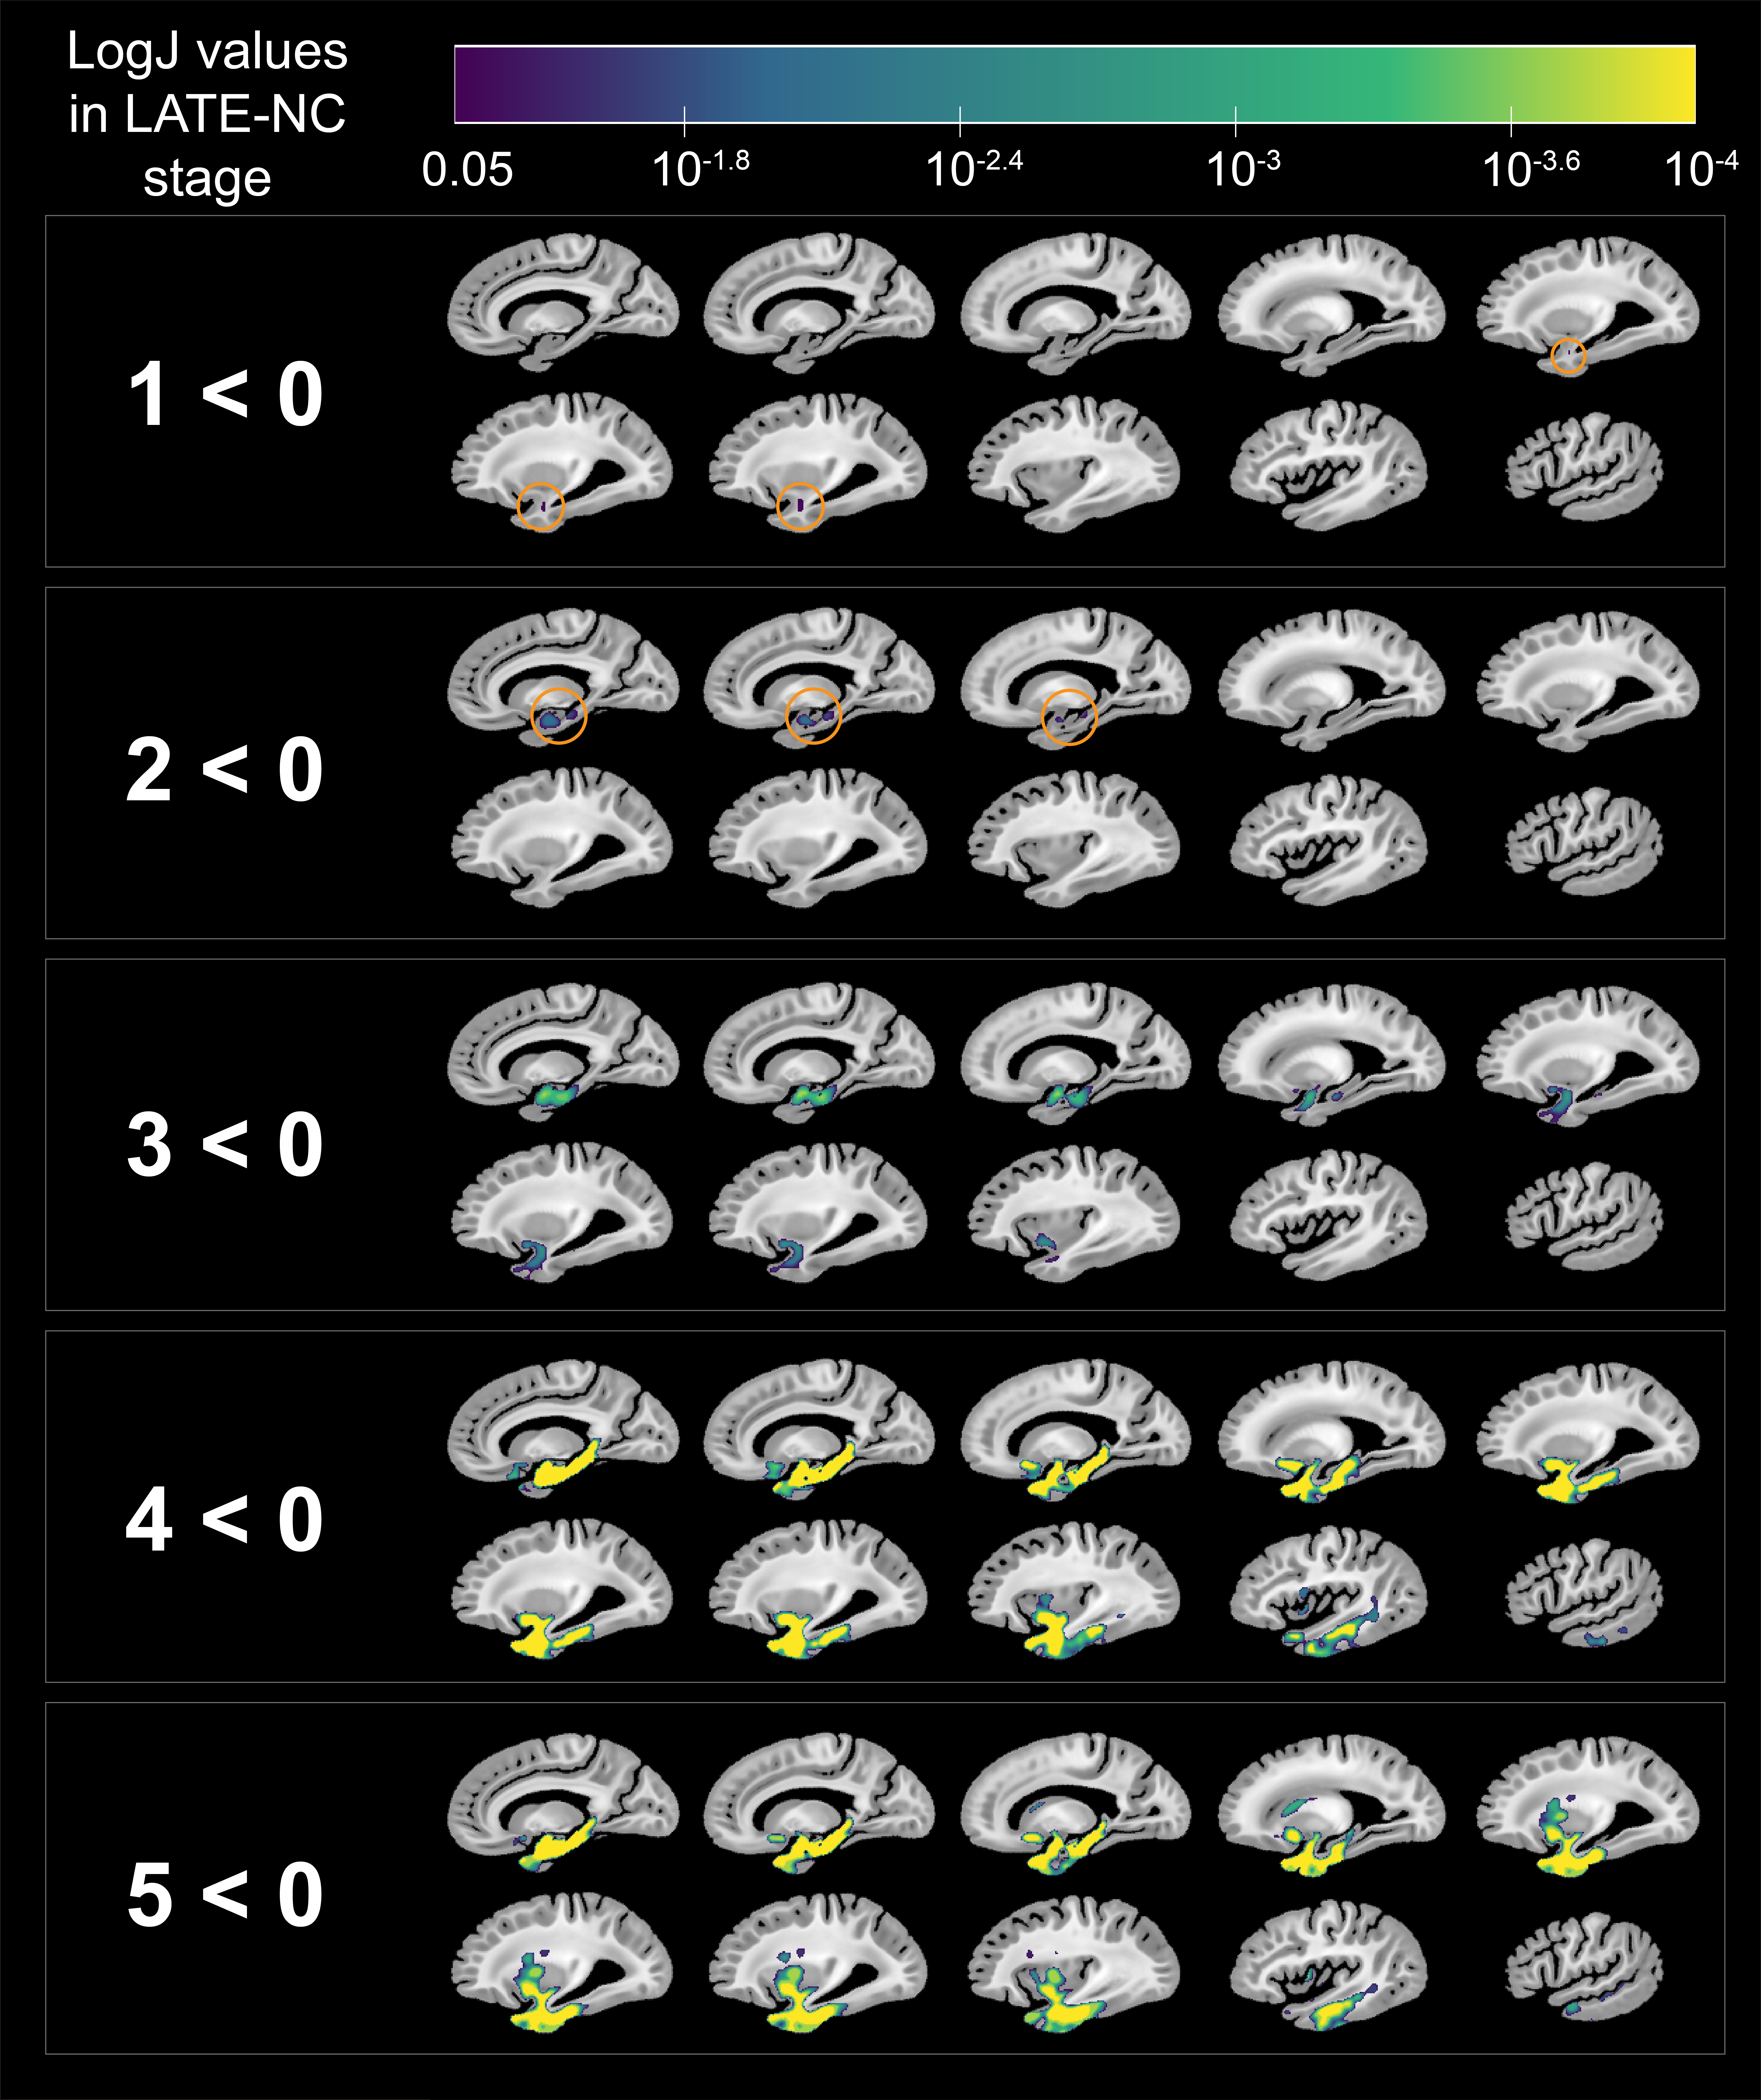
Voxel-wise linear regression was used to test the association between deformations shown in the LogJ maps and LATE-NC stages, controlling for other age-related neuropathologies (Alzheimer’s disease, Lewy bodies, arteriolosclerosis, atherosclerosis, cerebral amyloid angiopathy, gross and microscopic infarcts), demographics (age at death, sex, education), postmortem intervals, and scanners. Statistical tests were performed using FSL’s PALM tool with 10,000 permutations and threshold-free cluster enhancement10. To identify the earliest LATE-NC stage exhibiting morphometric abnormalities, LogJ values were compared between LATE-NC stages 1–5 and stage 0, using voxel-wise linear regression and controlling for the same variables as described above. Statistical significance was set at p<0.05 after family-wise error rate (FWER) adjustment to correct for multiple comparisons.
Results
Voxel-wise linear regression revealed an independent association of LATE-NC with significantly lower volume in both gray and white matter regions within the temporal and frontal lobes and basal ganglia (p<0.05) (Fig.3). Significantly lower volume was observed in amygdala, hippocampus, entorhinal, parahippocampal, temporal pole, inferior temporal, middle temporal, fusiform, medial orbitofrontal, lateral orbitofrontal, insula, accumbens, and putamen cortices (Fig.3). Groupwise comparison of LogJ values revealed significant morphometric anomalies in LATE-NC stages 1–5 compared to stage 0 (p<0.05) (Fig.4). The spatial pattern included small temporal lobe areas in stages 1–2, more temporal lobe tissue as well as basal ganglia tissue in stage 3, and finally also included frontal lobe areas in stages 4–5 (Fig.4).Discussion
The present study investigated the voxel-wise association of LATE-NC with brain morphometric anomalies by combining DBM on ex-vivo MRI with detailed neuropathology data in a large number of community-based older adults. Our results revealed an independent association of LATE-NC with lower tissue volume in a spatial pattern that is consistent with the known distribution of LATE-NC1,11–13. A comparison across stages revealed significant lower tissue volume as early as LATE-NC stage 1, suggesting that MRI is sensitive to the early stages of the disease.Conclusion
The present study in autopsied brains from a large number of community-based older adults showed an independent association of LATE-NC with lower volume in gray and white matter areas of the temporal and frontal lobes and basal ganglia. This pattern is consistent with the known distribution of LATE-NC in the brain and may potentially be used in combination with other imaging and clinical information towards the development of a marker of this devastating neuropathology. Finally, morphometric anomalies were detected as early as LATE-NC stage 1, suggesting that MRI is sensitive to the early stages of the disease.Acknowledgements
This study was supported by the following grants:
National Institute on Aging (NIA): R01AG064233, R01AG067482, R01AG017917, R01AG015819, P30AG010161, P30AG072975.
National Institute of Neurological Disorders and Stroke (NINDS): UF1NS100599.
References
1. Nelson PT, Dickson DW, Trojanowski JQ, et al. Limbic-predominant age-related TDP-43 encephalopathy (LATE): consensus working group report. Brain. 2019;142(6):1503-1527.2. Dawe RJ, Bennett DA, Schneider JA, Arfanakis K. Neuropathologic correlates of hippocampal atrophy in the elderly: A clinical, pathologic, postmortem MRI study. PLoS ONE. 2011;6(10).
3. Bejanin A, Murray ME, Martin P, et al. Antemortem volume loss mirrors TDP-43 staging in older adults with non-frontotemporal lobar degeneration. Brain. 2019;142(11):3621-3635.
4. Buciuc M, Martin PR, Tosakulwong N, et al. TDP-43-associated atrophy in brains with and without frontotemporal lobar degeneration. NeuroImage Clin. 2022;34:102954.
5. Makkinejad N, Schneider JA, Yu J, et al. Associations of amygdala volume and shape with transactive response DNA-binding protein 43 (TDP-43) pathology in a community cohort of older adults. Neurobiol Aging. 2019;77:104-111.
6. Chung MK, Worsley KJ, Paus T, et al. A Unified Statistical Approach to Deformation-Based Morphometry. NeuroImage. 2001;14(3):595-606.
7. Bennett DA, Buchman AS, Boyle PA, Barnes LL, Wilson RS, Schneider JA. Religious Orders Study and Rush Memory and Aging Project. Perry G, Avila J, Moreira PI, Sorensen AA, Tabaton M, eds. J Alzheimers Dis. 2018;64(s1):S161-S189.
8. L. Barnes L, C. Shah R, T. Aggarwal N, A. Bennett D, A. Schneider J. The Minority Aging Research Study: Ongoing Efforts to Obtain Brain Donation in African Americans without Dementia. Curr Alzheimer Res. 2012;9(6):734-745.
9. Avants BB, Tustison NJ, Song G, Cook PA, Klein A, Gee JC. A reproducible evaluation of ANTs similarity metric performance in brain image registration. NeuroImage. 2011;54(3):2033-2044.
10. Winkler AM, Ridgway GR, Webster MA, Smith SM, Nichols TE. Permutation inference for the general linear model. NeuroImage. 2014;92:381-397.
11. Nelson PT, Lee EB, Cykowski MD, et al. LATE-NC staging in routine neuropathologic diagnosis: an update. Acta Neuropathol (Berl). 2023;145(2):159-173.
12. Josephs KA, Murray ME, Whitwell JL, et al. Updated TDP-43 in Alzheimer’s disease staging scheme. Acta Neuropathol (Berl). 2016;131(4):571-585.
13. Nag S, Yu L, Boyle PA, Leurgans SE, Bennett DA, Schneider JA. TDP-43 pathology in anterior temporal pole cortex in aging and Alzheimer’s disease. Acta Neuropathol Commun. 2018;6(1):33.
Figures