0662
Longitudinal MRA Tortuosity Metric Measurements in a Population-based Study1Department of Radiology, Johns Hopkins Hospital, Baltimore, MD, United States, 2Joint Department of Biomedical Engineering, University of North Carolina & North Carolina State University, Chapel Hill, NC, United States, 3Johns Hopkins Hospital, Baltimore, MD, United States
Synopsis
Keywords: Dementia, Blood vessels, MRA
Motivation: Current understanding of dolichoectasia has largely been drawn from patients with clinical need for brain imaging in the cross-sectional settings.
Goal(s): To characterize the longitudinal changes in brain MRA geometry vessel metrics and their associations with demographic variables, imaging biomarkers and cognitive performance.
Approach: Basic demographic and clinical information were compared between two groups w/wo MRI metric measurement change using two-sample t-tests. The associations between MRI metrics and cognitive decline or incidence dementia were tested using logistic regression.
Results: MRA geometry vessel metric change was not associated with the cognitive decline over time (3.6-8 years). Baseline cognitive score can predict future cognitive performance.
Impact: Clinical predictors of worsening dolichoectasia are unknown. Although MRA geometry vessel metric changes are not significant with cognitive decline, demographic variables show significance on some metric difference. Baseline cognitive score can also predict cognitive change.
Introduction
Non-atherosclerotic intracranial arterial remodeling is an age-related arteriopathy, defined by an increase in tortuosity or diameter of at least one intracranial artery1,2. Larger brain arterial diameters and tortuosity – the extreme phenotype of which is known as dolichoectasia -has been associated with stroke3 and cognitive decline4. Our current understanding of dolichoectasia has largely been drawn from patients with clinical need for brain imaging in the cross-sectional settings. The progression of dolichoectasia has been described in a single, small study5, but clinical predictors of worsening dolichoectasia are unknown. We aim to characterize the longitudinal changes in brain MRA geometry vessel metrics and their associations with demographic variables, imaging biomarkers and cognitive performance.Methods
We included 706 participants who underwent both brain MRI exams at visit 5 and visit 6/7 (mean time interval 5.5 years) in the Atherosclerosis Risk in Communities (ARIC) study. Intracranial arterial size (area and diameter) and tortuosity (angle metric AM, distance metric DM, and distance-to-axis metric DTA) were measured at the standard location for eight vessel segments on brain TOF MRA (acquired resolution, 0.50×0.50 mm2; slice thickness 0.55 mm) using non-uniform rational b-splines (NURBS) surface modeling software (LAVA, Leiden University, the Netherlands), as shown in Figure 1 and vessel tortuosity was calculated using in-house scripts programmed in MATLAB6. The changes in MRI metrics measurement over time for each vessel segment were assessed. These segmental changes were then averaged to obtain a global change value for each participant. A 10th percentile was used as the cut point for each MRI metric measurement, and basic demographic and clinical information were compared between two groups using two-sample t-tests. The associations between MRI metrics and cognitive decline (measured as change of the cognitive factor scores) and incidence dementia were tested using logistic regression. The model performance was compared across different cognitive decline thresholds and accounted for non-neurovascular factors as covariates in our analyses.Results
We excluded 7 participants who had dementia at visit 5. A total of 697 participants (age 67-89 years; 397 women; 183 black) had complete MRI metrics (size and tortuosity) measurements. After a mean follow up of 5.5 years, 29 participants developed dementia. On average, women showed the bigger changes in vessel size (area and diameter) and tortuosity during follow-up compared with men (p<0.001). Whites demonstrated bigger change in size but small change in DM-calculated total tortuosity than Blacks (p<0.01) as illustrated in Figure 2. However, the changes in these MRI metrics did not associate with cognitive decline, whether assessed through cognitive score reductions or clinical diagnosis deteriorations (i.e., incident dementia), as shown in Figure 3. In terms of predictive modelling, changes in vessel area and DM-calculated tortuosity were not effective discriminators on their own. The model's performance did improve when demographic covariates were included. However, incorporating strong cross-sectional biomarkers, such as changes in the white matter volume ratio and Apoe genotype, did not markedly enhance the model's longitudinal predictive capability. Conversely, including baseline cognitive scores from visit 5 yielded a positive influence on the predictive results. Additionally, the selection threshold's proximity to -0.7 improved model performance, but to avoid an imbalanced training dataset, -0.52 was chosen as a neutral threshold. (As depicted in Figure 4, Basic measurement model 1: AUC = 0.48, model 1 + demographic covariates: AUC = 0.60, model 2 + cross-sectional strong biomarker: AUC = 0.62, model 3 + visit 5 cognitive score baseline: AUC = 0.74).Discussion
The longitudinal change in vessel measurements was not found to be significantly associated with cognitive decline. In the predictive models, vessel measurement changes alone did not yield effective performance. However, cross-sectional baseline cognitive scores appeared to be the most substantial contributor to prediction accuracy. As illustrated in Figure 5, this may be attributable to a floor effect of the variable: individuals with lower baseline cognitive scores were more prone to experience cognitive decline. This trend suggests that initial cognitive performance is a strong indicator of future decline. Additionally, the average cognitive score in the group with a clinical diagnosis of cognitive deterioration was -0.86, maybe aligning closely with clinical threshold values. This alignment may elucidate why the AUC for the prediction models improved when the threshold was set closer to -0.7, potentially due to its relevance in a clinical context.Conclusion
MRA geometry vessel metric change was not associated with the cognitive decline over time (3.6-8 years). Baseline cognitive score can predict future cognitive performance.Acknowledgements
No acknowledgement found.References
1. Gutierrez J, Bagci A, Gardener H, Rundek T, Ekind MS, Alperin N, Sacco RL, Wright CB. Dolichoectasia Diagnostic Methods in a Multi-Ethnic, Stroke-Free Cohort: Results from the Northern Manhattan Study. J Neuroimaging. 2013
2. Duca L, Blaise S, Romier B, Laffargue M, Gayral S, El Btaouri H, Kawecki C, Guillot A, Martiny L, Debelle L, Maurice P. Matrix ageing and vascular impacts: focus on elastin fragmentation. Cardiovasc Res. 2016; 110: 298-308.
3. Eduardo Barbará-Morales, Jorge Pérez-González, Karla C. Rojas-Saavedra, Verónica Medina-Bañuelos, "Evaluation of Brain Tortuosity Measurement for the Automatic Multimodal Classification of Subjects with Alzheimer’s Disease", Computational Intelligence and Neuroscience, vol. 2020, Article ID 4041832, 11 pages, 2020. https://doi.org/10.1155/2020/4041832
4. Gutierrez J, Kulick E, Park Moon Y, Dong C, Cheung K, Ahmet B, Stern Y, Alperin N, Rundek T, Sacco RL, Wright CB, Elkind MSV. Brain Arterial Diameters and Cognitive Performance: The Northern Manhattan Study. J Int Neuropsychol Soc. 2017; 1-12.
5. Han HC. Twisted blood vessels: symptoms, etiology and biomechanical mechanisms. J Vasc Res. 2012; 49:
Figures
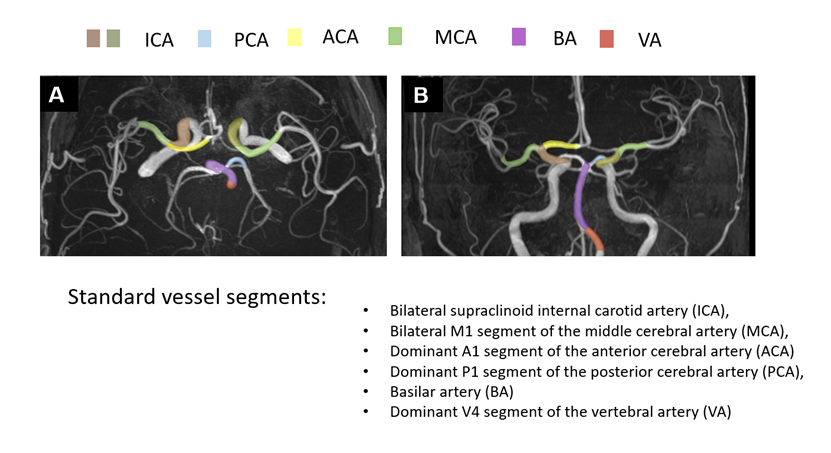
Figure 1: MRA standard vessel segments.
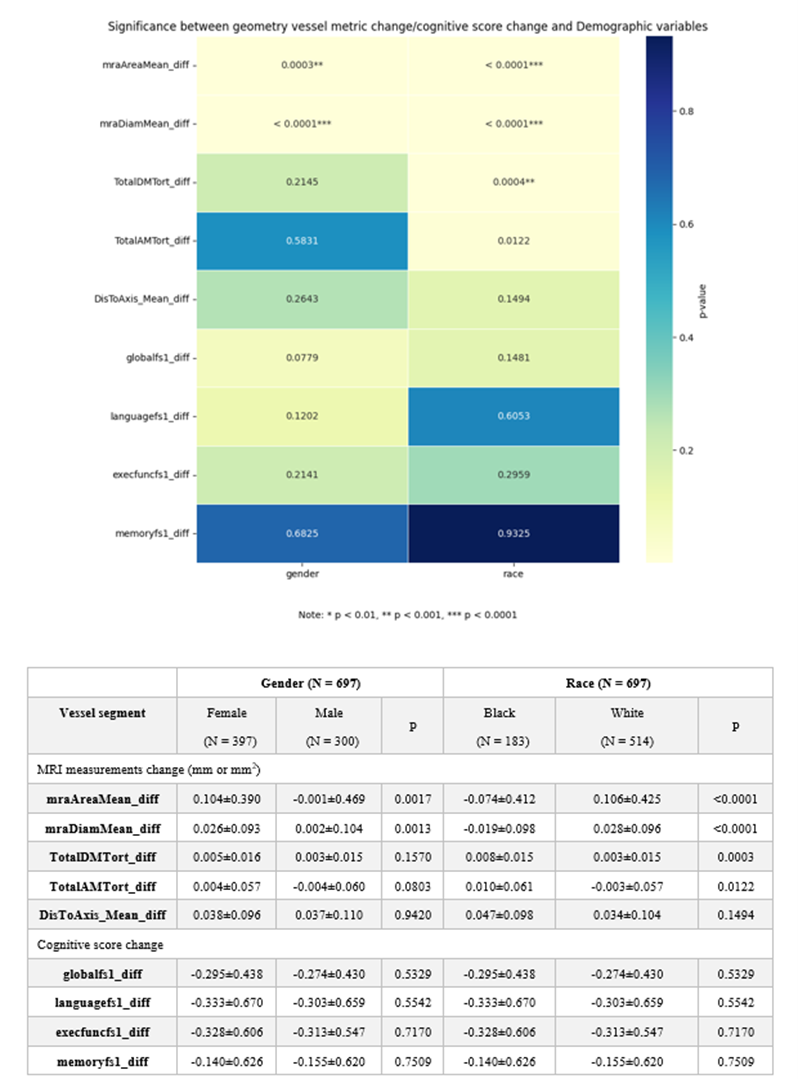
Figure 2: Significance between geometry vessel metric change/cognitive score change and Demographic variable. All MRI measurements change, or cognitive score change is equal to v6/v7 value – v5 value.
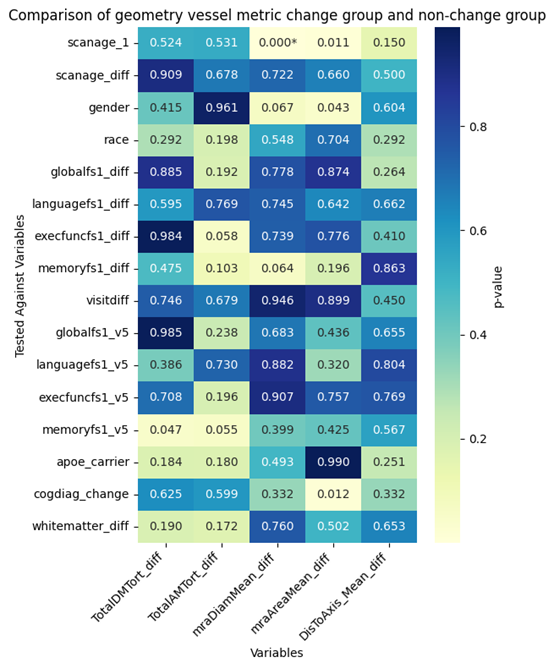
Figure 3: Comparison of geometry vessel metric change group and non-change group. For all geometry vessel metric change, data was categorized into two groups.
Group 1: 10th% ≤x <90th%; Group 2: ≥90th% & <10th%.
The second is seen as geometry change group and the other is non-change. For these two groups, do two sample t test for all other interested variables, especially focus on cognitive change variables. The heatmap shows the p value results.
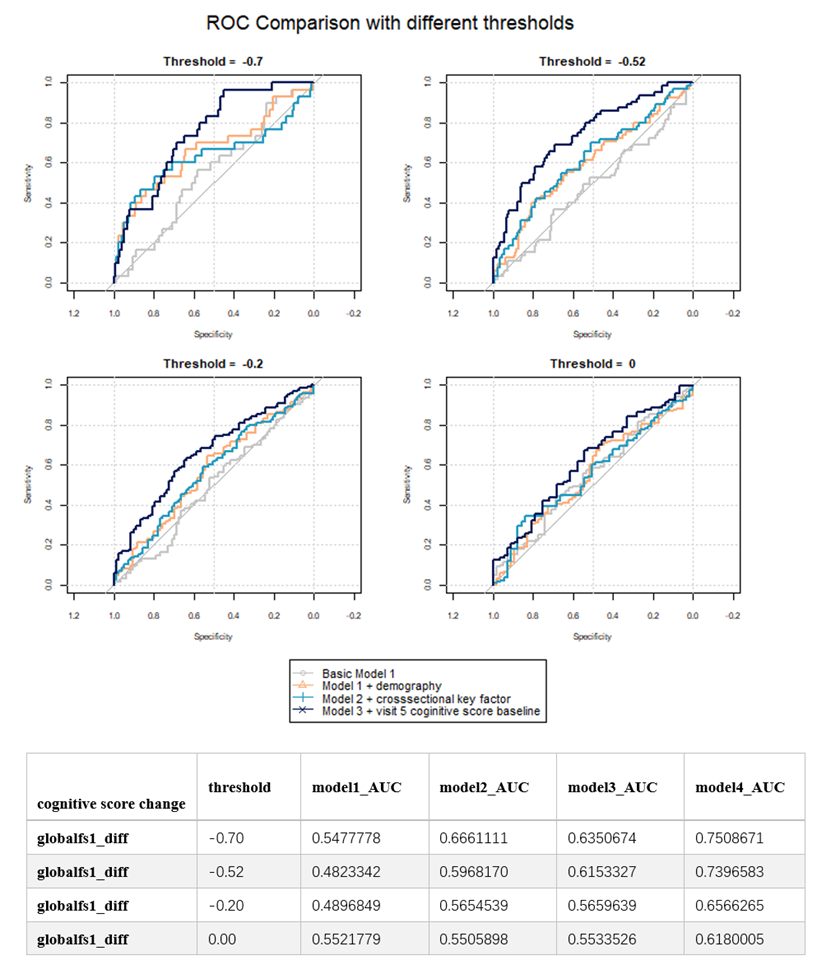
Figure 4: ROC/AUC Comparison between different models and threshold. Under threshold, cases will be tagged as positive, otherwise as negative.
Model1 Predictors: mraAreaMean_diff+TotalDMTort_diff
Model2 Predictors: mraAreaMean_diff+TotalDMTort_diff+gender+race+scanage_1
Model3 Predictors: mraAreaMean_diff+TotalDMTort_diff+gender+race+scanage_1+whitematter_diff+apoe_carrier
Model4 Predictors: mraAreaMean_diff+TotalDMTort_diff+gender+race+whitematter_diff+apoe_carrier+scanage_1+globalfs1_v5
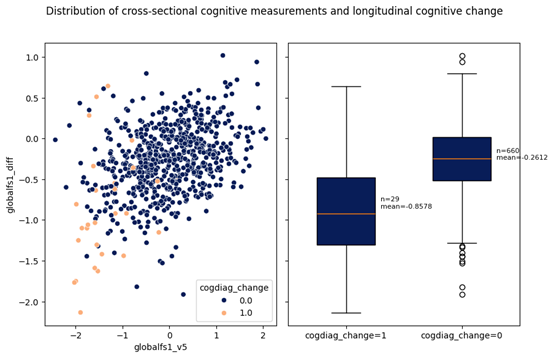
Figure 5: Distribution of cross-sectional cognitive measurements and longitudinal cognitive change. On the left globalfs1_v5 is the global cognitive score for v5 and globalfs1_diff is the difference between two visits. On the right is the boxplot of distribution for clinical diagnosis groups. If cogdiag_change = 1 means the patient was normal for visit 5 but had dementia in visit 6/7.