0661
In vivo mapping of sodium homeostasis disturbances in individual ALS patients: a brain 23Na MRI study1APHM, Hôpital de la Timone, Referral Centre for Neuromuscular Diseases and ALS, Marseille, France, 2Aix Marseille Univ, CNRS, CRMBM-CEMEREM, Marseille, France
Synopsis
Keywords: Other Neurodegeneration, Neurodegeneration, non-proton; sodium; ALS
Motivation: ALS is a neurodegenerative disease leading to progressive motor deficit and death within few years. There is an unmet need to identify non-invasive biomarkers at the individual level to predict disease progression.
Goal(s): To study disease severity at the individual level in ALS by mapping abnormal sodium homeostasis using brain 23Na-MRI.
Approach: 27 ALS patients were explored by brain 23Na-MRI. Individual map of abnormal total sodium concentration (TSC) was computed for each patient compared to a local database of 62 controls.
Results: This study mapping sodium homeostasis disturbances at the individual level in ALS patients evidenced association between TSC increase and disease severity.
Impact: This pilot study mapping sodium homeostasis disturbances at the individual level in ALS patients through 23Na-MRI evidenced association between TSC increase and disease severity and may be a future biomarker to help stratifying patients and evaluating new therapeutics.
Introduction
Amyotrophic lateral sclerosis (ALS) is a neurodegenerative disease that leads to progressive motor deficit and ultimately death within few years. The disease is characterized by upper and lower motor neuron degeneration. Disease progression is variable among patients [1]. While the median survival time ranges from 20 to 48 months, 10 to 20% of patients have a survival longer than 10 years.Several MRI techniques such as diffusion tensor imaging (DTI) or measure of cortical thickness reported widespread structural damage across motor but also non-motor brain regions in ALS patients [2–5].
Nevertheless, these studies provided comparison between groups of subjects but studies at the individual level are still needed to predict individual disease progression.
The present study aims at studying disease severity at the individual level in ALS patients by mapping abnormal sodium homeostasis with brain 23Na-MRI using a novel approach designed for individual patient.
Materials and methods
ParticipantsTwenty-eight ALS patients were recruited and clinically assessed to determine onset site, disease duration, ALSFRS-R (at the time of MRI and 6months later), ALSFRS-R slope (=48-ALSFRS-R]/disease duration in months).
MRI acquisition
MRI acquisition was performed on a 3T Verio system (Siemens) using a 32-channel phased-array 1H head coil (Siemens) and a 23Na-1H volume head coil (RapidBiomedical). The 23Na MRI protocol included a 3D density-adapted radial sequence (TR/TE = 120/0.2ms; 17000 projections with 369 samples per projection; 3.6mm isotropic voxel; acquisition time = 34 min). Two tubes (50mmol/L within 2% of agar gel) placed within the FOV served as a reference for quantification [6, 7]. The 1H MRI protocol included a 3D T1-weighted (T1w) MPRAGE sequence (TE/TR/TI = 3/2300/900ms, 160 slices, 1mm isotropic voxel, acquisition time = 6 min).
Image processing
Three-dimensional sodium images were reconstructed offline, denoised and normalized relative to signal from reference tubes to obtain quantitative TSC maps of the whole brain as detailed in a previous study [7]. The three-dimensional 23Na and 1H images were coregistered without resectioning. The 1H images (MPRAGE) were normalized into the Montreal Neurologic Institute template, and the resulting transformation was applied to the quantitative 23Na maps. Finally, the obtained normalized quantitative TSC maps were smoothed by using an 8-mm full width at half maximum Gaussian kernel. For measure of atrophy, bias field correction N4 was used to remove 1H images intensity inhomogeneities. 1H images were classified into tissue types (grey matter (GM), white matter (WM) and cerebrospinal fluid (CSF)) using the Computational Anatomy toolbox (CAT12). Brain volumes were normalized for head size using the intracranial volume and GM fraction and WM fraction were computed.
Statistical analyses
To map sodium homeostasis disturbances for each patient, we performed a voxel-based statistical-mapping analysis (SPM8) on the normalized and smoothed TSC map for each patient compared to the control population to evidence voxels with TSC increase at the individual level as detailed in [8]. The statistical threshold of significant TSC increase was determined as the maximum p-value for which no significant cluster survived when comparing each control to the whole control population, as proposed by [9]. Finally, we determined for each patient the percentage of voxels with TSC increase defined as the ratio of the number of voxels with TSC increase relative to the total number of explored voxels (from the whole brain). To explore potential links between TSC increase and clinical parameters, patients have been splitted into two groups depending on the median of percentage of voxels with TSC increase for all patients.
Results
Individual maps quantifying voxels with TSC increase evidenced a high heterogeneity between patients consistent with clinical presentation, although the mainly involved areas were the corticospinal tracts. Half patients showed abnormal TSC increase within more than 1% of whole brain voxels. Among them, 6 patients (21%) had between 1% and 5%, 5 patients (18%) had between 5% and 10% and 3 patients (11%) had more than 10% of voxels with TSC increase. TSC increase was associated with clinical severity: patients with TSC increase (>1%) showed higher ALSFRS-R slope (-1.08±0.83 vs -0.59±0.89, p=0.02), lower ALSFRS-R at 6 months (29.5±10 vs 36.9±7.4, p=0.04) and shorter survival (42±36 vs 70±28 months, p=0.04) but no difference in GM (p=0.34) neither WM atrophy (p=0.96).Discussion
This study allowed to map abnormal sodium homeostasis with brain 23Na MRI in ALS using a novel approach designed for individual patient. Individual maps of increase TSC showed heterogeneity between patients and an association with disease presentation and severity. Mapping sodium homeostasis disturbances at the individual level in ALS patients might therefore be a future biomarker to help stratify patients and evaluate new therapeutics.Acknowledgements
This research was funded by APHM (AORC Junior program), ARSLA (Association pour la Recherche sur la Sclérose Latérale Amyotrophique et autres maladies du motoneurone) and FRC (Fédération pour la Recherche sur le Cerveau).References
1. van Es MA, Hardiman O, Chio A, et al (2017) Amyotrophic lateral sclerosis. Lancet 390:2084–2098.
2. Kassubek J, Pagani M (2019) Imaging in amyotrophic lateral sclerosis: MRI and PET. Curr Opin Neurol 32:740–746.
3. Mazón M, Vázquez Costa JF, Ten-Esteve A, Martí-Bonmatí L (2018) Imaging Biomarkers for the Diagnosis and Prognosis of Neurodegenerative Diseases. The Example of Amyotrophic Lateral Sclerosis. Front Neurosci 12:784
4. Dharmadasa T, Huynh W, Tsugawa J, et al (2018) Implications of structural and functional brain changes in amyotrophic lateral sclerosis. Expert Rev Neurother 18:407–419.
5. Agosta F, Spinelli EG, Filippi M (2018) Neuroimaging in amyotrophic lateral sclerosis: current and emerging uses. Expert Rev Neurother 18:395–406.
6. Zaaraoui W, Konstandin S, Audoin B, et al (2012) Distribution of brain sodium accumulation correlates with disability in multiple sclerosis: a cross-sectional 23Na MR imaging study. Radiology 264:859–86.
7. Grapperon A-M, Ridley B, Verschueren A, et al (2019) Quantitative Brain Sodium MRI Depicts Corticospinal Impairment in Amyotrophic Lateral Sclerosis. Radiology 292:422–42.
8. Maarouf A, Audoin B, Gherib S, et al (2022) Grey-matter sodium concentration as an individual marker of multiple sclerosis severity. Mult Scler 28:1903–1912
9. Crespy L, Zaaraoui W, Lemaire M, et al (2011) Prevalence of Grey Matter Pathology in Early Multiple Sclerosis Assessed by Magnetization Transfer Ratio Imaging. PLoS ONE 6:e24969.
Figures
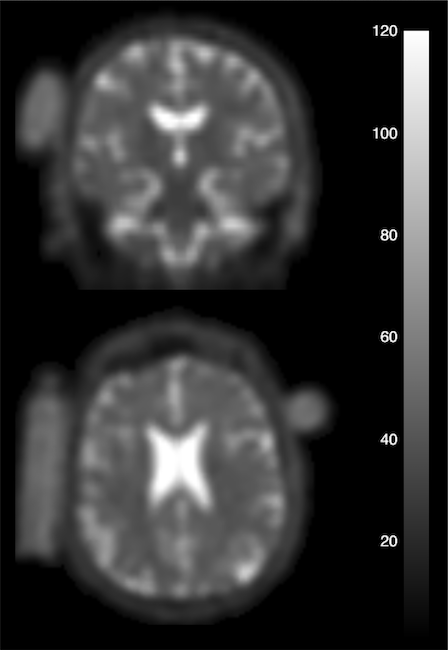
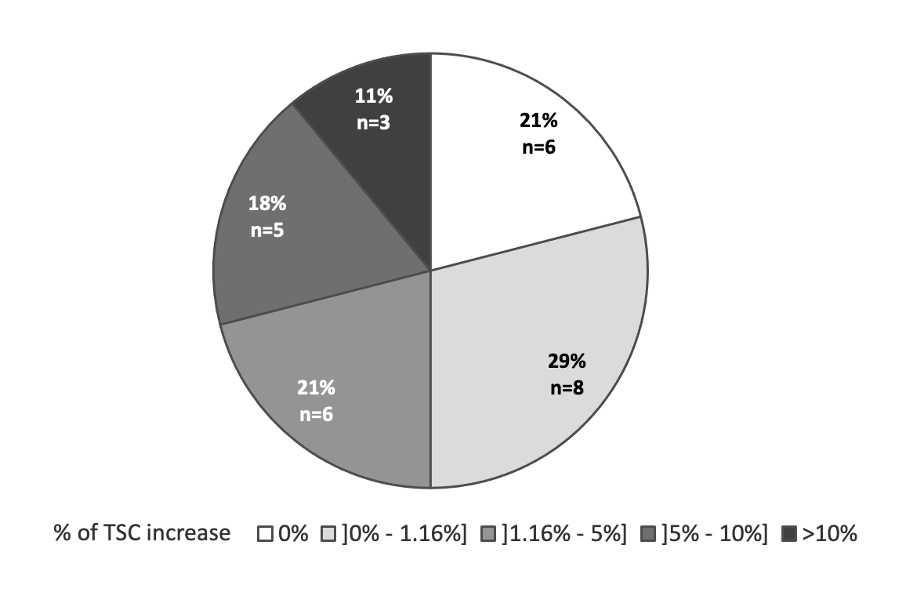
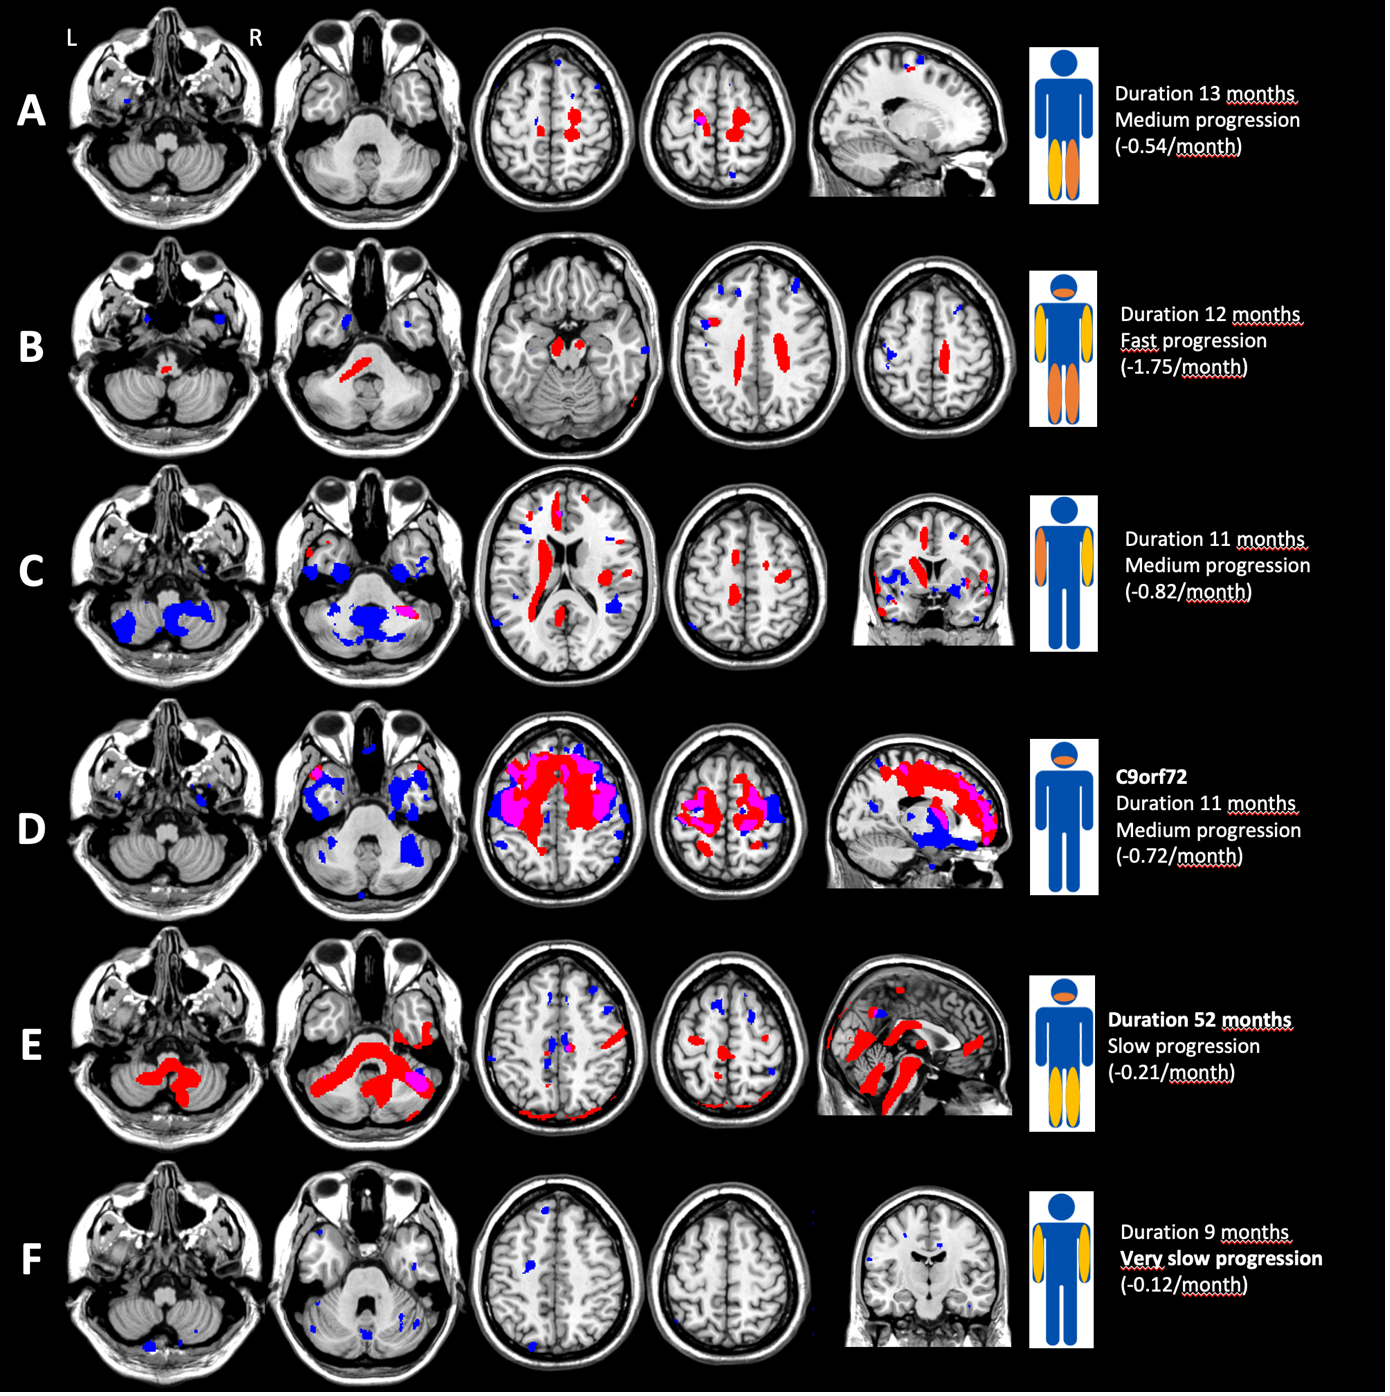
Figure 3: Individual maps of sodium homeostasis disturbances.
For each individual map, voxels with TSC increase are represented in red and atrophy in blue. The overlap between TSC increase and atrophy is represented in pink. The patient's clinical presentation is schematized by the level of the deficit (bulbar, right or left upper limb or lower limb) and its intensity (yellow for mild and orange for severe).
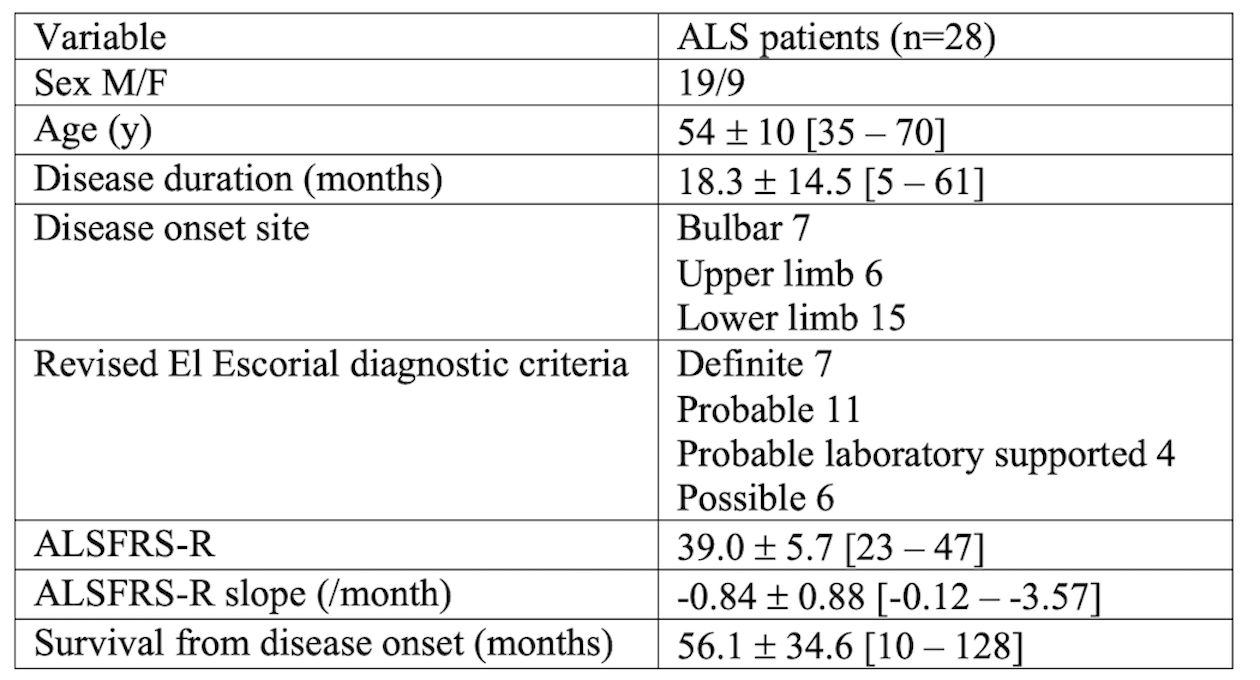
Table 1: Clinical characteristics of ALS patients.
Data are expressed as mean ± standard deviation and data between brackets represent the range [min-max]. Revised amyotrophic lateral sclerosis functional rating scale (ALSFRS-R)