0660
Relationships between Brain Microstructures and Visual Field Loss Patterns in Glaucoma using Diffusion MRI and Archetypal Analysis1Department of Ophthalmology, New York University Grossman School of Medicine, New York, NY, United States, 2Department of Radiology, New York University Grossman School of Medicine, New York, NY, United States, 3Wills Eye Hospital, Philadelphia, PA, United States, 4Sidney Kimmel Medical College of Thomas Jefferson University, Philadelphia, PA, United States, 5Department of Biomedical Engineering, Drexel University, Philadelphia, PA, United States, 6Schepens Eye Research Institute, Harvard Medical School, Boston, MA, United States
Synopsis
Keywords: Other Neurodegeneration, Neurodegeneration
Motivation: In bilateral glaucoma, visual field loss often spares complementary regions between eyes to optimize residual vision, but the underlying mechanisms are unknown.
Goal(s): Investigate how brain microstructural environment relates to regional visual field loss patterns in glaucoma.
Approach: Advanced diffusion MRI parameters of optic radiation integrity were correlated with glaucomatous visual field loss patterns using partial correlation and archetypal analyses.
Results: Diffusion MRI metrics generally correlated with overall visual field loss. Complementary archetypal loss patterns were also found between eyes when associating pointwise visual field to certain MRI metrics sensitive to axonal/glial integrity and neuroinflammation, suggesting their involvement in influencing residual binocular vision.
Impact: Advanced neuroimaging combined with computational analysis can provide insights into the brain’s role in influencing preferential damage to maximize retained binocular vision in glaucoma. Diffusion MRI holds promise for assessing glaucoma progression and brain plasticity for guiding vision preservation.
Purpose
Recent visual field (VF) perimetry and electrophysiological studies in bilateral glaucoma patients suggested the brain control of glaucomatous degeneration, such that local loss of VF function in one eye is often spared in the same VF region of the contralateral eye, maximizing residual binocular visual function1–3. However, there is no direct evidence of how this brain control occurs to preserve complementary VF regions bilaterally. This study investigated the contributions of microstructural brain integrity to regional VF loss in both eyes of glaucoma patients using advanced diffusion MRI and archetypal (AT) analysis.Methods
Diffusion MRI measures water diffusion in the brain to infer microstructural organization and white matter connectivity. In this study, 13 early glaucoma, 28 advanced glaucoma, and 21 age-matched healthy subjects underwent MRI in a Siemens MAGNETOM Prisma 3T scanner equipped with a 20-channel head/neck coil. Diffusion imaging was performed at multiple shells comprising 3 b-values (250, 1000, 2000 s/mm2) along with multiple diffusion encoding directions (4, 20, 60, respectively) using echo-planar imaging. Ten non-diffusion weighted images at b = 0 s/mm2 were also acquired. Other imaging parameters included: field of view = 230x230 mm2, acquisition matrix = 100×100, voxel resolution = 2.3×2.3×2.3 mm3, number of slices = 52, repetition time = 5000 ms and echo time = 70 ms. Total acquisition time was about 10 min. Clinical ophthalmic assessments were obtained from medical records, which included peripapillary retinal nerve fiber layer (RNFL) thickness and cup-to-disc ratio (C/D) from spectral-domain optical coherence tomography (SD-OCT); and VF mean deviation (VF-MD) and pointwise total deviation from Humphrey VF perimetry. The experimental procedures involving human subjects were approved by the Institutional Review Board.The pre-processing steps for the diffusion images included eddy current distortion and motion correction in FSL v5.0.104, as well as Marchenko-Pastur principal component analysis denoising, Gibbs ringing correction, Rician bias correction, outlier detection, and smoothing using the Diffusion parameter EStImation with Gibbs and NoisE Removal (DESIGNER) suite5. We then used DESIGNER to calculate maps of diffusion tensor imaging (DTI) [fractional anisotropy (FA), axial diffusivity (AD), radial diffusivity (RD), mean diffusivity (MD)], diffusion kurtosis imaging (DKI) [mean kurtosis (MK), axial kurtosis (AK), radial kurtosis (RK)], and the DKI-extended white matter tract integrity (WMTI) parameters [axial intra-axonal space diffusivity (IASD), axial extra-axonal space (EAS) diffusivity (De, //), radial EAS diffusivity (De,⊥), axonal water fraction (AWF), and tortuosity of the EAS (ratio of De, // and De,⊥)]6.
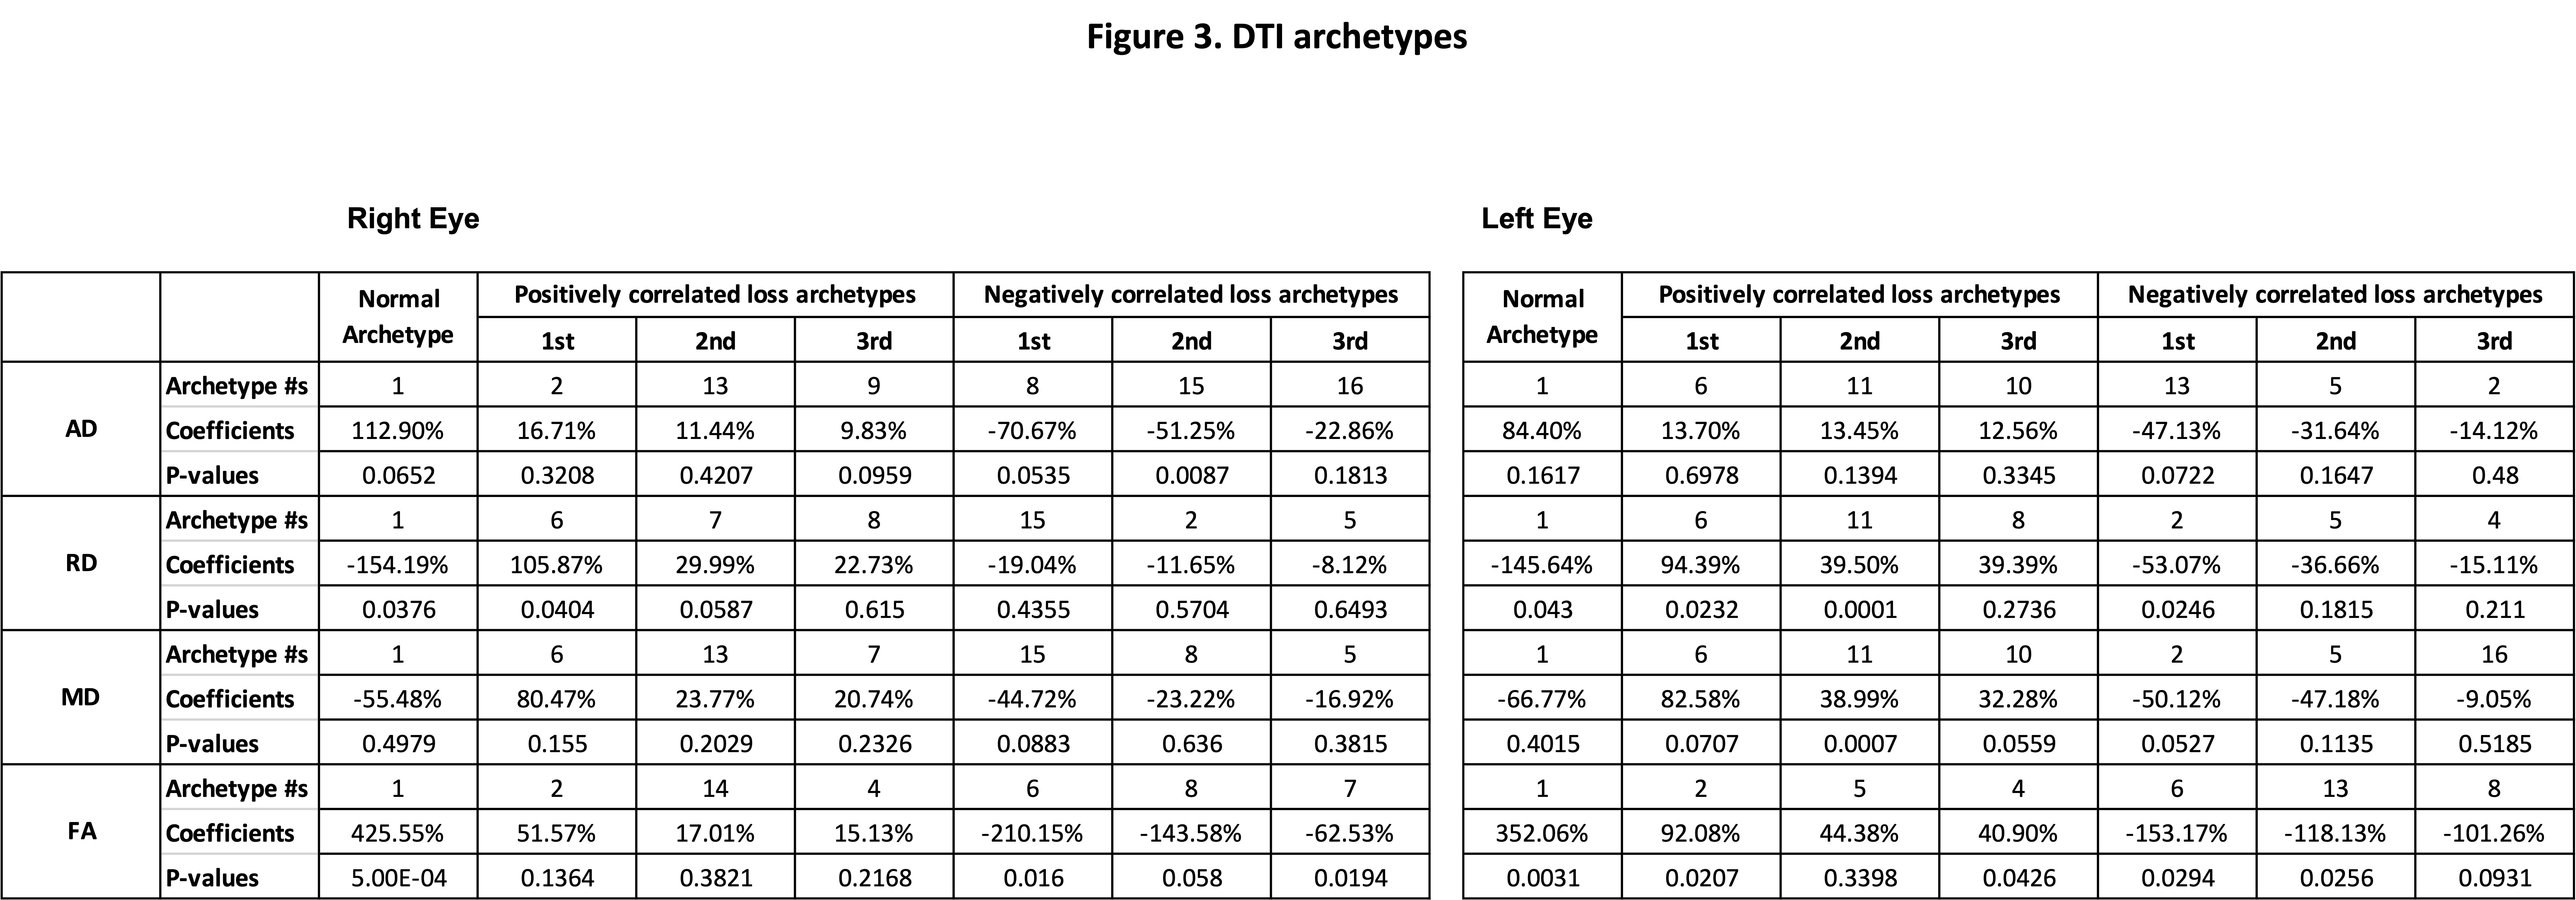
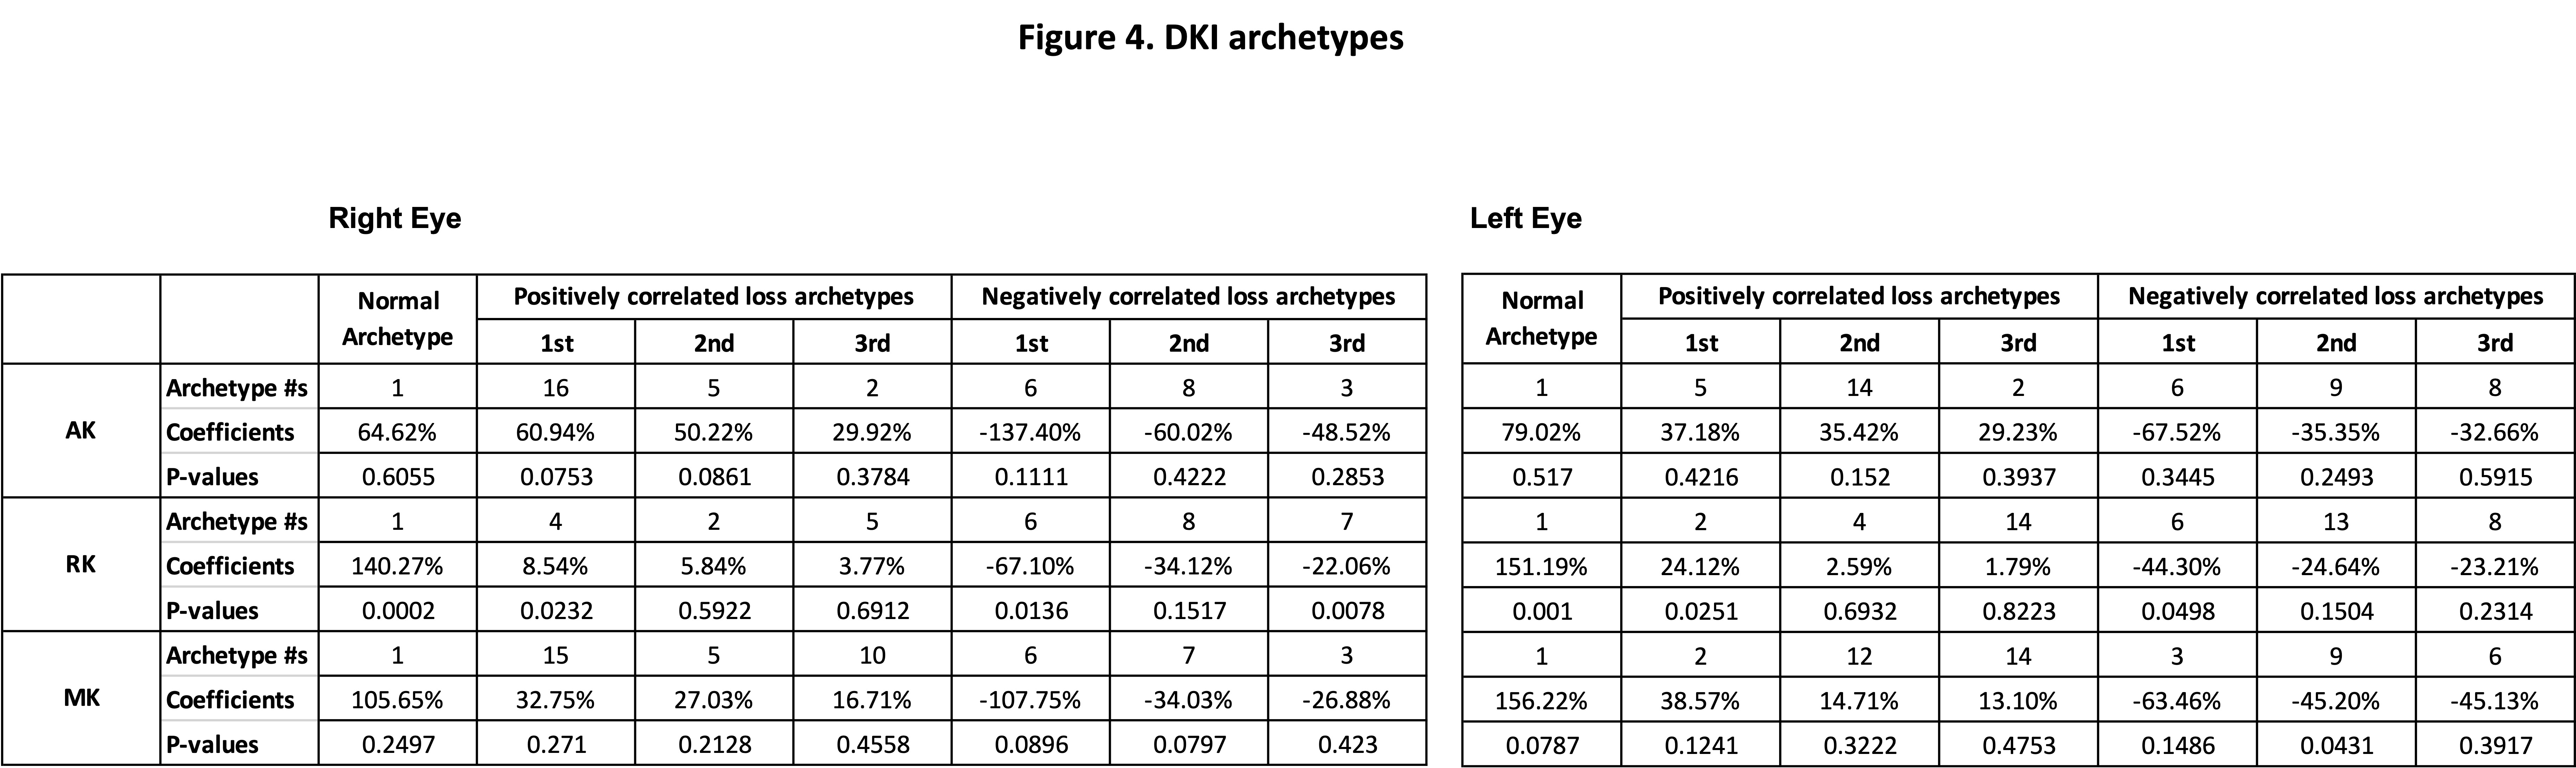
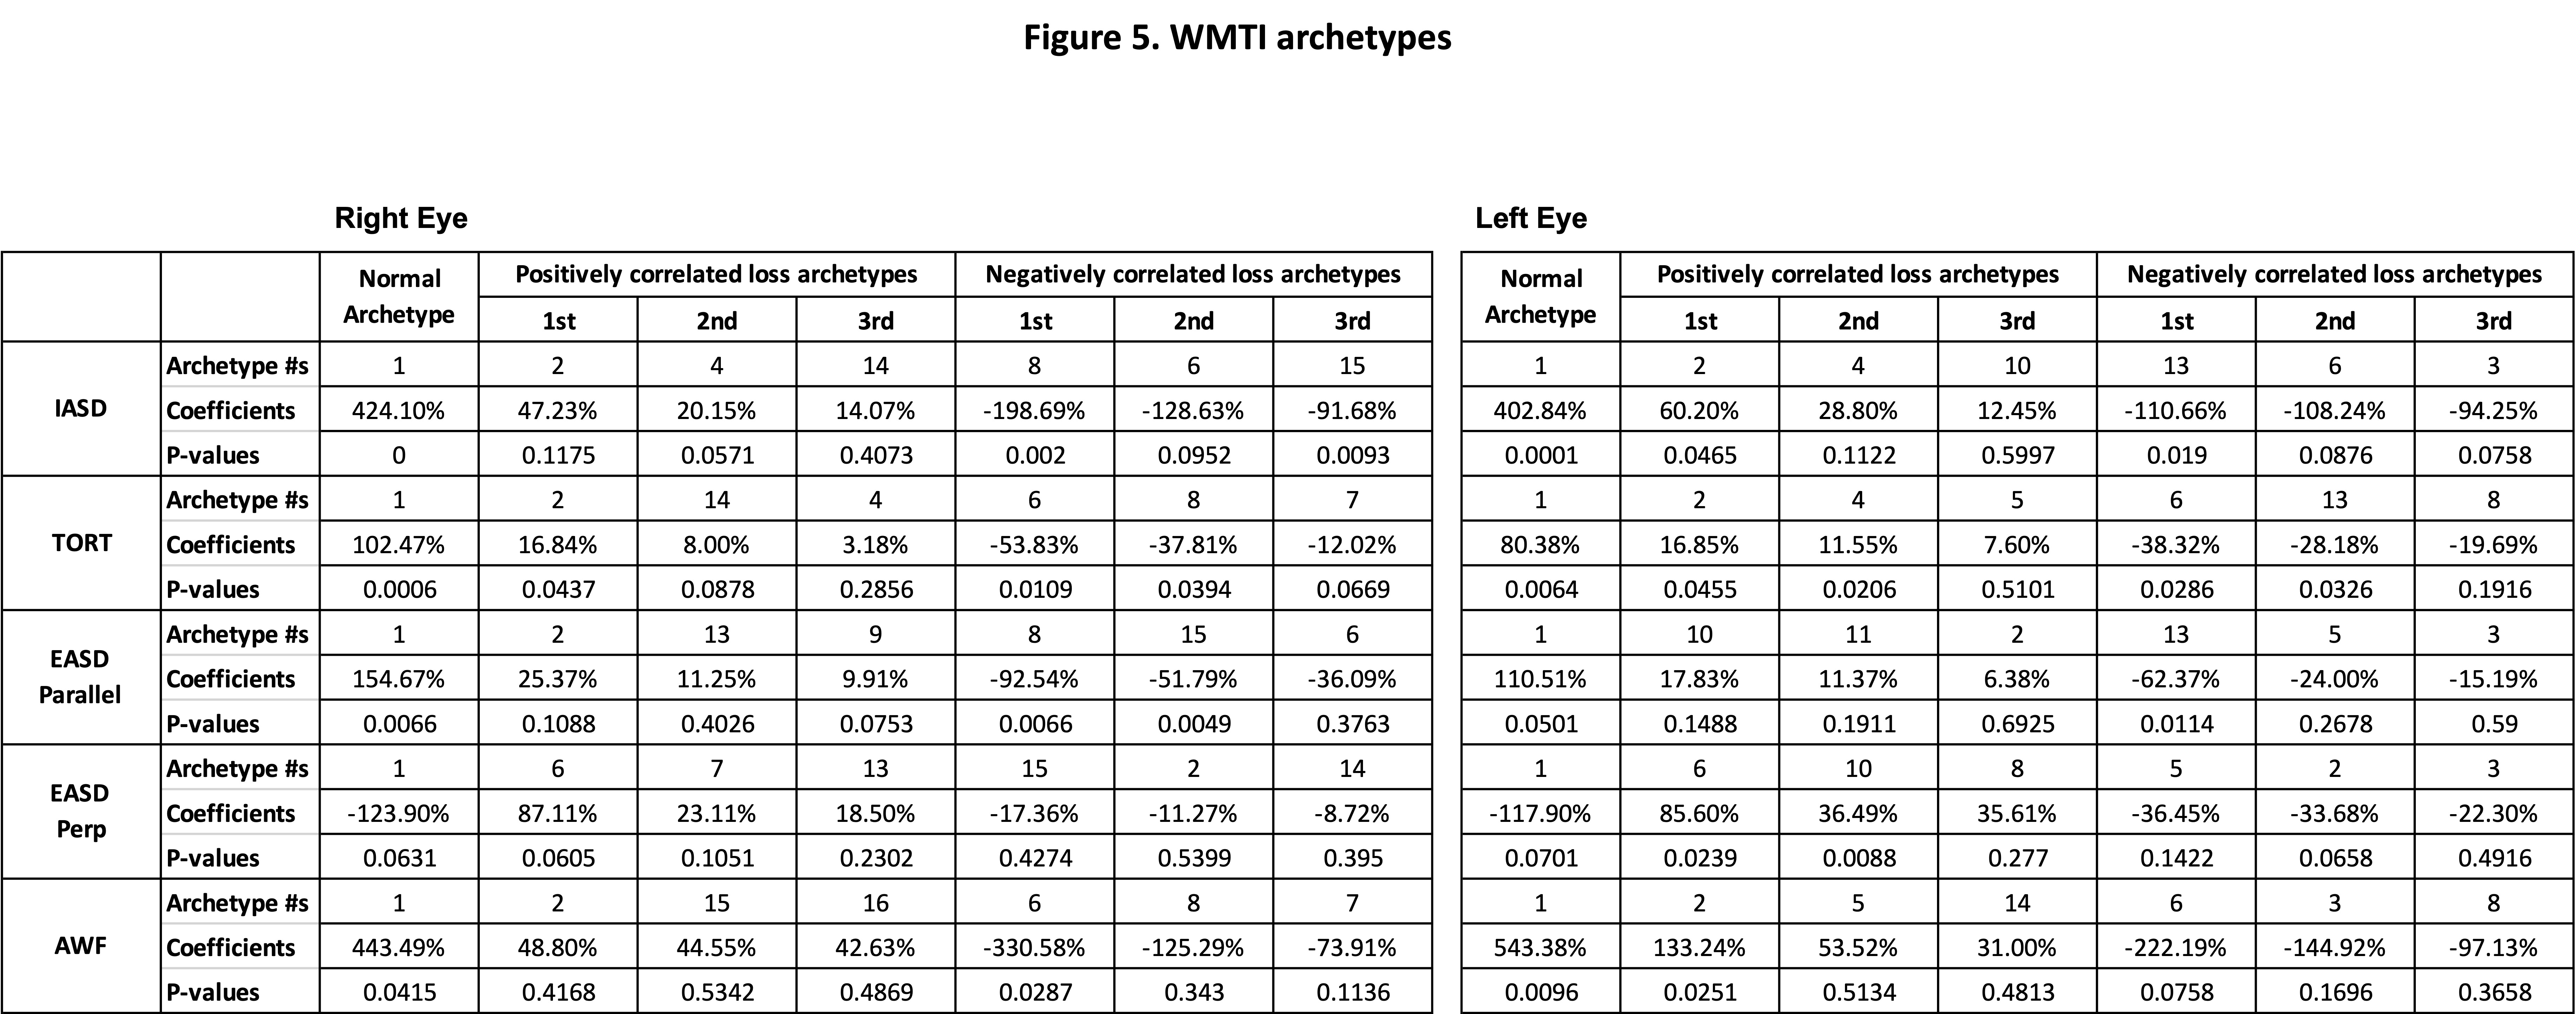
All maps were nonlinearly registered to the FMRIB58 FA standard-space image in FSL. Regions of interests (ROIs) were delineated on the left and right optic radiations of the FA map using brain atlas. The same ROIs were then applied to the other parametric maps. The mean values of DTI, DKI and WMTI parameters were estimated for the averaged left and right optic radiations. These parameters were then associated with 24-2 VF tests using partial correlations. The resulting VF models were aligned with 16 predefined AT patterns of VF loss using multivariate linear regression7(Figure 1). These predetermined ATs illustrate the potential influence of individual diffusion MRI parameters on regional VF loss.
Results
Clinical ophthalmic measurements were significantly different between groups, whereas age and sex were not significantly different between groups (Figure 1). In general, decreasing FA in DTI, decreasing RK in DKI, and decreasing tortuosity (TORT) in WMTI correlated with worse overall VF loss in both eyes (Figure 2). In archetypal analyses, increasing FA, RK, AWF, IASD, TORT, and EASD showed a positive coefficient to the normal VF archetype (AT1) and a negative coefficient to the overall VF loss archetype (AT6) (Figures 3-5). Interestingly, decreasing intra-axonal space diffusivity (IASD) in WMTI correlated with worse VF loss in the right eye's Superior-Altitudinal (AT8) VF area and left eye’s Inferior-Altitudinal (AT13) VF area in a complementary pattern (Figures 2 and 5). RD, RK, AWF, and EASD also showed complementary regional VF loss patterns between the left and right eyes (Figures 2-5).Conclusions
In summary, diffusion MRI biomarkers that are sensitive to axonal/glial integrity and neuroinflammation not only correlated with overall VF loss but also with complementary archetypal patterns of regional VF loss between eyes, suggesting their possible involvement in influencing compensatory binocular visual function in glaucoma patients. Advanced diffusion MRI combined with archetypal analysis provides insights into the role of the brain’s microstructural environment in contributing to preferential VF loss patterns that maximize residual vision in bilateral glaucoma. It also holds promise for assessing glaucoma progression and brain plasticity for guiding vision preservation.Acknowledgements
This work is supported in part by the National Institutes of Health R01-EY028125 and P41-EB017183 (Bethesda, Maryland), BrightFocus Foundation G2016030, G2019103, and G2021001F (Clarksburg, Maryland), and an unrestricted grant from Research to Prevent Blindness to NYU Langone Health Department of Ophthalmology (New York, New York).References
1. Sponsel WE, Johnson SL, Trevino R, et al. Pattern Electroretinography and Visual Evoked Potentials Provide Clinical Evidence of CNS Modulation of High- and Low-Contrast VEP Latency in Glaucoma. Transl Vis Sci Technol. 2017;6(6):6. doi:10.1167/tvst.6.6.6
2. Reilly MA, Villarreal A, Maddess T, Sponsel WE. Refined Frequency Doubling Perimetry Analysis Reaffirms Central Nervous System Control of Chronic Glaucomatous Neurodegeneration. Transl Vis Sci Technol. 2015;4(3):7. doi:10.1167/tvst.4.3.7
3. Sponsel WE, Groth SL, Satsangi N, Maddess T, Reilly MA. Refined Data Analysis Provides Clinical Evidence for Central Nervous System Control of Chronic Glaucomatous Neurodegeneration. Transl Vis Sci Technol. 2014;3(3):1. doi:10.1167/tvst.3.3.1
4. Jenkinson M, Beckmann CF, Behrens TEJ, Woolrich MW, Smith SM. FSL. Neuroimage. 2012;62(2):782-790. doi:10.1016/j.neuroimage.2011.09.015
5. Ades-Aron B, Veraart J, Kochunov P, et al. Evaluation of the accuracy and precision of the diffusion parameter EStImation with Gibbs and NoisE removal pipeline. Neuroimage. 2018;183:532-543. doi:10.1016/j.neuroimage.2018.07.066
6. Sun Z, Parra C, Bang JW, et al. Diffusion Kurtosis Imaging Reveals Optic Tract Damage That Correlates with Clinical Severity in Glaucoma. In: 2020 42nd Annual International Conference of the IEEE Engineering in Medicine & Biology Society (EMBC). IEEE; 2020:1746-1749. doi:10.1109/EMBC44109.2020.9176192
7. Elze T, Pasquale LR, Shen LQ, Chen TC, Wiggs JL, Bex PJ. Patterns of functional vision loss in glaucoma determined with archetypal analysis. J R Soc Interface. 2015;12(103):20141118. doi:10.1098/rsif.2014.1118
Figures
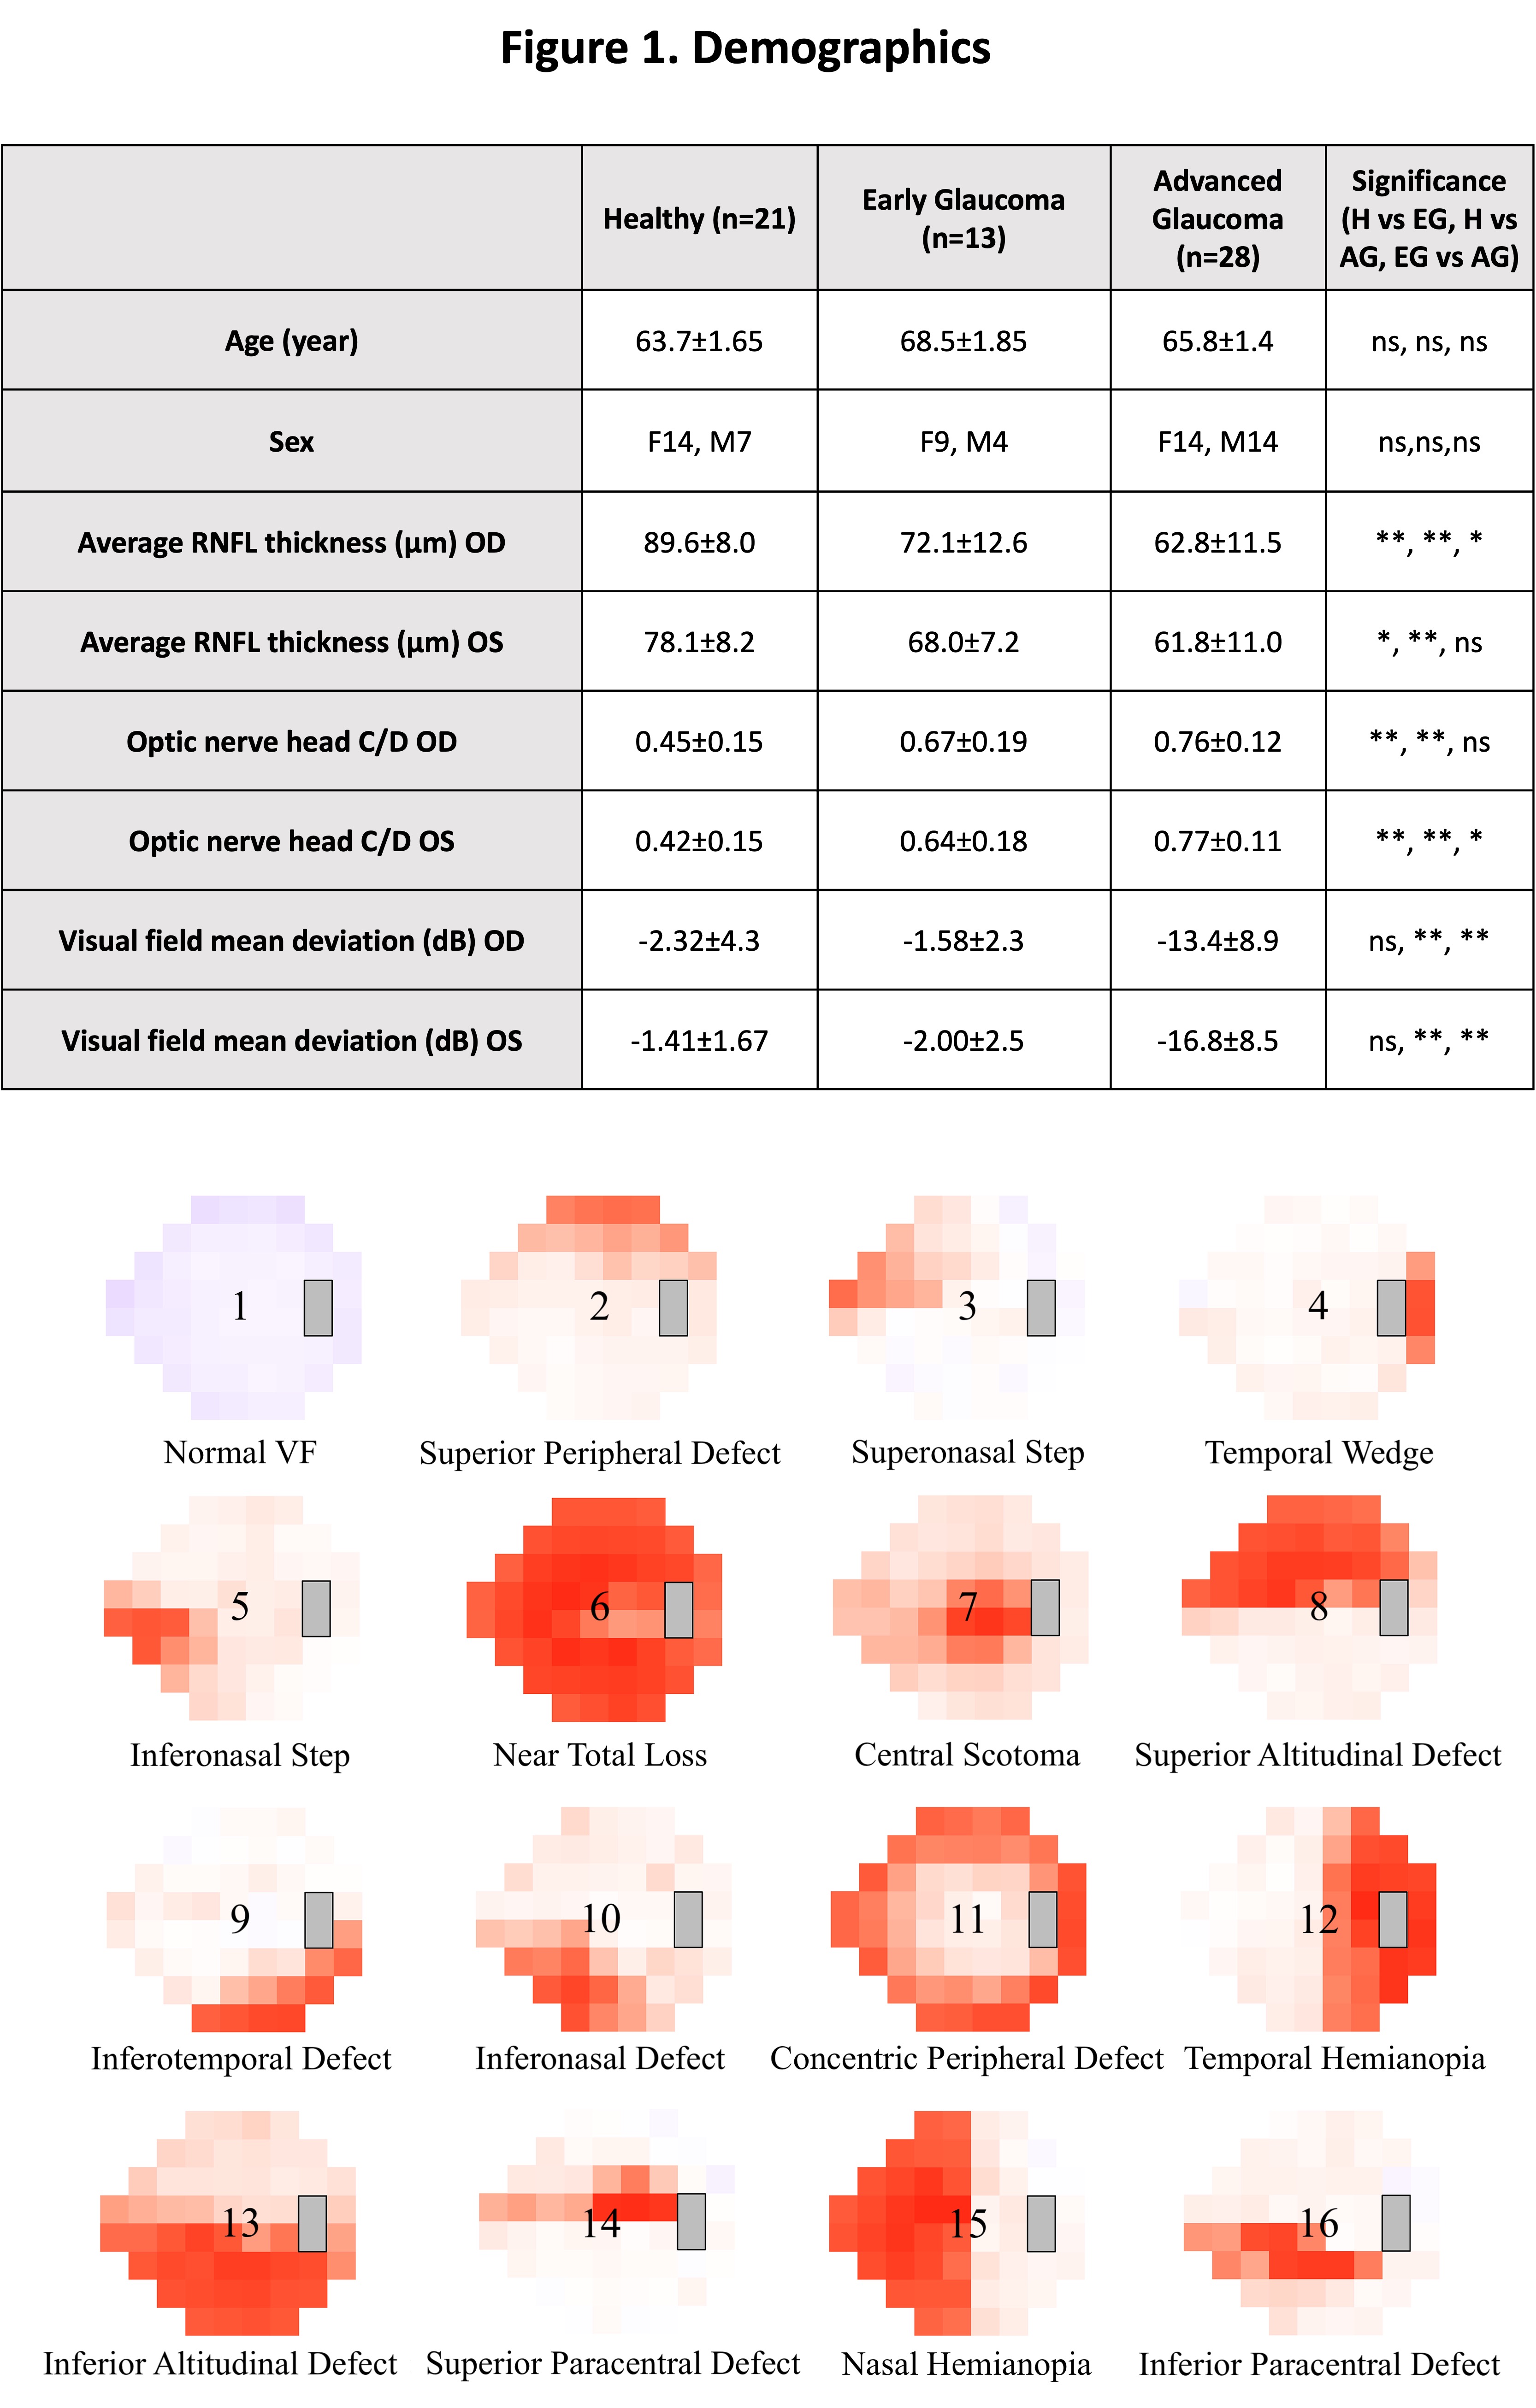
Fig.1: (Top) Clinical Ophthalmic characteristics of healthy, early glaucoma, and advanced glaucoma of this study. Mean ± standard error is displayed for each group. Anova was used to compared between Healthy (controls), Early Glaucoma, and Advanced Glaucoma groups. Chi-squared test in Rwas used for sex. * indicates p < 0.05, ** indicates p < 0.01, and ns indicates not significant. (RNFL: retinal nerve fiber layer; C/D: cup-to-disc ratio; OD: right eye; OS: left eye;).
(Bottom) Sixteen visual loss archetypal patterns derived from (PMID: 25505132) for brain associations in this study.
Fig.2: 2A: Anova and Tukey post-hoc was used for mean comparison between groups. Means and standard errors of dMRI parameters are presented. Significance between each two group are displayed using brackets.
2B: Partial correlation was performed to show MRI biomarkers’ correlation to 52 points of 24-2 VF. Blue color indicates when dMRI parameter increases, VF loss increases (positive correlation); red color indicates when dMRI parameter increases, VF loss decreases (negative correlation). For both figures, *indicates p<0.05, **indicates p<0.01, and ns = not significant.