0649
Histology-informed biophysical diffusion MRI model selection for enhanced liver cancer immunotherapy assessment1Radiomics Group, Vall d’Hebron Institute of Oncology, Vall d’Hebron Barcelona Hospital Campus, Barcelona, Spain, 2Cardiff University Brain Research Imaging Centre (CUBRIC), School of Psychology, Cardiff University, Cardiff, United Kingdom, 3School of Computer Science and Informatics, Cardiff University, Cardiff, United Kingdom, 4Molecular Oncology Group, Vall d’Hebron Institute of Oncology, Vall d’Hebron Barcelona Hospital Campus, Barcelona, Spain, 5Prostate Cancer Translational Research Group, Vall d’Hebron Institute of Oncology, Vall d’Hebron Barcelona Hospital Campus, Barcelona, Spain, 6Department of Biomedicine, Faculty of Medicine and Health Sciences, University of Barcelona, Barcelona, Spain, 7PET/MR Unit, CETIR-Ascires, Barcelona, Spain, 8Department of Radiology, Hospital Universitari Vall d’Hebron, Barcelona, Spain, 9Institut de Diagnòstic per la Imatge (IDI), Barcelona, Spain, 10Siemens Healthineers, Madrid, Spain, 11GE HealthCare, Madrid, Spain, 12GU, Sarcoma and Neuroncology Unit, Hospital Universitari Vall d’Hebron, Barcelona, Spain, 13Drug Development Unit, Vall d’Hebron Institute of Oncology, Vall d’Hebron Barcelona Hospital Campus, Barcelona, Spain, 14Biomarkers and Clonal Dynamics Group, Vall d’Hebron Institute of Oncology, Vall d’Hebron Barcelona Hospital Campus, Barcelona, Spain, 15Early Clinical Drug Development Group, Vall d’Hebron Institute of Oncology, Vall d’Hebron Barcelona Hospital Campus, Barcelona, Spain
Synopsis
Keywords: Microstructure, Modelling, Immunotherapy, Liver, Tumours, Histology
Motivation: Multi-compartment liver diffusion MRI (dMRI) provides innovative markers of intra-cellular fraction (F) and cell size (CS). However, practical implementations for histologically-meaningful F and CS computation in the clinic are still sought.
Goal(s): To deliver a compact approach for F and CS estimation, informing model design with histology.
Approach: We compared 5 implementations of a standard two-compartment model for their ability to provide F and CS estimates that agree with reference biopsies in liver tumours.
Results: The best approach consisted of fitting a single-compartment model of intra-cellular diffusion to high b-value images. This provides promising metrics that stratify the risk of progression in immunotherapy.
Impact: We deliver a clinically-feasible liver diffusion MRI approach for intra-cellular fraction, cell size and density estimation. It consists of fitting a single-compartment model of restricted diffusion to high b-value images, and provides metrics that may inform on cancer immunotherapy response.
Introduction
Multi-compartment (MCB) body diffusion Magnetic Resonance Imaging (dMRI) models provide intra-cellular fraction (F) and cell size (CS) estimates1–3, promising markers to assess treatment response in oncology4,5. Despite their potential, there is still a need for practical MCB implementations that are truly feasible in clinical settings, i.e., requiring scan times under 15 minutes, and off-the-shelf dMRI sequences. In this work we compared clinically feasible implementations of a standard MCB dMRI model for their ability to provide estimates of F and CS that agree with histology. We focussed on the liver, a common site of metastasisation, delivering a compact modelling approach that is demonstrated in cancer immunotherapy.Methods
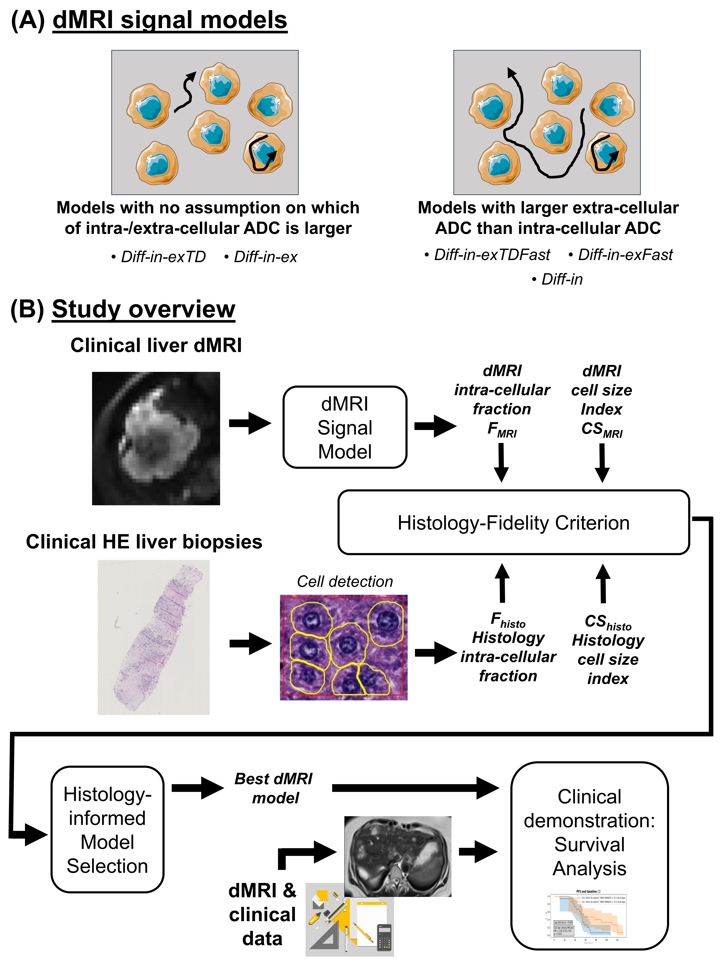
Study designWe compared five implementations of a two-compartment model2 accounting for restricted intra-cellular (IC) diffusion within cells of diameter CS, and extra-cellular (EC) hindered diffusion with apparent diffusion coefficient (ADC) ADCex (Fig. 1.A).
Three implementations assume larger ADCex than IC ADC (ADCin):
- Diff-in-exTDFast, featuring diffusion-time dependence (DTD) in both ADCin and ADCex6,7, while ensuring ADCex > ADCin;
- Diff-in-exFast, featuring DTD only in ADCin (ensuring ADCex > ADCin);
- Diff-in, in which the IC signal is taken as a proxy for the total signal, hypothesising that ADCex ≫ ADCin (so that $$$e^{-b \, ADC_{ex}}$$$ ≃ 0).
- Diff-in-exTD, featuring DTD in both ADCin and ADCex6,7;
- Diff-in-ex, featuring DTD only in ADCin.
$$HFC \,\,=\,\, \frac{|F_{MRI} - F_{histo}|}{F_{histo}}\,+\,\frac{|CS_{MRI} - CS_{histo}|}{CS_{histo}}, \,\,\,\,\,\,(1)$$
so that lower HFC implies closer agreement.
Data
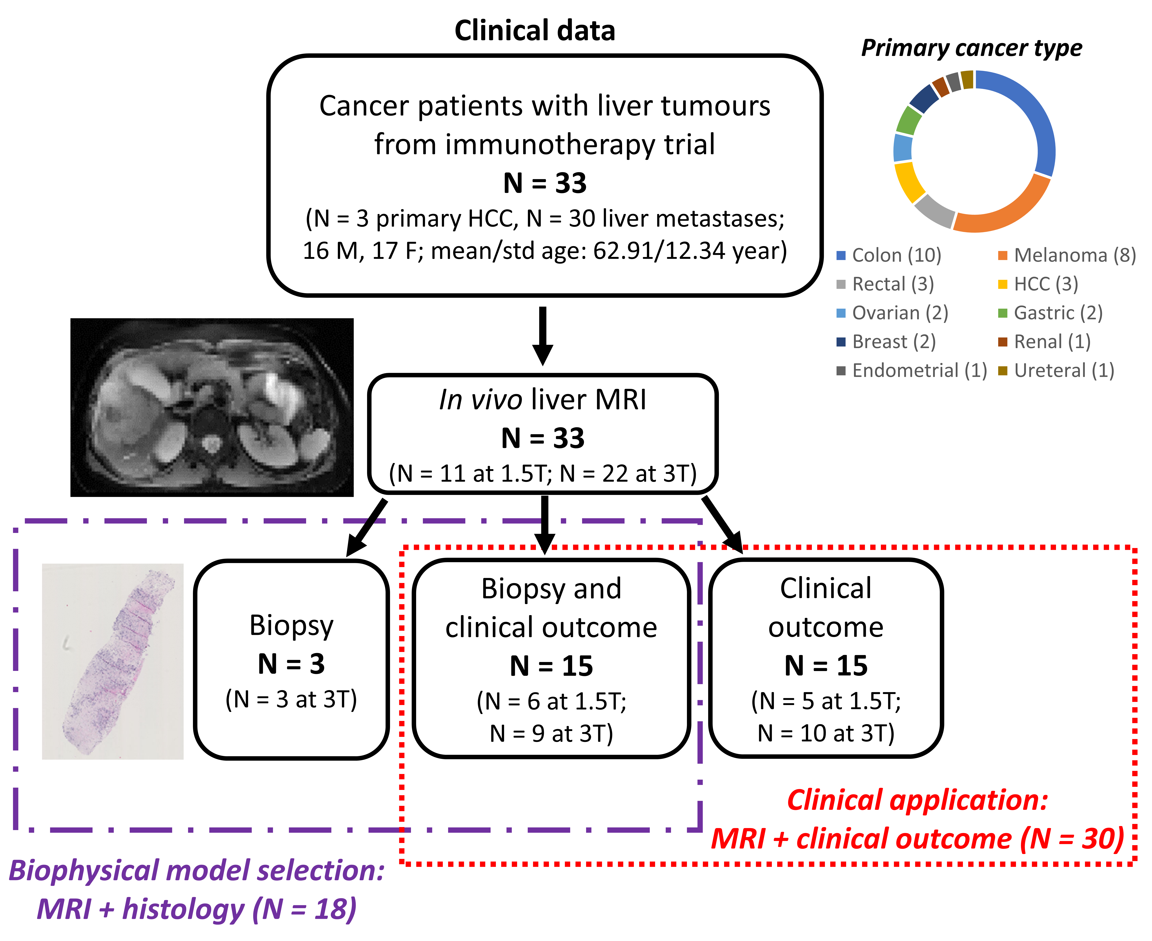
We analysed data from an ongoing study, consisting of liver dMRI, hemaotxylin-eosin (HE)-stained biopsies and clinical information (progression-free survival, PFS) from 33 patients. These participated in a phase I immunotherapy trial, and suffered from various primary cancers (Fig. 2).
Analysis
MRI Patients were scanned on either a 1.5T Siemens Avanto or a 3T GE SIGNA-Pioneer system (resolutions of respectively 1.9×1.9×6 mm3 and 2.4×2.4×6 mm3; 7 b-values, bmax of 1600 s/mm2, 3 diffusion times, achieved by changes in TE; scan time: 15 minutes) immediately before starting immunotherapy. F and CS were computed after routine pre-processing8,9. A CD index1 was also obtained as $$$CD_{MRI} = F_{MRI}/CS_{MRI}^{3}$$$, alongside standard ADC and kurtosis10 (K). Mean values of all metrics were extracted within liver tumours.
Histology Digitised biopsy images from one liver tumour were processed with QuPath11 and in-house code, estimating histological F and volume-weighted12 CS.
Model selection Models were ranked according to HFC and to signal model quality of fit, through the Bayesian Information Criterion (BIC)13. Rankings were performed:
i) after fitting models on all images;
ii) after fitting models only on high b-value images (b≥1200 s/mm2).
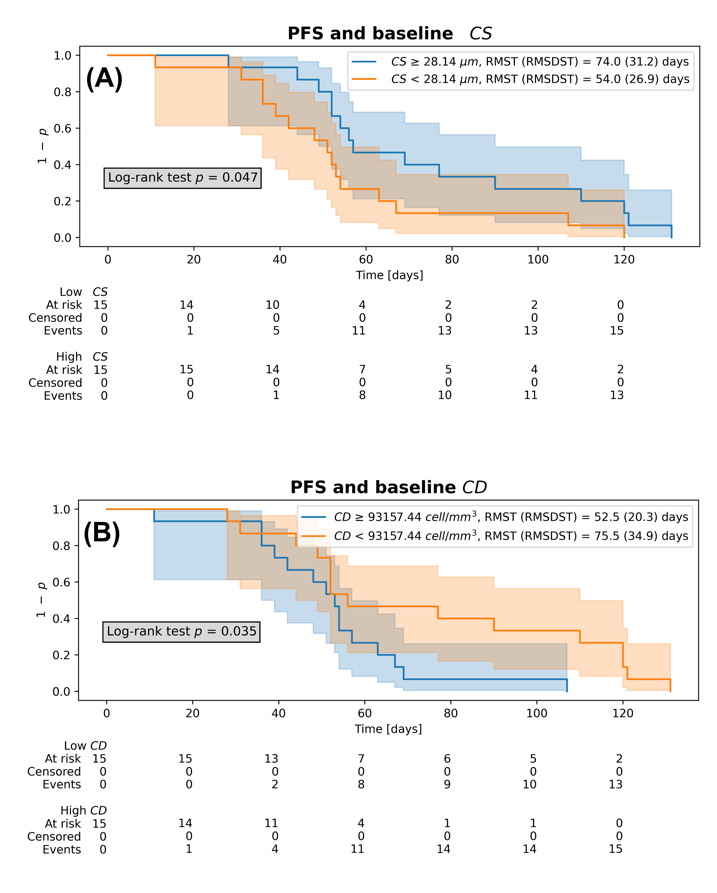
Clinical application Patients were split into two groups according to baseline mean F, CS, CD, ADC and K (higher/lower than the median). Kaplan-Meier survival curves of the two groups were compared with a log-rank test.
Results and discussion
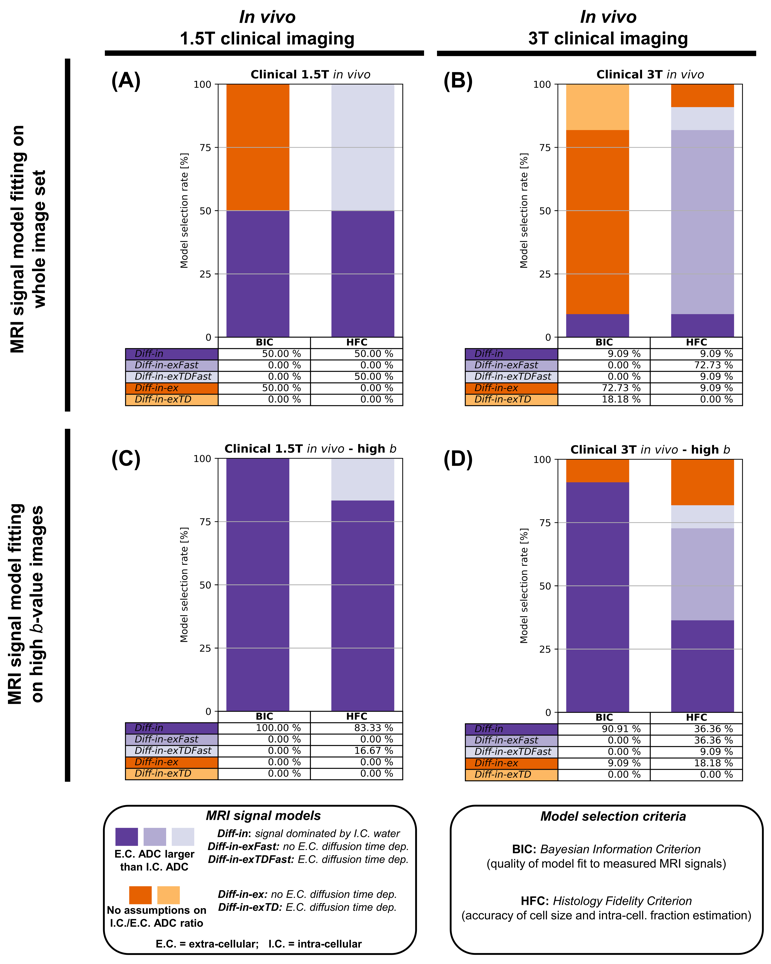
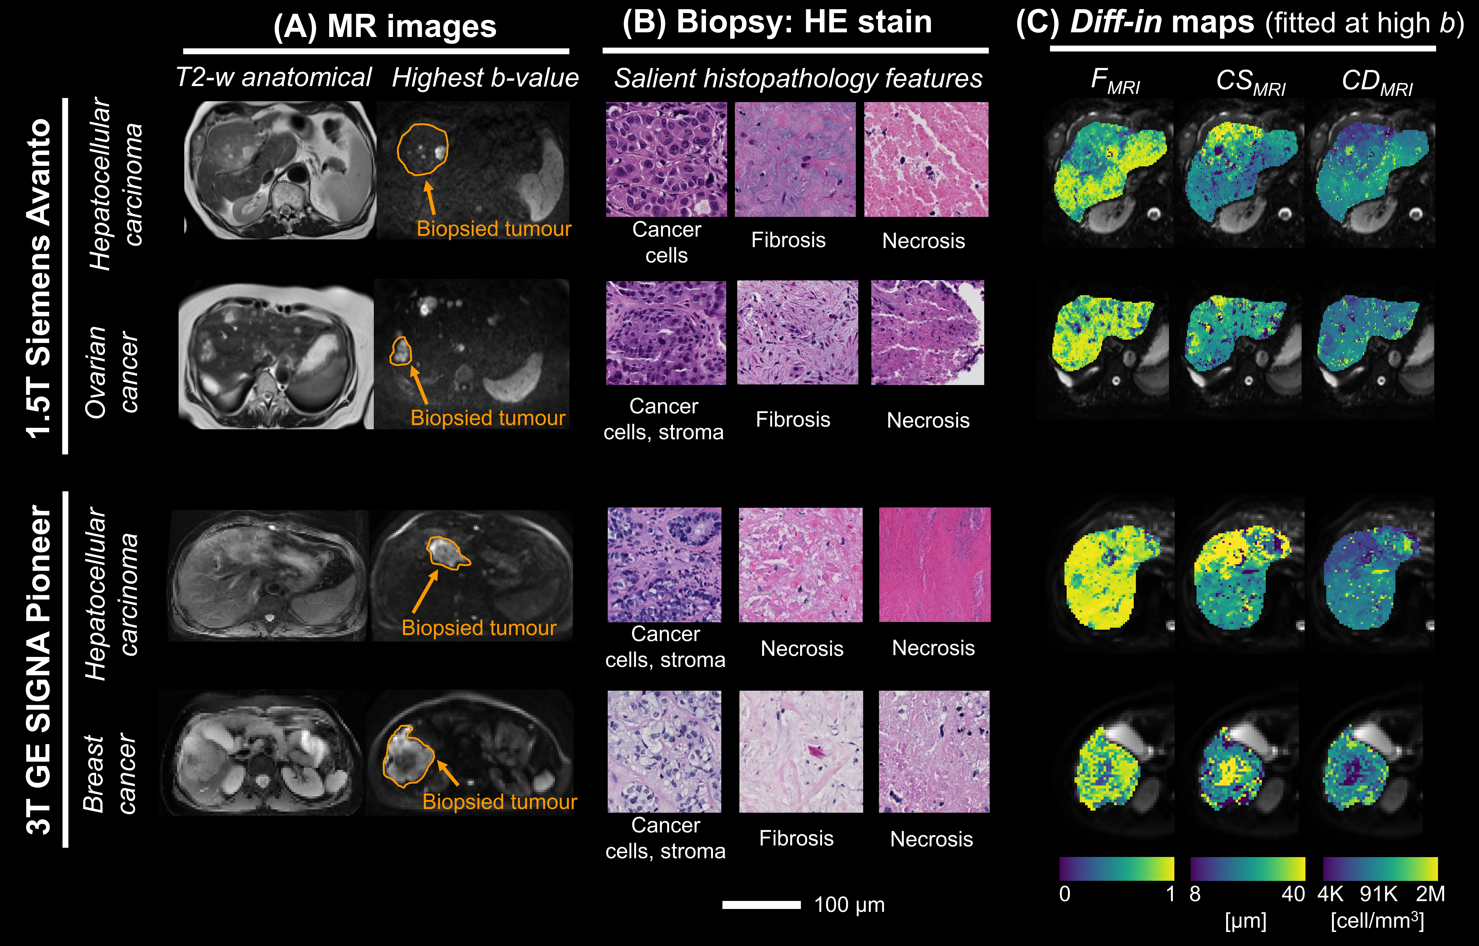
Fig. 3 reports rankings. Models with ADCex > ADCin (Diff-in-exTDFast, Diff-in-exFast, Diff-in) rank higher than more generic Diff-in-exTD and Diff-in-ex according to HFC. BIC largely agrees with this ranking. When fitting is performed on high b-value images only, Diff-in dominates, pointing towards the validity of the hypothesis of negligible EC signal at high b, compared to IC. Diff-in fitted at high b-value was then selected for subsequent analyses.Fig. 4 illustrates Diff-in maps and histology images in liver tumours of four patients. Diff-in metrics characterise intra-tumour microstructural variations that are compatible with known cancer characteristics. For example, a core of reduced F and CD is seen in a breast cancer metastasis, likely indicative of necrosis.
Statistically significant differences between survival curves of the two patient groups were seen for CS (p = 0.047) and CD (p = 0.035). Lower CS and higher CD at baseline were associated with faster progression (Fig. 5). This implies that the presence of smaller cells and tighter cell packing within liver tumours at baseline may point towards worse immunotherapy outcomes. No significant differences were seen for F, ADC and K (Kaplan-Meier curves not shown).
Conclusions
Among all tested approaches, a practical liver dMRI signal model consisting of a single compartment of restricted IC diffusion, fitted to high b-value images, enables computing the closest estimates of IC fraction F and CS to histology. The approach provides metrics that may be useful biomarkers in applications such as response prediction in immunotherapy, outperforming routine ADC and kurtosis.Acknowledgements
This project received support from AstraZeneca (AZ); AZ was not involved in the acquisition and analysis of the data, interpretation of the results, or the decision to submit this abstract. RPL is supported by ”la Caixa” Foundation, a CRIS Foundation Talent Award (TALENT19-05), the FERO Foundation, the Instituto de Salud Carlos III-Investigación en Salud (PI18/01395 and PI21/01019) and the Prostate Cancer Foundation (18YOUN19). FG receives the support of a fellowship from ”la Caixa” Foundation (ID 100010434). The fellowship code is “LCF/BQ/PR22/11920010”, and the fellowship also supports AV. AG is supported by a Severo Ochoa PhD fellowship (PRE2022-102586). KB is funded by a Generalitat de Catalunya Beatriu de Pinós post-doctoral grant (2019 BP 00182). MP is supported by the UKRI Future Leaders Fellowship MR/T020296/2. Parts of Figure 1 were drawn by using pictures from Servier Medical Art. Servier Medical Art by Servier is licensed under a Creative Commons Attribution 3.0 Unported License (https://creativecommons.org/licenses/by/3.0).References
1. Panagiotaki E, et al. Microstructural Characterization of Normal and Malignant Human Prostate Tissue With Vascular, Extracellular, and Restricted Diffusion for Cytometry in Tumours Magnetic Resonance Imaging. Invest Radiol 2015; 50(4): 218-227.
2. Jiang X, et al. Mapping hepatocyte size in vivo using temporal diffusion spectroscopy MRI. Magn Reson Med 2020; 84(5): 2671-2683.
3. Palombo M, et al. Joint estimation of relaxation and diffusion tissue parameters for prostate cancer with relaxation-VERDICT MRI. Sci Rep 2023; 13(1): 2999.
4. Jiang X, et al. MRI of tumor T cell infiltration in response to checkpoint inhibitor therapy. J Immunother Cancer 2020; 8(1): e000328.
5. Hoffmann E, et al. Profiling specific cell populations within the inflammatory tumor microenvironment by oscillating-gradient diffusion-weighted MRI. J Immunother Cancer 2023; 11(3): e006092.
6. Reynaud O.
Time-Dependent Diffusion MRI in Cancer: Tissue Modeling and Applications. Frontiers in Physics 2017; 5:58.
7. Xu J, et al. Diffusion time dependency of extracellular diffusion. Magn Reson Med 2023; 89(6): 2432-2440.
8. Veraart J, et al. Denoising of diffusion MRI using random matrix theory. Neuroimage 2016; 142: 394-406.
9. Kellner E, et al. Gibbs-ringing artifact removal based on local subvoxel-shifts. Magn Reson Med 2016; 76(5): 1574-1581.
10. Jensen JH, et al. Diffusional kurtosis imaging: the quantification of non‐gaussian water diffusion by
means of magnetic resonance imaging. Magn Reson
Med 2005; 53(6): 1432-1440.
11. Bankhead P, et al. QuPath: Open source software for digital pathology image analysis. Sci Rep 2017; 7(1): 16878.
12. Grussu F, et al. Diffusion MRI signal cumulants and hepatocyte microstructure at fixed diffusion time: Insights from simulations, 9.4T imaging, and histology. Magn Reson Med 2022; 88(1): 365-379.
13. Schwarz G. Estimating the Dimension of a Model. The Annals of Statistics 1978; 6(2):461-464.
Figures