0647
Modelling the intermediate flow regime in flow-compensated intravoxel incoherent motion MRI1Department of Medical Radiation Sciences, Institute of Clinical Sciences, Sahlgrenska Academy, University of Gothenburg, Gothenburg, Sweden, 2Department of Medical Physics and Biomedical Engineering, Sahlgrenska University Hospital, Region Västra Götaland, Gothenburg, Sweden
Synopsis
Keywords: IVIM, Perfusion, IVIM, Diffusion
Motivation: Lack of consensus in perfusion modelling in IVIM MRI, with focus on blood flow in biological tissue.
Goal(s): To model perfusion in flow-compensated IVIM MRI to allow for blood velocity and correlation time quantification.
Approach: Using a velocity autocorrelation function to describe the dynamics of capillary blood flow, an expression for perfusion signal attenuation was derived for flow-compensated IVIM MRI, and evaluated in healthy brain.
Results: The proposed model allows for direct quantification of velocity and correlation time of blood flow, in addition to perfusion fraction and diffusion coefficient.
Impact: The study presents initial proof-of-concept directly quantifying velocity and correlation time of blood flow in healthy brain using flow-compensated Intravoxel Incoherent Motion MRI. Access to these parameters can assist in characterizing tissue microvasculature in disease.
Introduction
Diffusion and perfusion-weighted imaging offer valuable information in several clinical applications, e.g., brain tumor characterization and treatment response assessment1–3. Intravoxel incoherent motion (IVIM) imaging allows for non-invasive perfusion quantification using diffusion-weighted images4. While IVIM perfusion estimates have proven to have diagnostic and prognostic value for glioma5,6, consensus on perfusion modelling is yet to be reached.IVIM models often assume the motion of capillary blood to be in a temporal regime. Most commonly, the blood flow is assumed to change direction several times during the diffusion encoding-time, mimicking a diffusive motion (diffusive regime). The opposite can also be assumed, i.e., the blood never changes direction during the measurement (ballistic regime). However, encoding-time dependence of IVIM parameters has been demonstrated in abdominal organs7, and brain8, suggesting blood flow pertains to an intermediate regime. Flow-compensated diffusion gradients with varying encoding-time may be used to explore these temporal characteristics of intravoxel incoherent motion7.
The aim of this study was to propose and evaluate a model for an intermediate flow regime in flow-compensated IVIM MRI.
Theory
IVIM model
During an IVIM experiment, the acquired signal is assumed to comprise two components: one capturing the tissue diffusion, characterized by the tissue diffusion coefficient (D) while the other represents perfusion attenuation (FP). The acquired IVIM signal S for diffusion-weighting b can be expressed as$$ \frac{S(\text{b})}{S_0} = \left(1-f\right)\text{exp}(-\text{b}D) + f\: F_{P}\:\text{exp}(-\text{b}D_b) \;\;\;\;\;\;\;\;\;\;\;\;(1)$$where S0 is the signal for b=0, f is the perfusion fraction and Db is the diffusion coefficient in blood. An appropriate model of FP will depend on the capillary architecture, blood flow velocity and encoding-time.
Velocity autocorrelation model
The particle dynamics in a flowing fluid can be described using a velocity autocorrelation function (VACF)9. Expressing the phase for a particle j in terms of dephasing factor q(t) and velocity υ(t) gives$$\phi_j = -\int_{0}^{TE}q(t)\nu(t)\:dt\;\;\;\;\;\;\;\;\;\;\;\;(2)$$and$$\langle\phi_j^2\rangle = \int_{0}^{TE}\int_{0}^{TE}q(t)q(t')\langle\pmb{\nu}(t)\cdot\pmb{\nu}(t')\rangle\:dt' \:dt \;\;\;\;\;\;\;\;\;\;\;\;(3)$$where TE is the echo time, $$$<>$$$ denote an ensemble average and$$$\langle\pmb{\nu}(t)\cdot\pmb{\nu}(t')\rangle$$$is the VACF. Assuming Gaussian phase distribution with zero mean and variance$$$\langle\phi_j^2\rangle$$$, the signal attenuation of a flowing fluid can be expressed as$$F_\text{P} = \text{exp} \left(-\langle\phi_j^2\rangle/2\right). \;\;\;\;\;\;\;\;\;\;\;\; (4)$$
Methods
Pulse sequence
The pulse sequence used in this study employ flow-compensated and non-flow-compensated double diffusion-encoding(DDE) gradients (Fig.1). The encoding-time(T) was varied by adjusting the duration between the end of the first bipolar gradient and the beginning of the second, while keeping TE constant. Inverting the polarity of the second bipolar gradient enabled/disabled flow-compensation10.Intermediate model
To model the perfusion signal (FP) in this study, we use an exponential VACF11,$$\langle\pmb{\nu}(t)\cdot\pmb{\nu}(t')\rangle = \frac{\langle\overline{\nu}^2\rangle}{3}exp\left(\frac{\lvert t-t'\rvert}{\tau}\right)\;\;\;\;\;\;\;\;\;\;\;\;(5)$$where$$$\langle\overline{\nu}^2\rangle$$$is the average mean squared velocity and τ is the average time required for a particle to change direction. Computing Equation 3-5 for the pulse sequence illustrated in Figure 1, yields$$F_\text{P} = \text{exp}\left(-\gamma^{2}G^{2}\langle\overline{\nu}^2\rangle \frac{\tau}{3}\left[ \tau^{3} (\Pi+\Omega)-4\delta\tau^2+2\delta^2\left(\Delta-\frac{\delta}{3}\right) \right] \right)\;\;\;\;\;\;\;\;\;\;\;\;(6a)$$with$$\Pi = 2 \text{exp}\left(-\frac{\Delta+\delta}{\tau}\right)\left(\text{exp}\left(\frac{\delta}{\tau}\right)-1\right)\left(2\text{exp}\left(\frac{\Delta}{\tau}\right)+\text{exp}\left(\frac{\delta}{\tau}\right)-1\right)\;\;\;\;\;\;\;\;\;\;\;\;(6b)$$and$$\Omega = k\left[\left( \text{exp}\left(\frac{\Delta}{\tau}\right)-1\right)^2\left( \text{exp}\left(\frac{\delta}{\tau}\right)-1\right)^2\text{exp}\left(-\frac{T}{\tau}\right)\right]\;\;\;\;\;\;\;\;\;\;\;\;(6c)$$where 𝑘=1 for NC and −1 for FC.In vivo imaging protocol
10 healthy volunteers (age 27±7 years, 5/5 male/female) were scanned on a 3T Philips MR7700 using a 32-channel head coil. The study was approved by the Swedish ethical review authority(refno2020-00029).Diffusion-weighted images were acquired using software allowing arbitrary diffusion gradient waveforms. Common imaging parameters: TE=180 ms, TR=3700 ms, b=0,5,10,20,100,200 s/mm2, six diffusion-encoding directions (sides of a cube), encoding-time T=50,65,80,100 ms, 17 slices and voxel size 2×2×4 mm3.
Preprocessing and analysis
The diffusion-weighted images were corrected for susceptibility- and eddy current-induced distortions using FSL12. The data was segmented into white matter (wm), cortical and deep gray matter (cgm/dgm) using FSL tools FAST13 and FIRST14.IVIM parameter maps for D,f,ν and τ were reconstructed by Bayesian model fitting of Equation 1 and 615, using local spatial regularization and Db=1.75 μm2/ms10.
Results
The presented model reveals a contrast between different velocities and correlation times, especially for high velocities(>1 mm/s) and short correlation times(>50 ms) relative to the studied encoding-times (Fig.2). Parameter maps show the model fitting was contingent on spatial regularization when estimating ν and τ (Fig.3). Mean velocity in wm,cgm,dgm was estimated to 1.7,1,7 and 1.8 mm/s, respectively. Mean correlation time was 248,250,244 ms, respectively (Fig.4). This is reasonably similar to literature where ν and τ was estimated to 4.6 mm/s and 144 ms, respectively, in liver7. In cat brain ν was suggested to be 2.1 mm/s4.Discussion and Conclusion
The present study proposes a model for intermediate flow regime in flow-compensated IVIM MRI and present initial proof-of-concept separate quantification of blood velocity and correlation time in brain. Future work should validate the model, e.g., by simulations. Optimization of imaging protocols is also important for future development as results show that separate quantification put high demand on data quality.Acknowledgements
The study was financed by grants from the Assar Gabrielsson Foundation, the Sahlgrenska University Hospital Research Fund, the Royal Society of Arts and Sciences in Gothenburg (KVVS), grants from the Swedish Cancer Society, the King Gustav V Jubilee Clinic Cancer Research Foundation and Lion's Cancer Research Fund of Western Sweden, and the Swedish state under the agreement between the Swedish government and the county councils, the ALF-agreement. The authors thank Philips Clinical Science Group for support.References
| 1. Hilario A, Sepulveda JM, Perez-Nuñez A, et al. A Prognostic Model Based on Preoperative MRI Predicts Overall Survival in Patients with Diffuse Gliomas. American Journal of Neuroradiology 2014;35(6):1096. 2. Law M, Young RJ, Babb JS, et al. Gliomas: Predicting Time to Progression or Survival with Cerebral Blood Volume Measurements at Dynamic Susceptibility-weighted Contrast-enhanced Perfusion MR Imaging. Radiology 2008;247(2):490–498. 3. Law M, Yang S, Wang H, et al. Glioma Grading: Sensitivity, Specificity, and Predictive Values of Perfusion MR Imaging and Proton MR Spectroscopic Imaging Compared with Conventional MR Imaging. American Journal of Neuroradiology 2003;24(10):1989. 4. Le Bihan D, Breton E, Lallemand D, et al. Separation of diffusion and perfusion in intravoxel incoherent motion MR imaging. Radiology 1988;168(2):497–505. 5. Federau C, Meuli R, O’Brien K, et al. Perfusion measurement in brain gliomas with intravoxel incoherent motion MRI. American Journal of Neuroradiology 2014;35(2):256–262. 6. Federau C, Cerny M, Roux M, et al. IVIM perfusion fraction is prognostic for survival in brain glioma. Clin Neuroradiol 2017;27(4):485–492. 7. Wetscherek A, Stieltjes B, Laun FB. Flow-compensated intravoxel incoherent motion diffusion imaging. Magn Reson Med 2015;74(2):410–419. 8. Louise Rosenqvist, MM, OJ. Time-dependence of perfusion fraction with flow-compensated intravoxel incoherent motion MRI in the brain. In: ISMRM Annual meeting. ; 2023. p. 5178. 9. Gore JC. Turbulent Flow Effects on NMR Imaging: Measurement of Turbulent Intensity. Med Phys 1991;18(5):1045–1051. 10. Ahlgren A, Knutsson L, Wirestam R, et al. Quantification of microcirculatory parameters by joint analysis of flow-compensated and non-flow-compensated intravoxel incoherent motion (IVIM) data. NMR Biomed 2016;29(5):640–649. 11. Kennan RP, Gao JH, Zhong J, et al. A General Model of Microcirculatory Blood Flow Effects in Gradient Sensitized Mri. Med Phys 1994;21(4):539–545. 12. Andersson JLR, Skare S, Ashburner J. How to correct susceptibility distortions in spin-echo echo-planar images: application to diffusion tensor imaging. Neuroimage 2003;20(2):870–888. 13. Zhang Y, Brady M, Smith S. Segmentation of brain MR images through a hidden Markov random field model and the expectation-maximization algorithm. IEEE Trans Med Imaging 2001;20(1):45–57. 14. Patenaude B, Smith SM, Kennedy DN, et al. A Bayesian model of shape and appearance for subcortical brain segmentation. Neuroimage 2011;56(3):907–922. 15. Jalnefjord O. IVIM intermediate regime. https://github.com/oscarjalnefjord/ivim/tree/intermediate_regime. Published 2023. Accessed November 7, 2023.
|
Figures
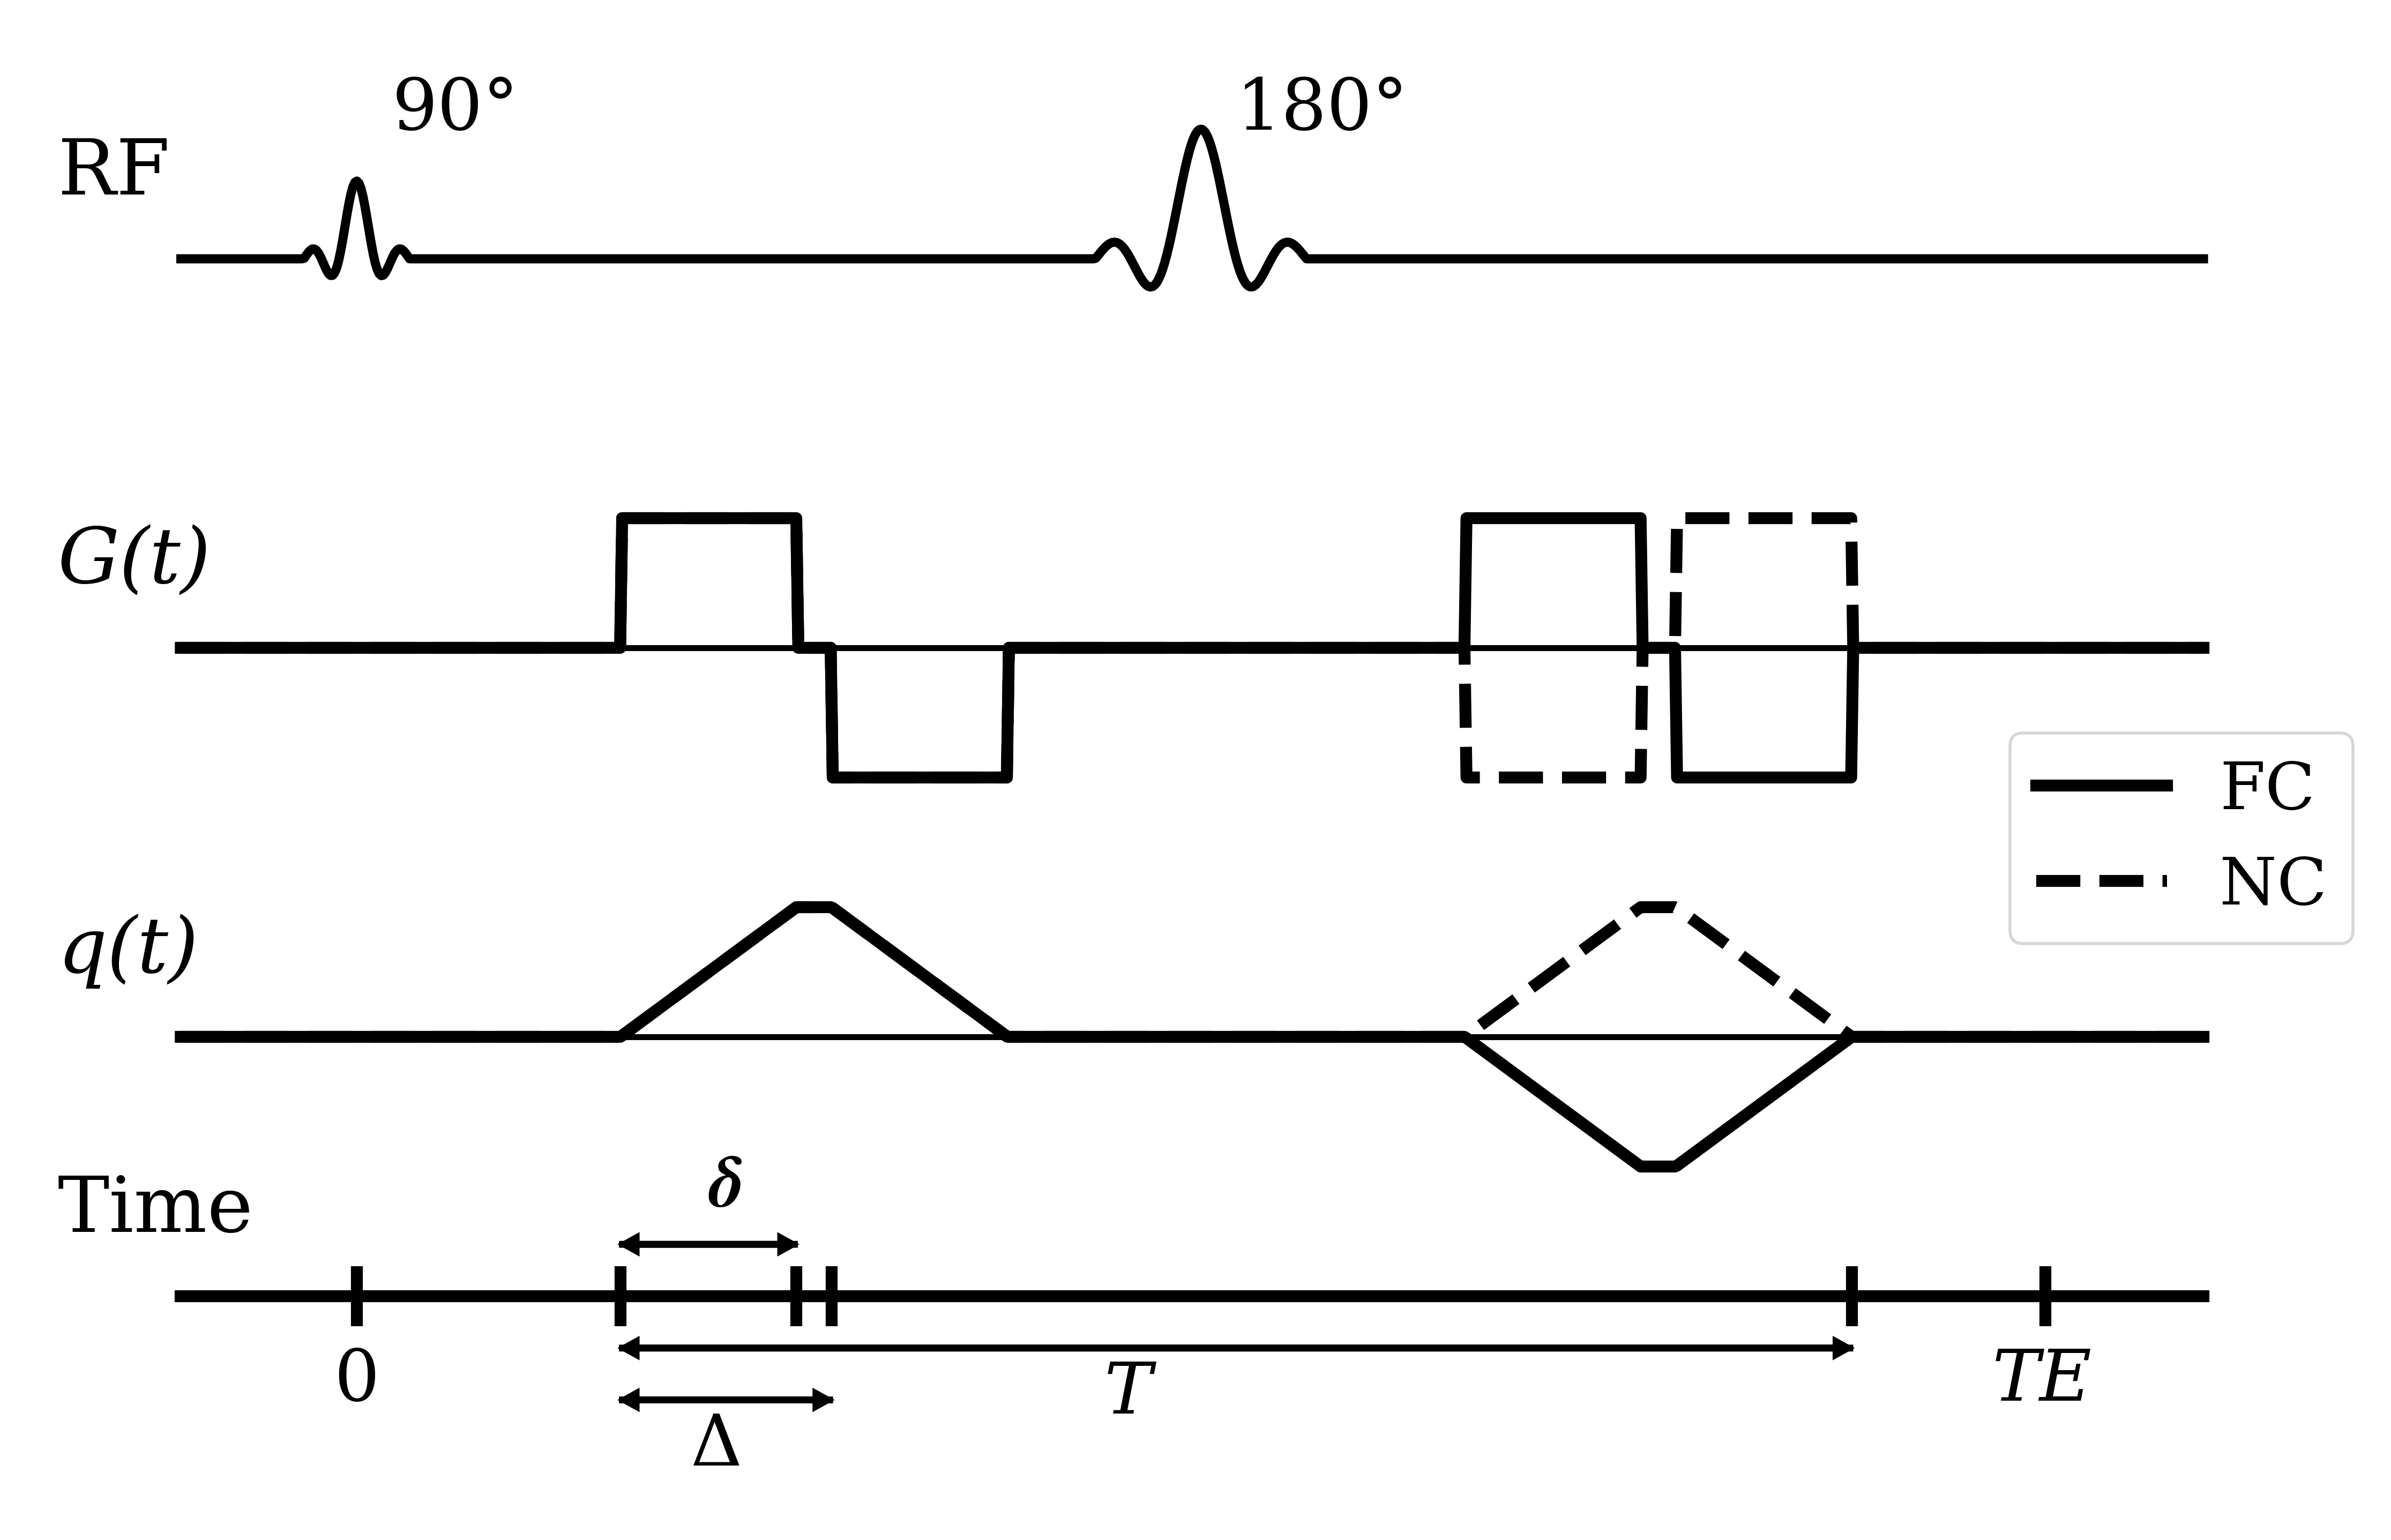
Figure 1. Pulse sequence diagram of the flow-compensated (FC) and non-flow-compensated (NC) DDE pulse sequences, showing the RF pulses, magnetic gradient waveform G(t) and dephasing factor q(t) over time. The duration of each gradient lobe is denoted δ and the duration between the beginning of the first and second gradient lobe within a bipolar gradient is denoted Δ. The encoding-time (T) is defined as the duration between the beginning of the first bipolar gradient and the end of the second bipolar gradient
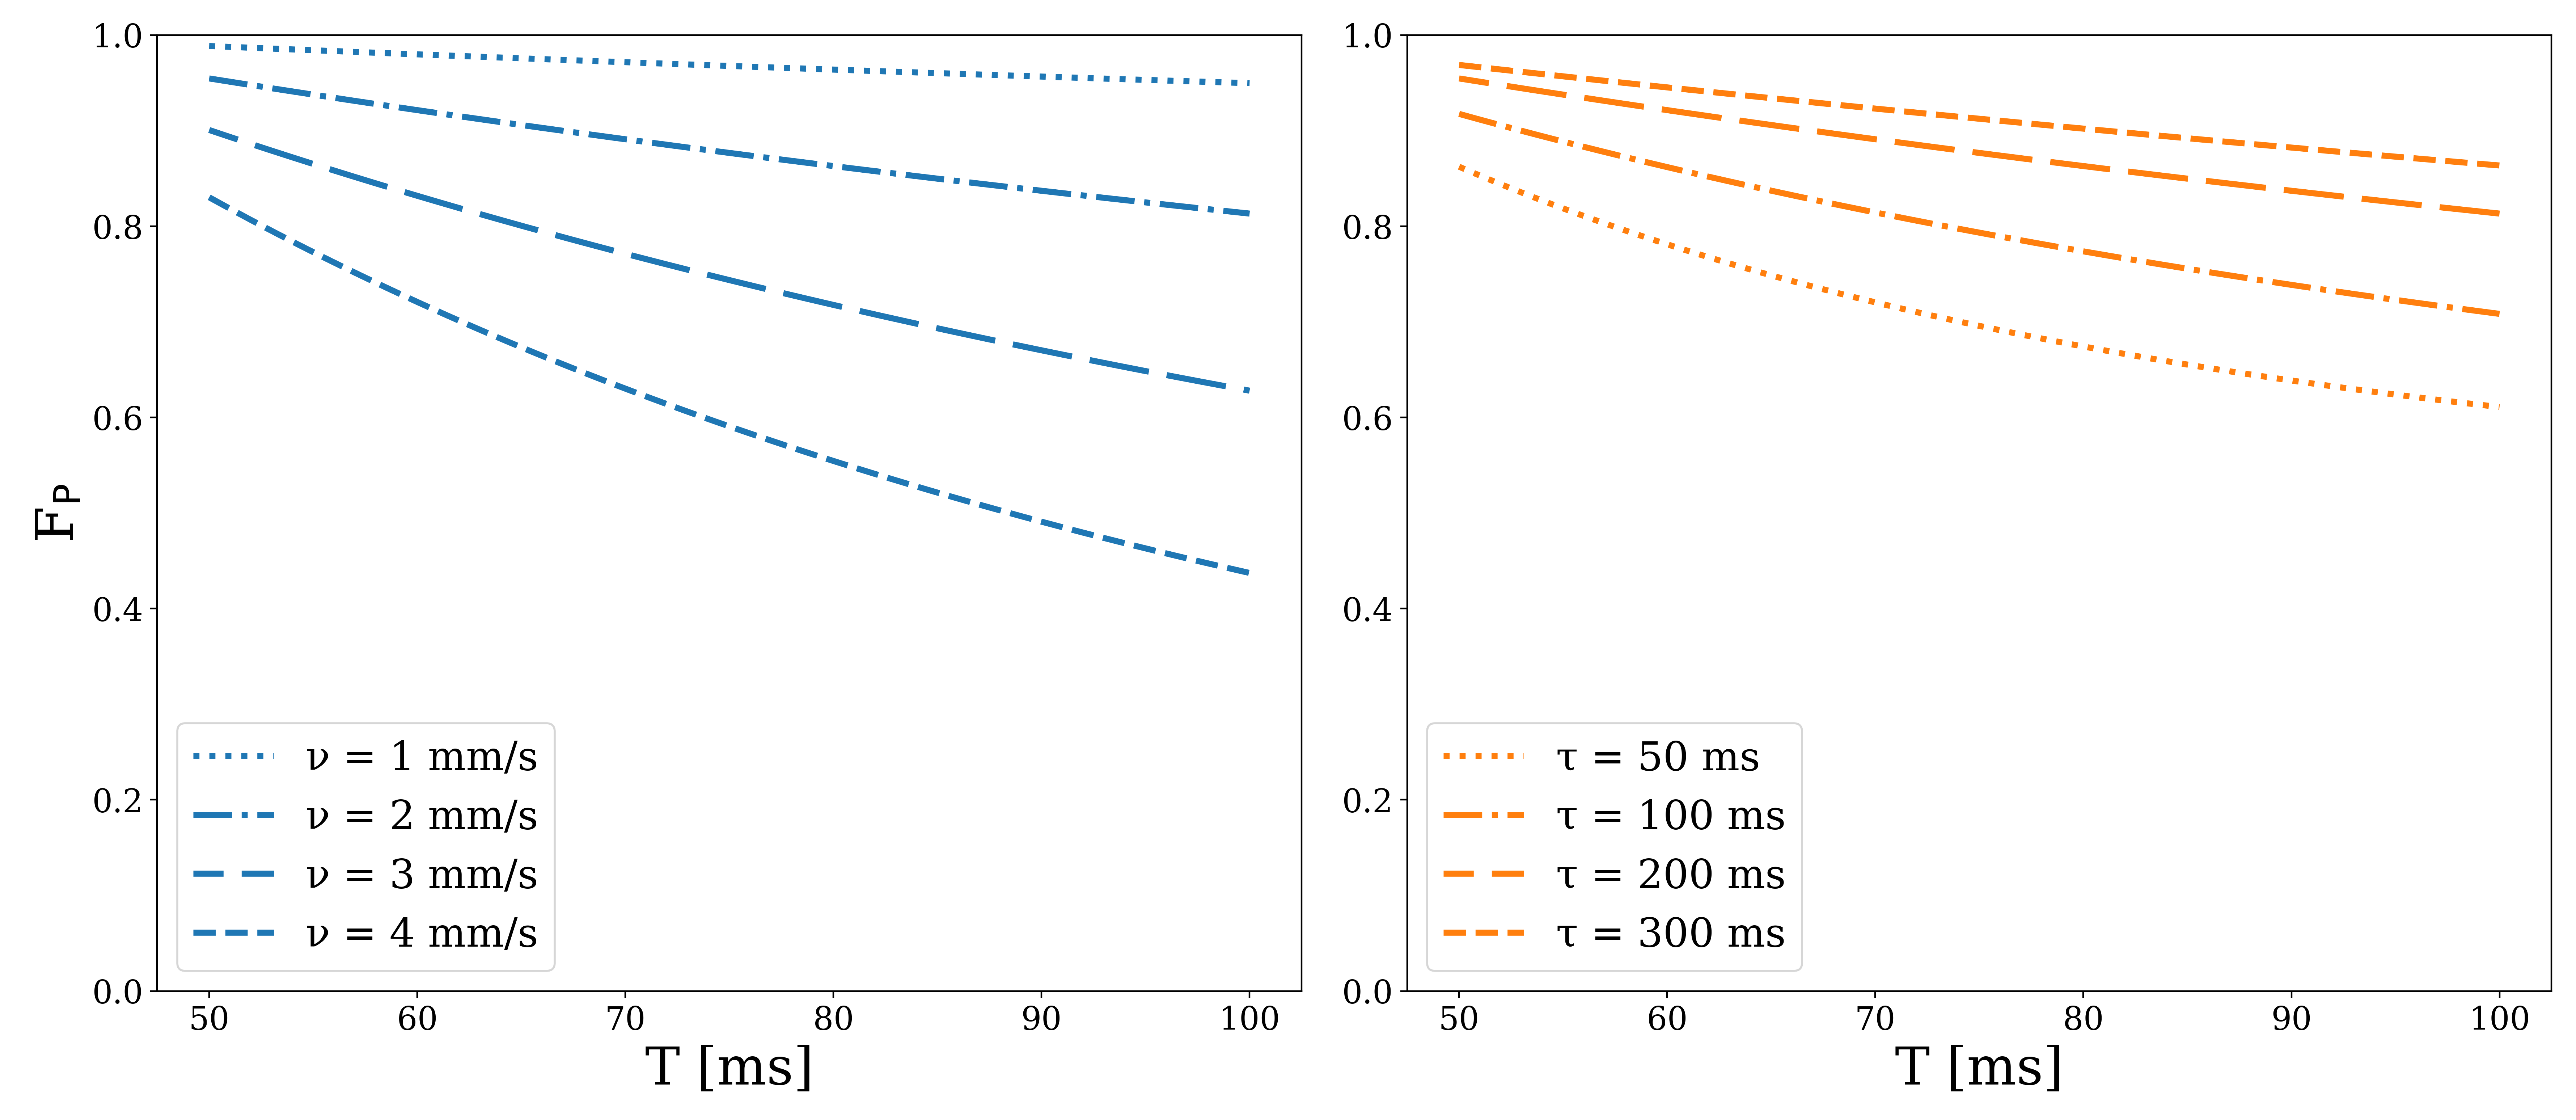
Figure 2: Simulated perfusion signal (FP) vs encoding-time (T) for a DDE pulse sequence with flow-compensation. Comparison of velocities (ν; left) and correlation times (τ; right) using the proposed model (Eq. 1 and 6), with δ=10 ms, Δ=20 ms and b=50 s/mm2. Decreasing velocities and/or increasing correlation times, results in a higher fraction of blood flow attenuation being rephased using flow-compensation. To accurately estimate slow velocities/long correlation times, a wider range of encoding-times beyond those investigated may be necessary
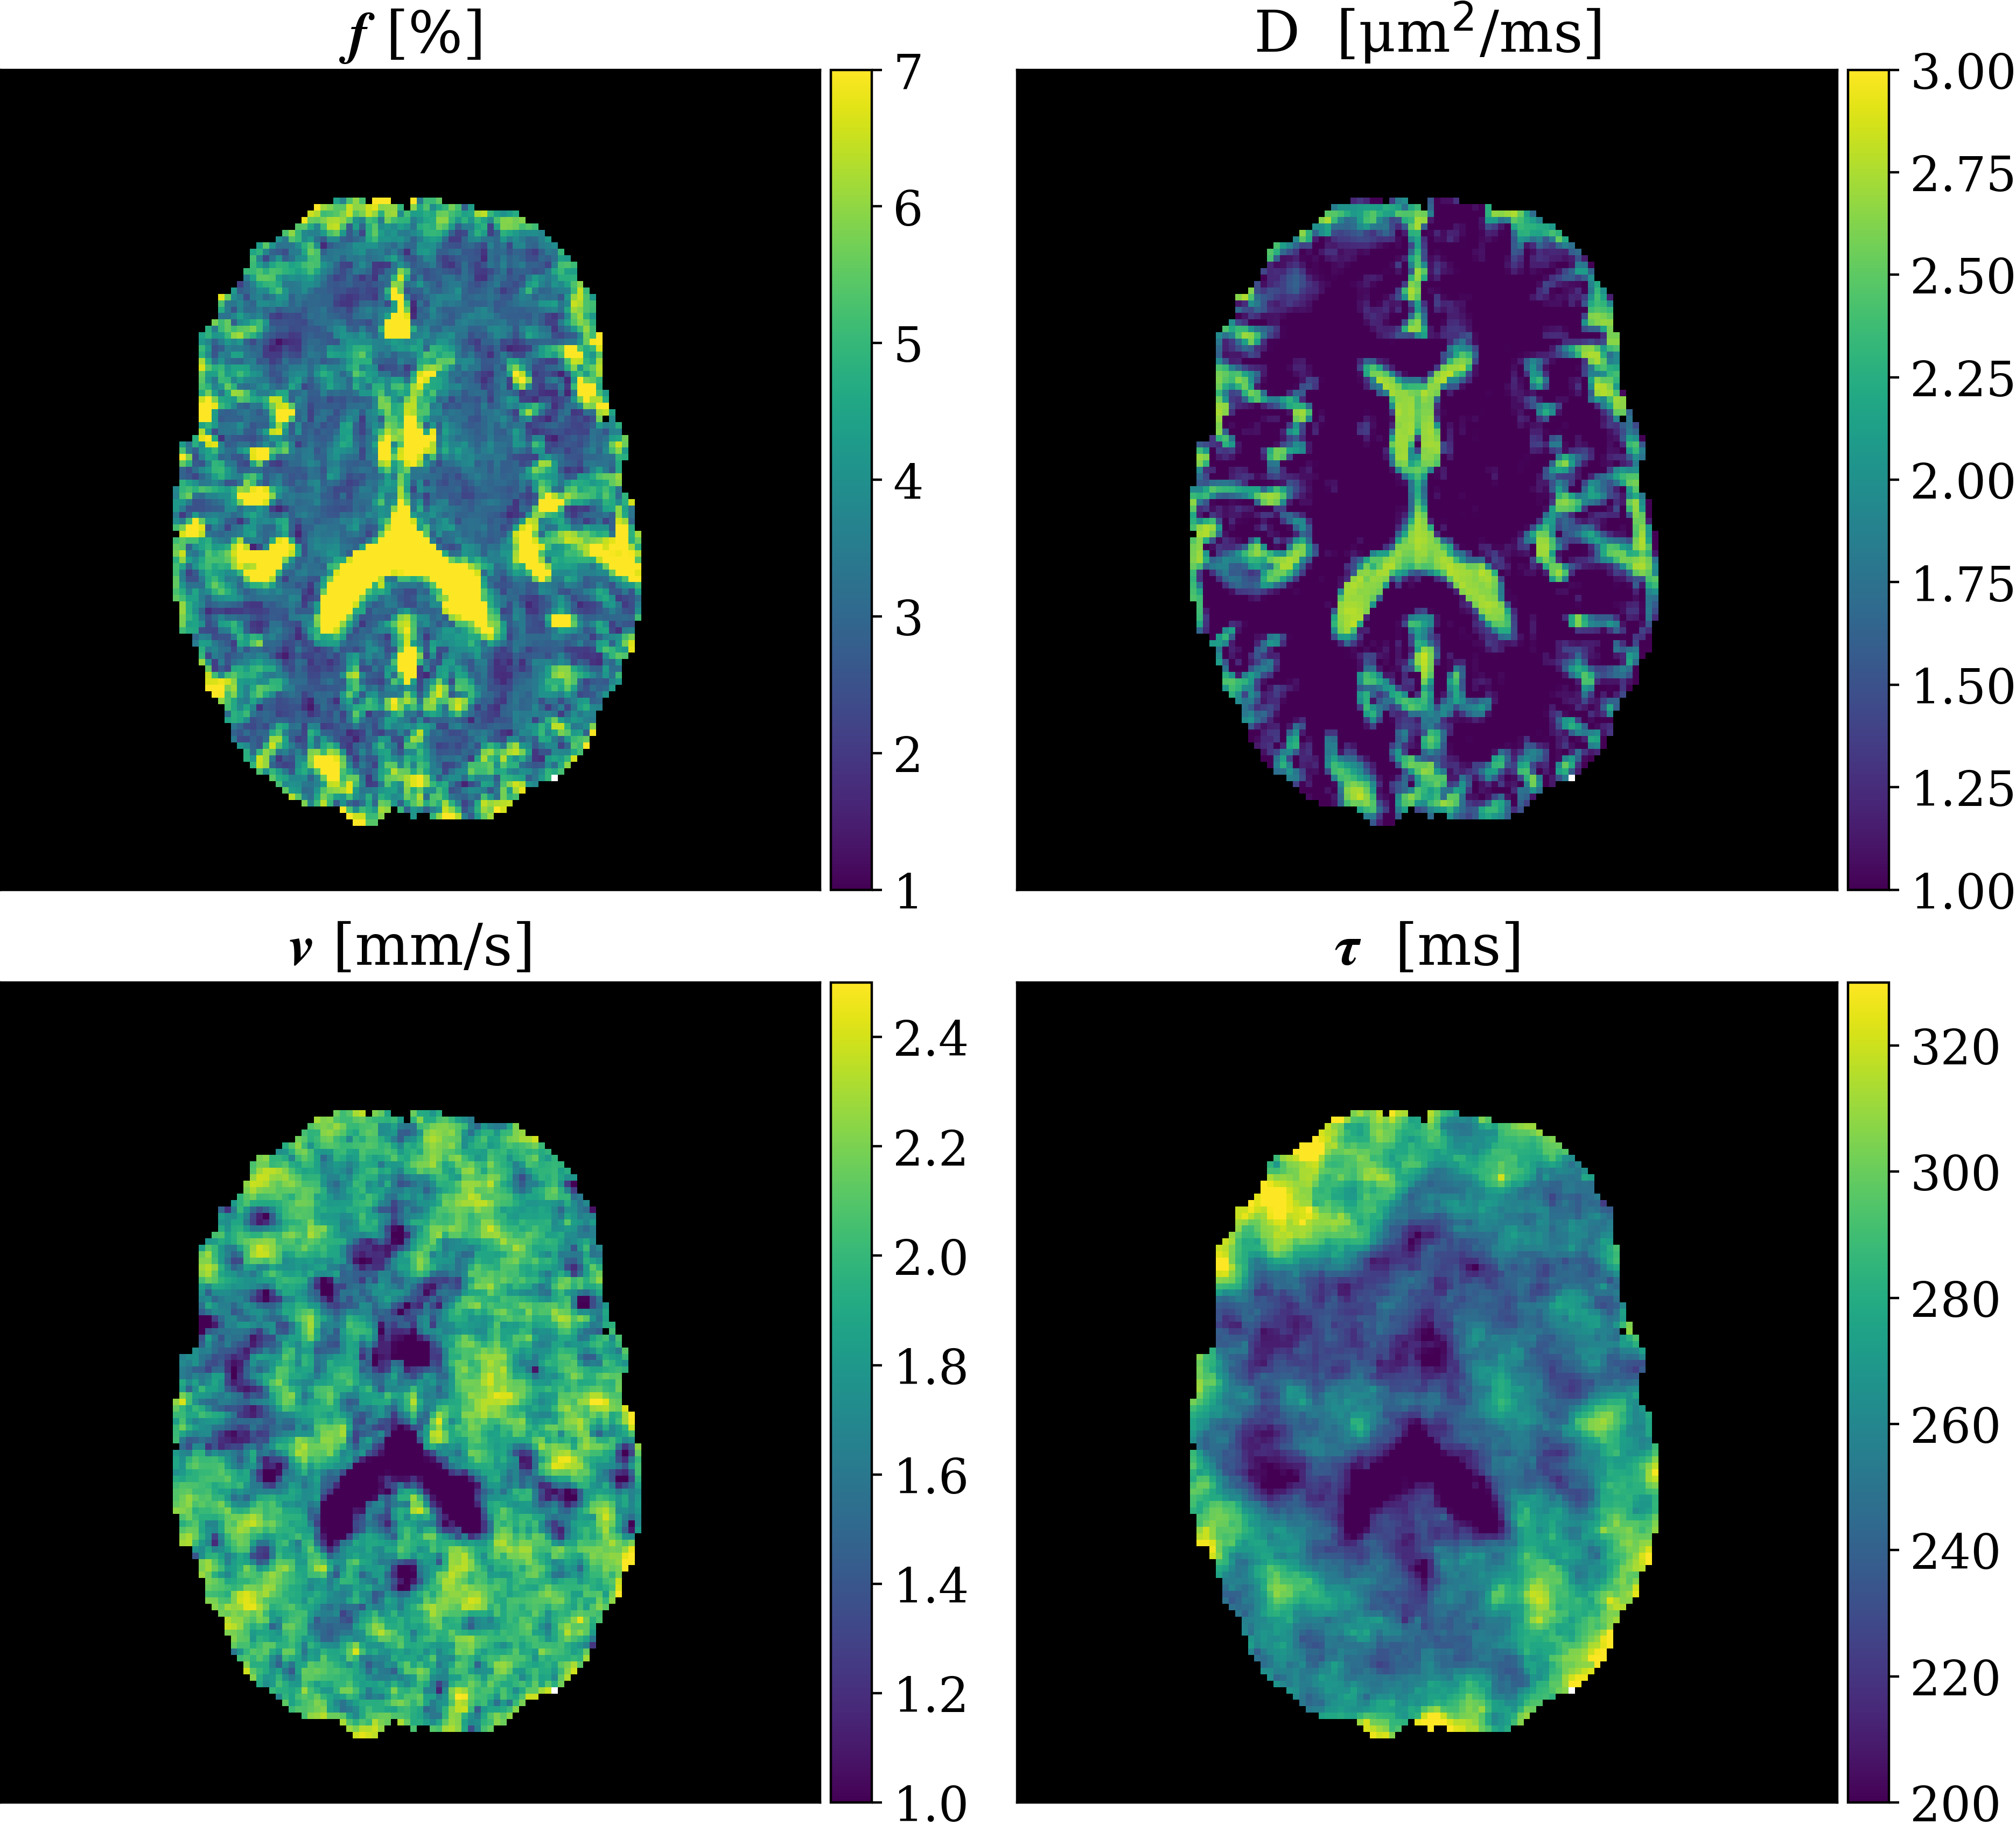
Figure 3: Estimated IVIM parameter maps: perfusion fraction f, tissue diffusion coefficient D, average blood flow velocity ν and correlation time τ. The model performed well in estimating f and D, however, ν and τ are less well-distinguished between tissues using the studied encoding-times
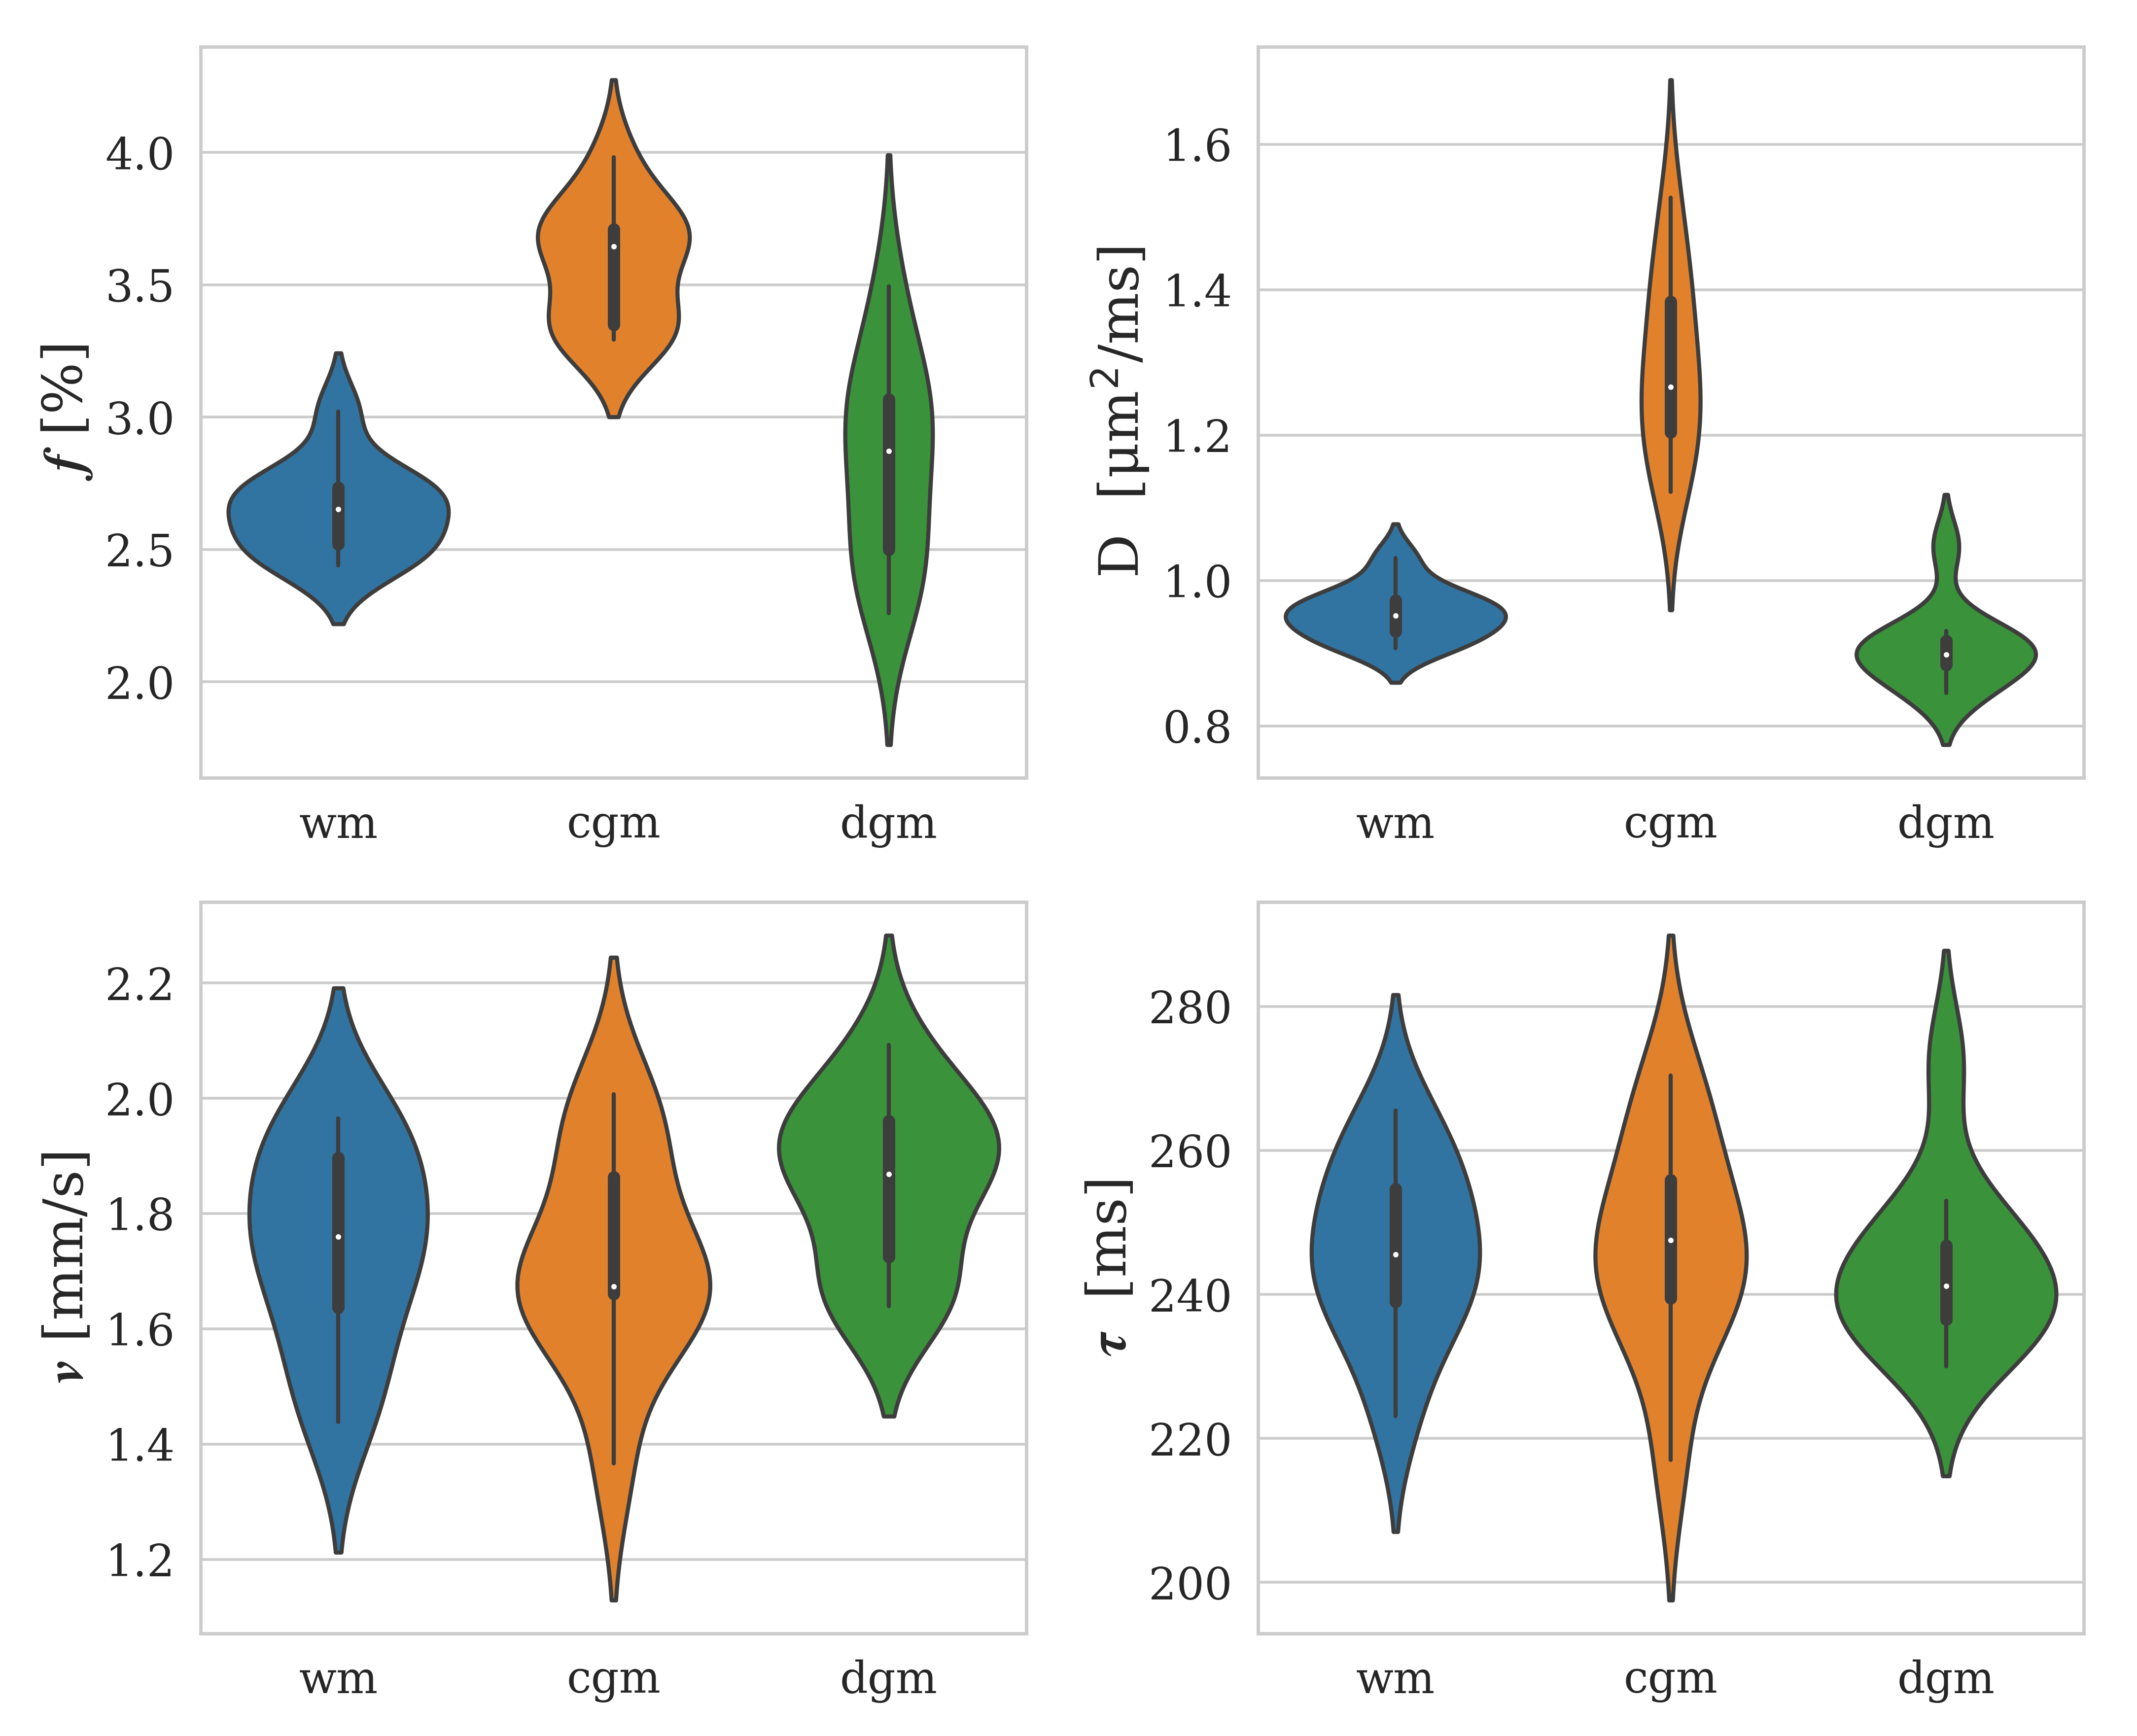
Figure 4: The distribution of estimated IVIM parameters across all 10 subjects. The mean values of perfusion fraction f, tissue diffusion coefficient D, average velocity ν and correlation time τ are displayed for white matter (wm), cortical gray matter (cgm) and deep gray matter (dgm)