0646
Isotropic diffusional kurtosis as a marker of glial cell content and diversification during brain maturation1Medical Biophysics, Western University, London, ON, Canada, 2Robarts Research Institute, London, ON, Canada, 3Anatomy and Cell Biology, Western University, London, ON, Canada
Synopsis
Keywords: Microstructure, Diffusion/other diffusion imaging techniques, Brain Maturation, Tensor-valued diffusion MRI
Motivation: Healthy rodent brain maturation research remains limited, although rodents are a predominant study model, which motivates further study to exclude confounds of developmental changes from pathophysiological interpretations.
Goal(s): Our goals were to investigate how microstructural MRI metrics change over the course of brain maturation and disentangle what changes in these metrics may indicate on a neurobiological level.
Approach: 11 mice were scanned at 9.4T between 3-8 months of age, with histology (n=4) performed at 3 and 8 months.
Results: Total diffusional kurtosis and myelin-specific metrics showed significant increases over time, paired with increased isotropic kurtosis and increased histological oligodendrocyte and astrocyte content.
Impact: This work shows that there are ongoing microstructural changes even after mice are considered “adults”, detectable by isotropic kurtosis. We provide new interpretations of diffusion MRI changes during brain maturation, with evidence of the underlying mechanisms impacting isotropic kurtosis.
Introduction
Most studies consider a steady state condition of adulthood in rodents aged 2-3 months1. However, diffusion MRI (dMRI) and histology rodent studies have demonstrated that myelination continues to increase past 3 months of age1,2. As literature about healthy rodent brain maturation remains sparse, we investigate how tensor-valued dMRI and magnetization transfer (MT) MRI metrics evolve over the course of brain maturation and disentangle what this may indicate on a neurobiological level. Tensor-valued dMRI measures diffusion anisotropy independent of orientation dispersion and distinguishes various sources of kurtosis3–5 and MT MRI provides specificity to myelin content6.Methods
11 C57Bl/6 mice (6 males) were scanned longitudinally at 3, 4, 5, and 8 months of age. Imaging was performed at 9.4T with a 1T/m gradient insert using single-shot EPI with an in-plane resolution of 0.175x0.2mm2, 0.5mm slice thickness. Tensor-valued dMRI was implemented using a single diffusion encoding scheme with linear and spherical tensor encodings at b=2000s/mm2 (30 directions), b=1000s/mm2 (12 directions), and 8 b=0s/mm2. The MT protocol comprised three FLASH-3D scans, including an MTon, MToff, and reference T1-weighted scan. The protocols and preprocessing steps are described in detail in earlier work7–9. Mice were euthanized for histology after the 8-month scan and another cohort of mice (not imaged) was acquired for histology at 3 months. Immunohistochemistry was performed (n=4 for each timepoint) using primary antibodies Olig2, GFAP, and Iba-1 to stain for glial cells: oligodendrocytes (myelinating cells), astrocytes, and microglia, respectively. Metrics investigated include: mean, axial, radial diffusivity (MD, AD, RD); fractional anisotropy (FA); total, isotropic, anisotropic kurtosis (Ktotal, Kiso, Kaniso); microscopic fractional anisotropy (µFA); magnetization transfer ratio and saturation (MTR and MTsat). Ktotal (conventionally reported mean kurtosis) is the summation of Kaniso and Kiso (related to cell size/density heterogeneity)3.Results
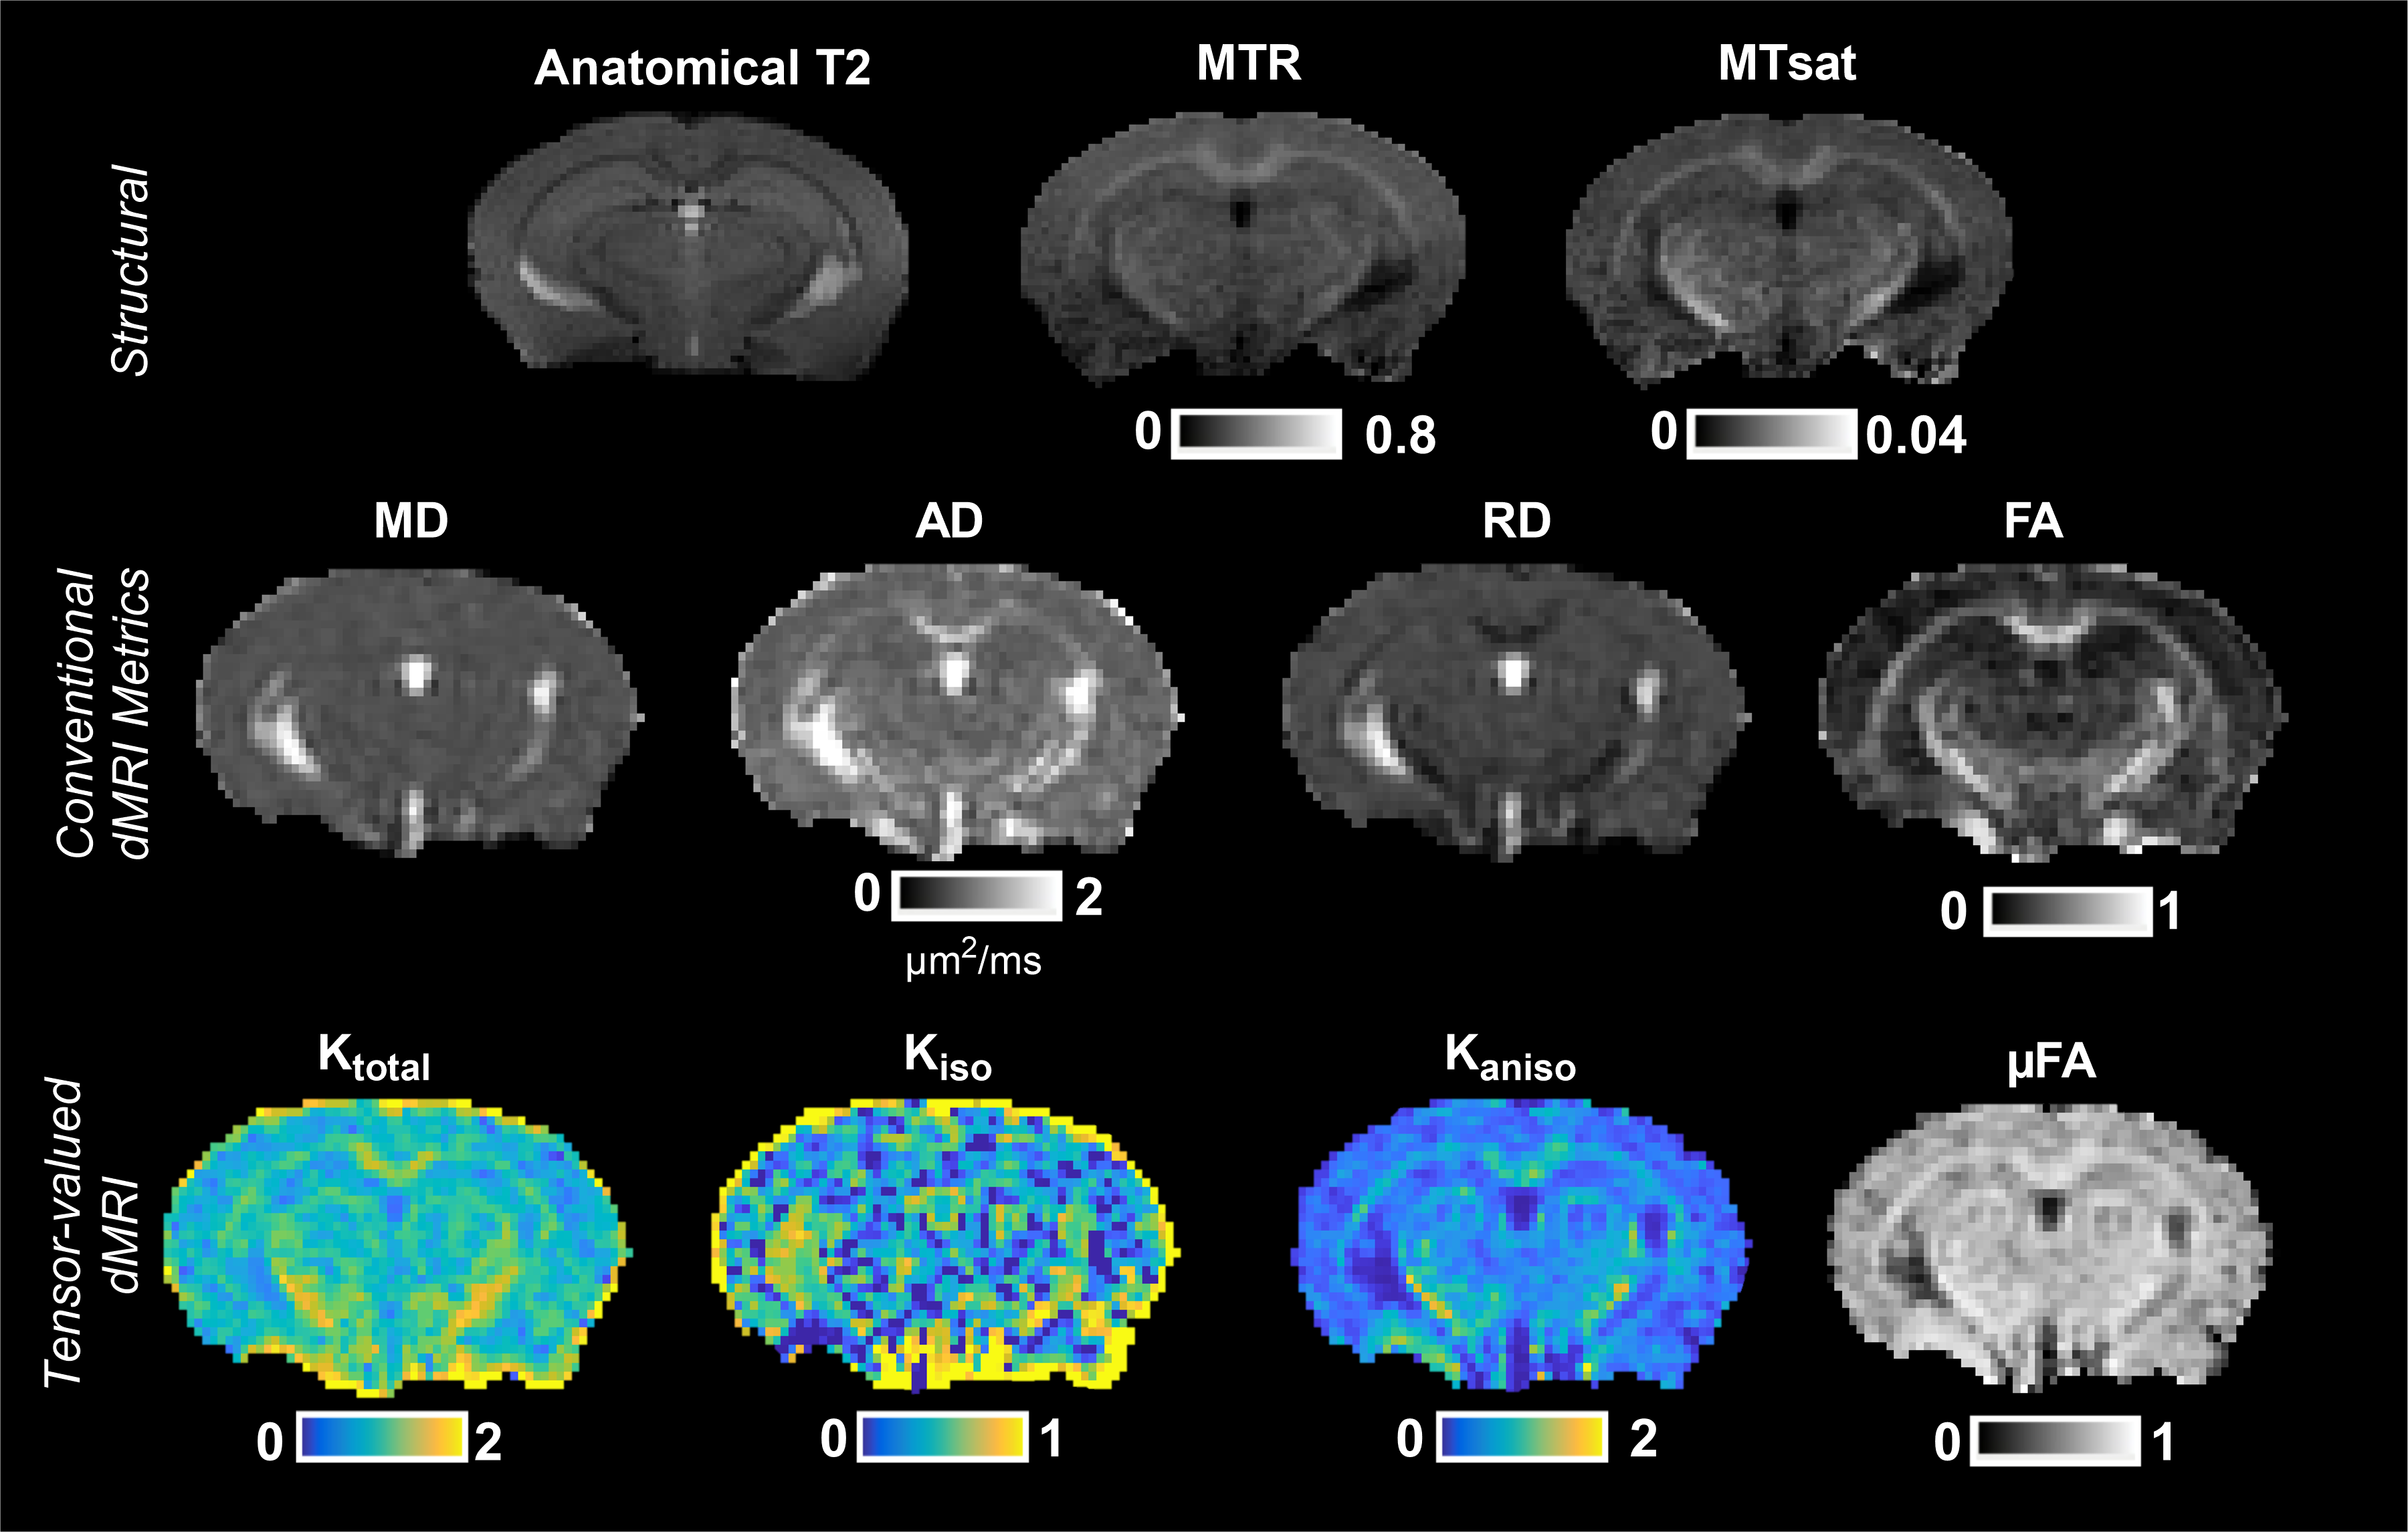
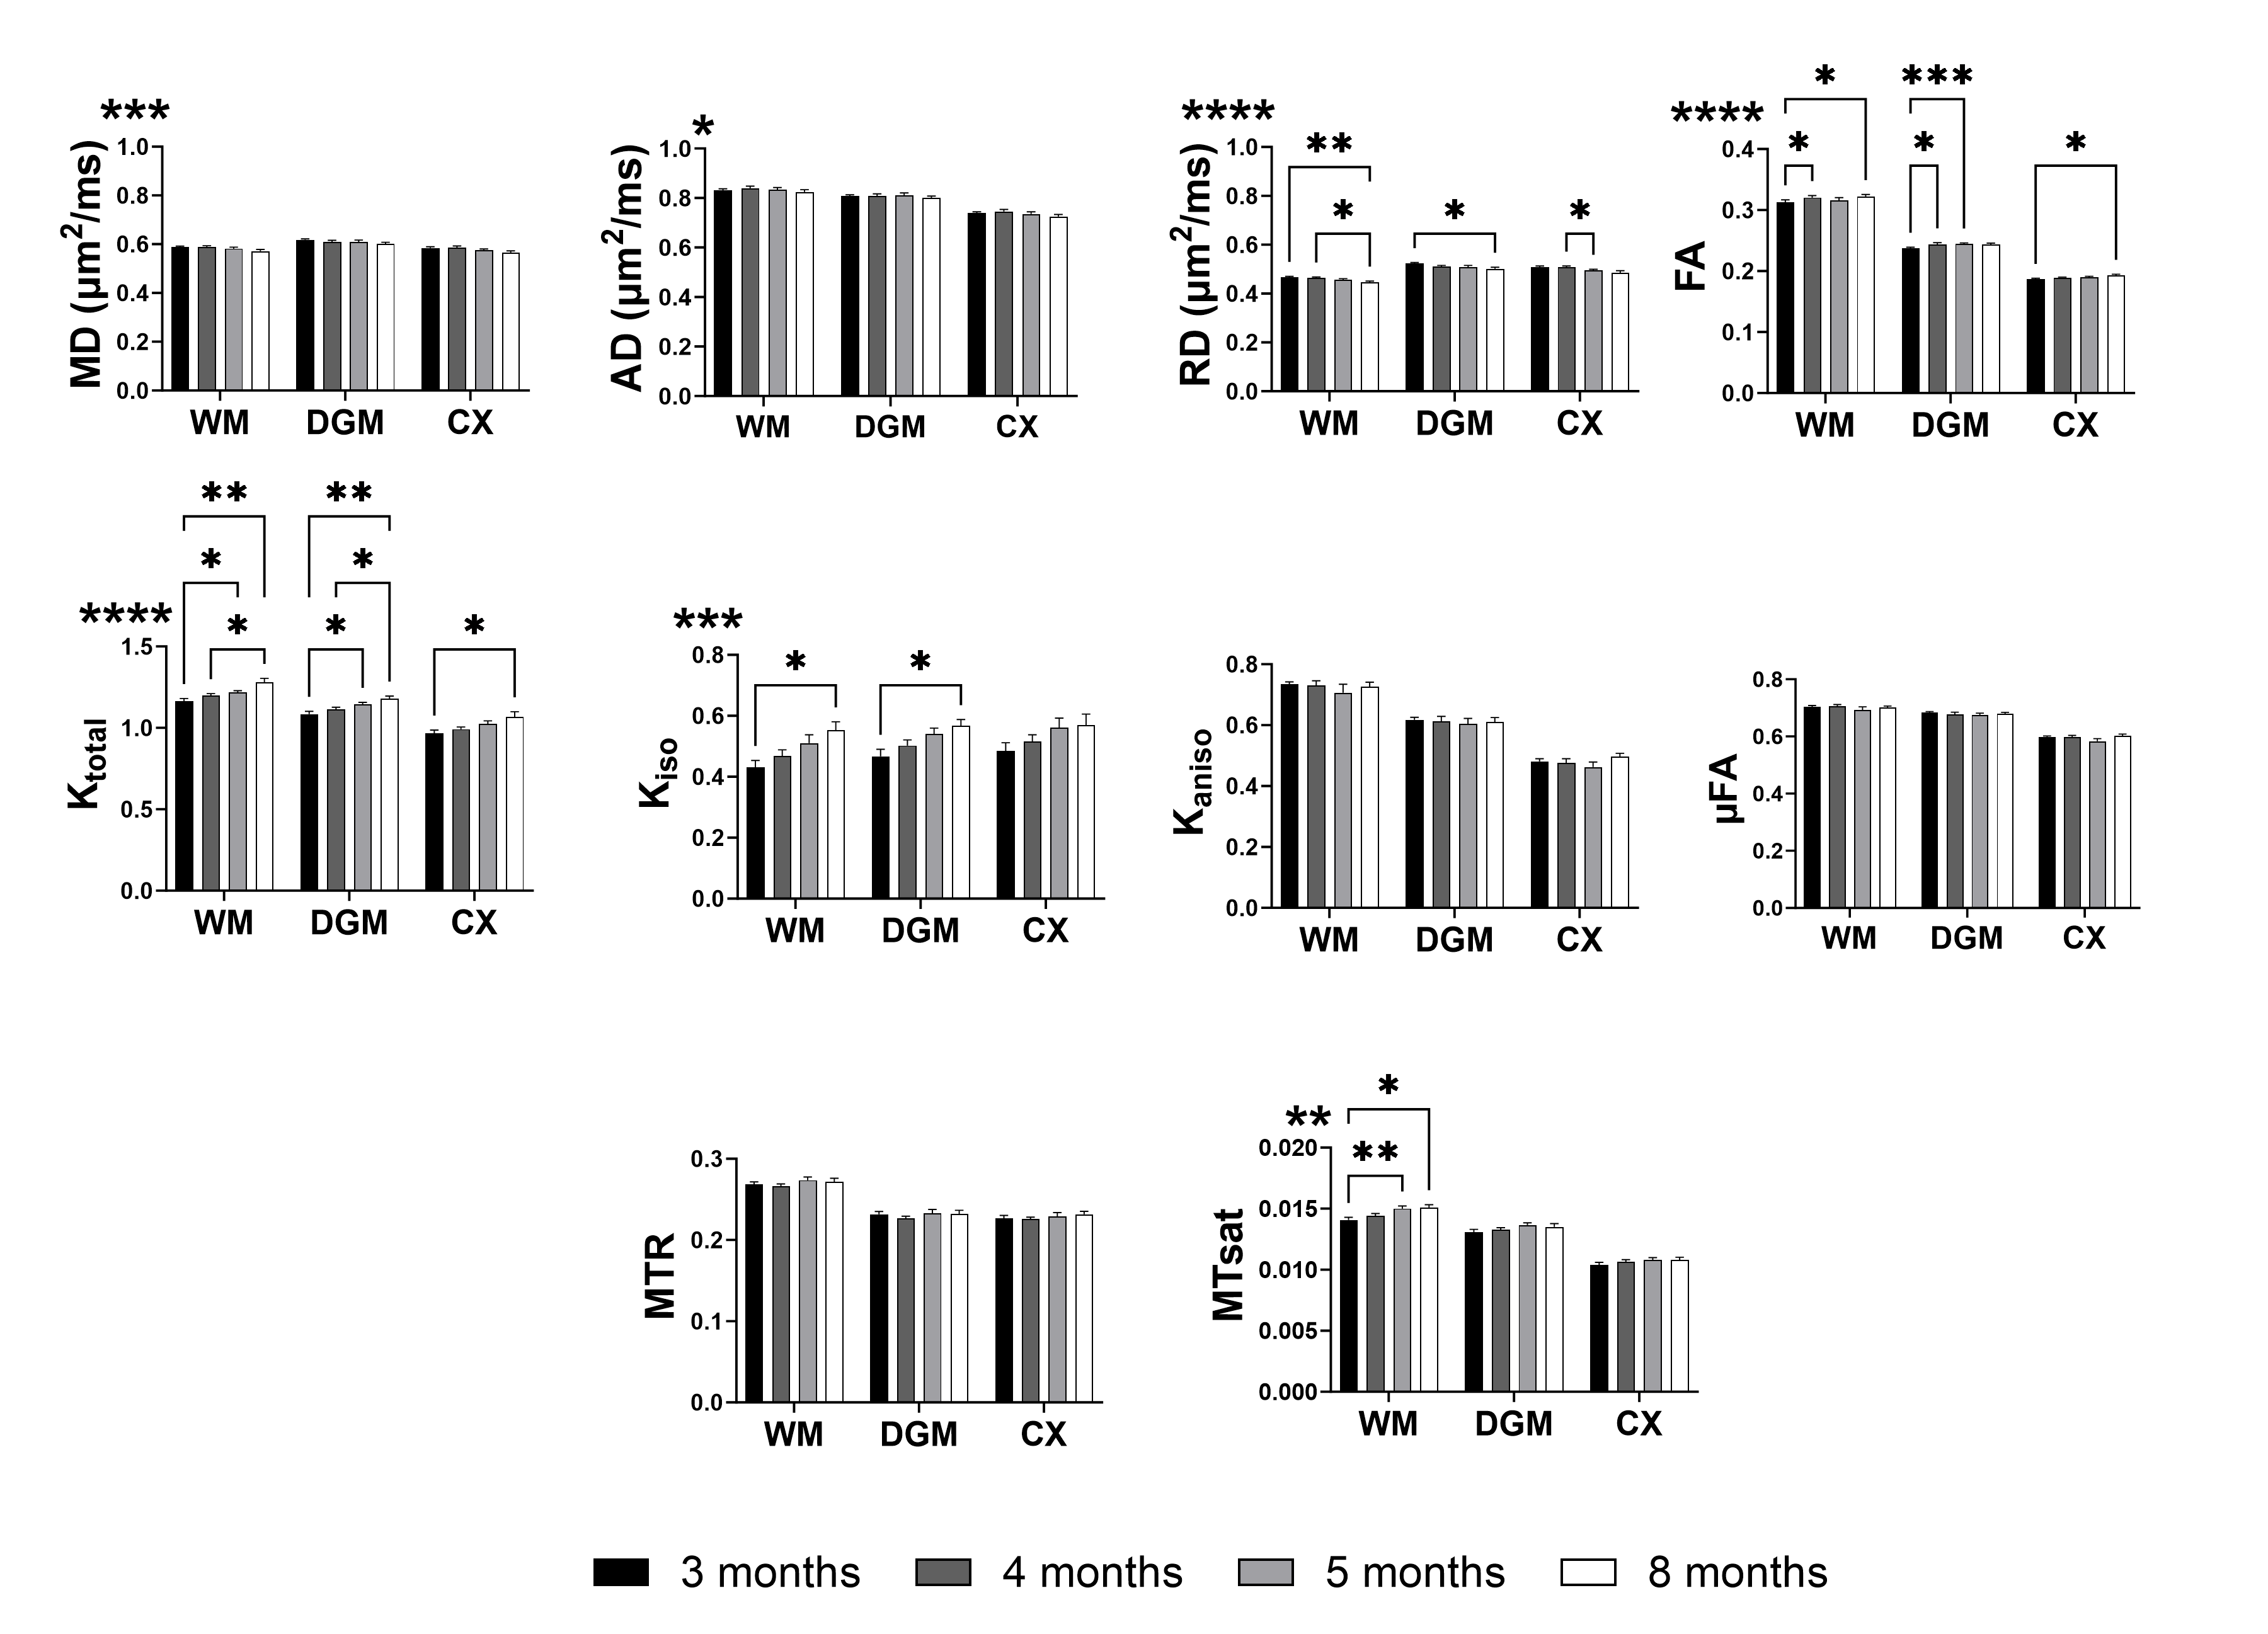
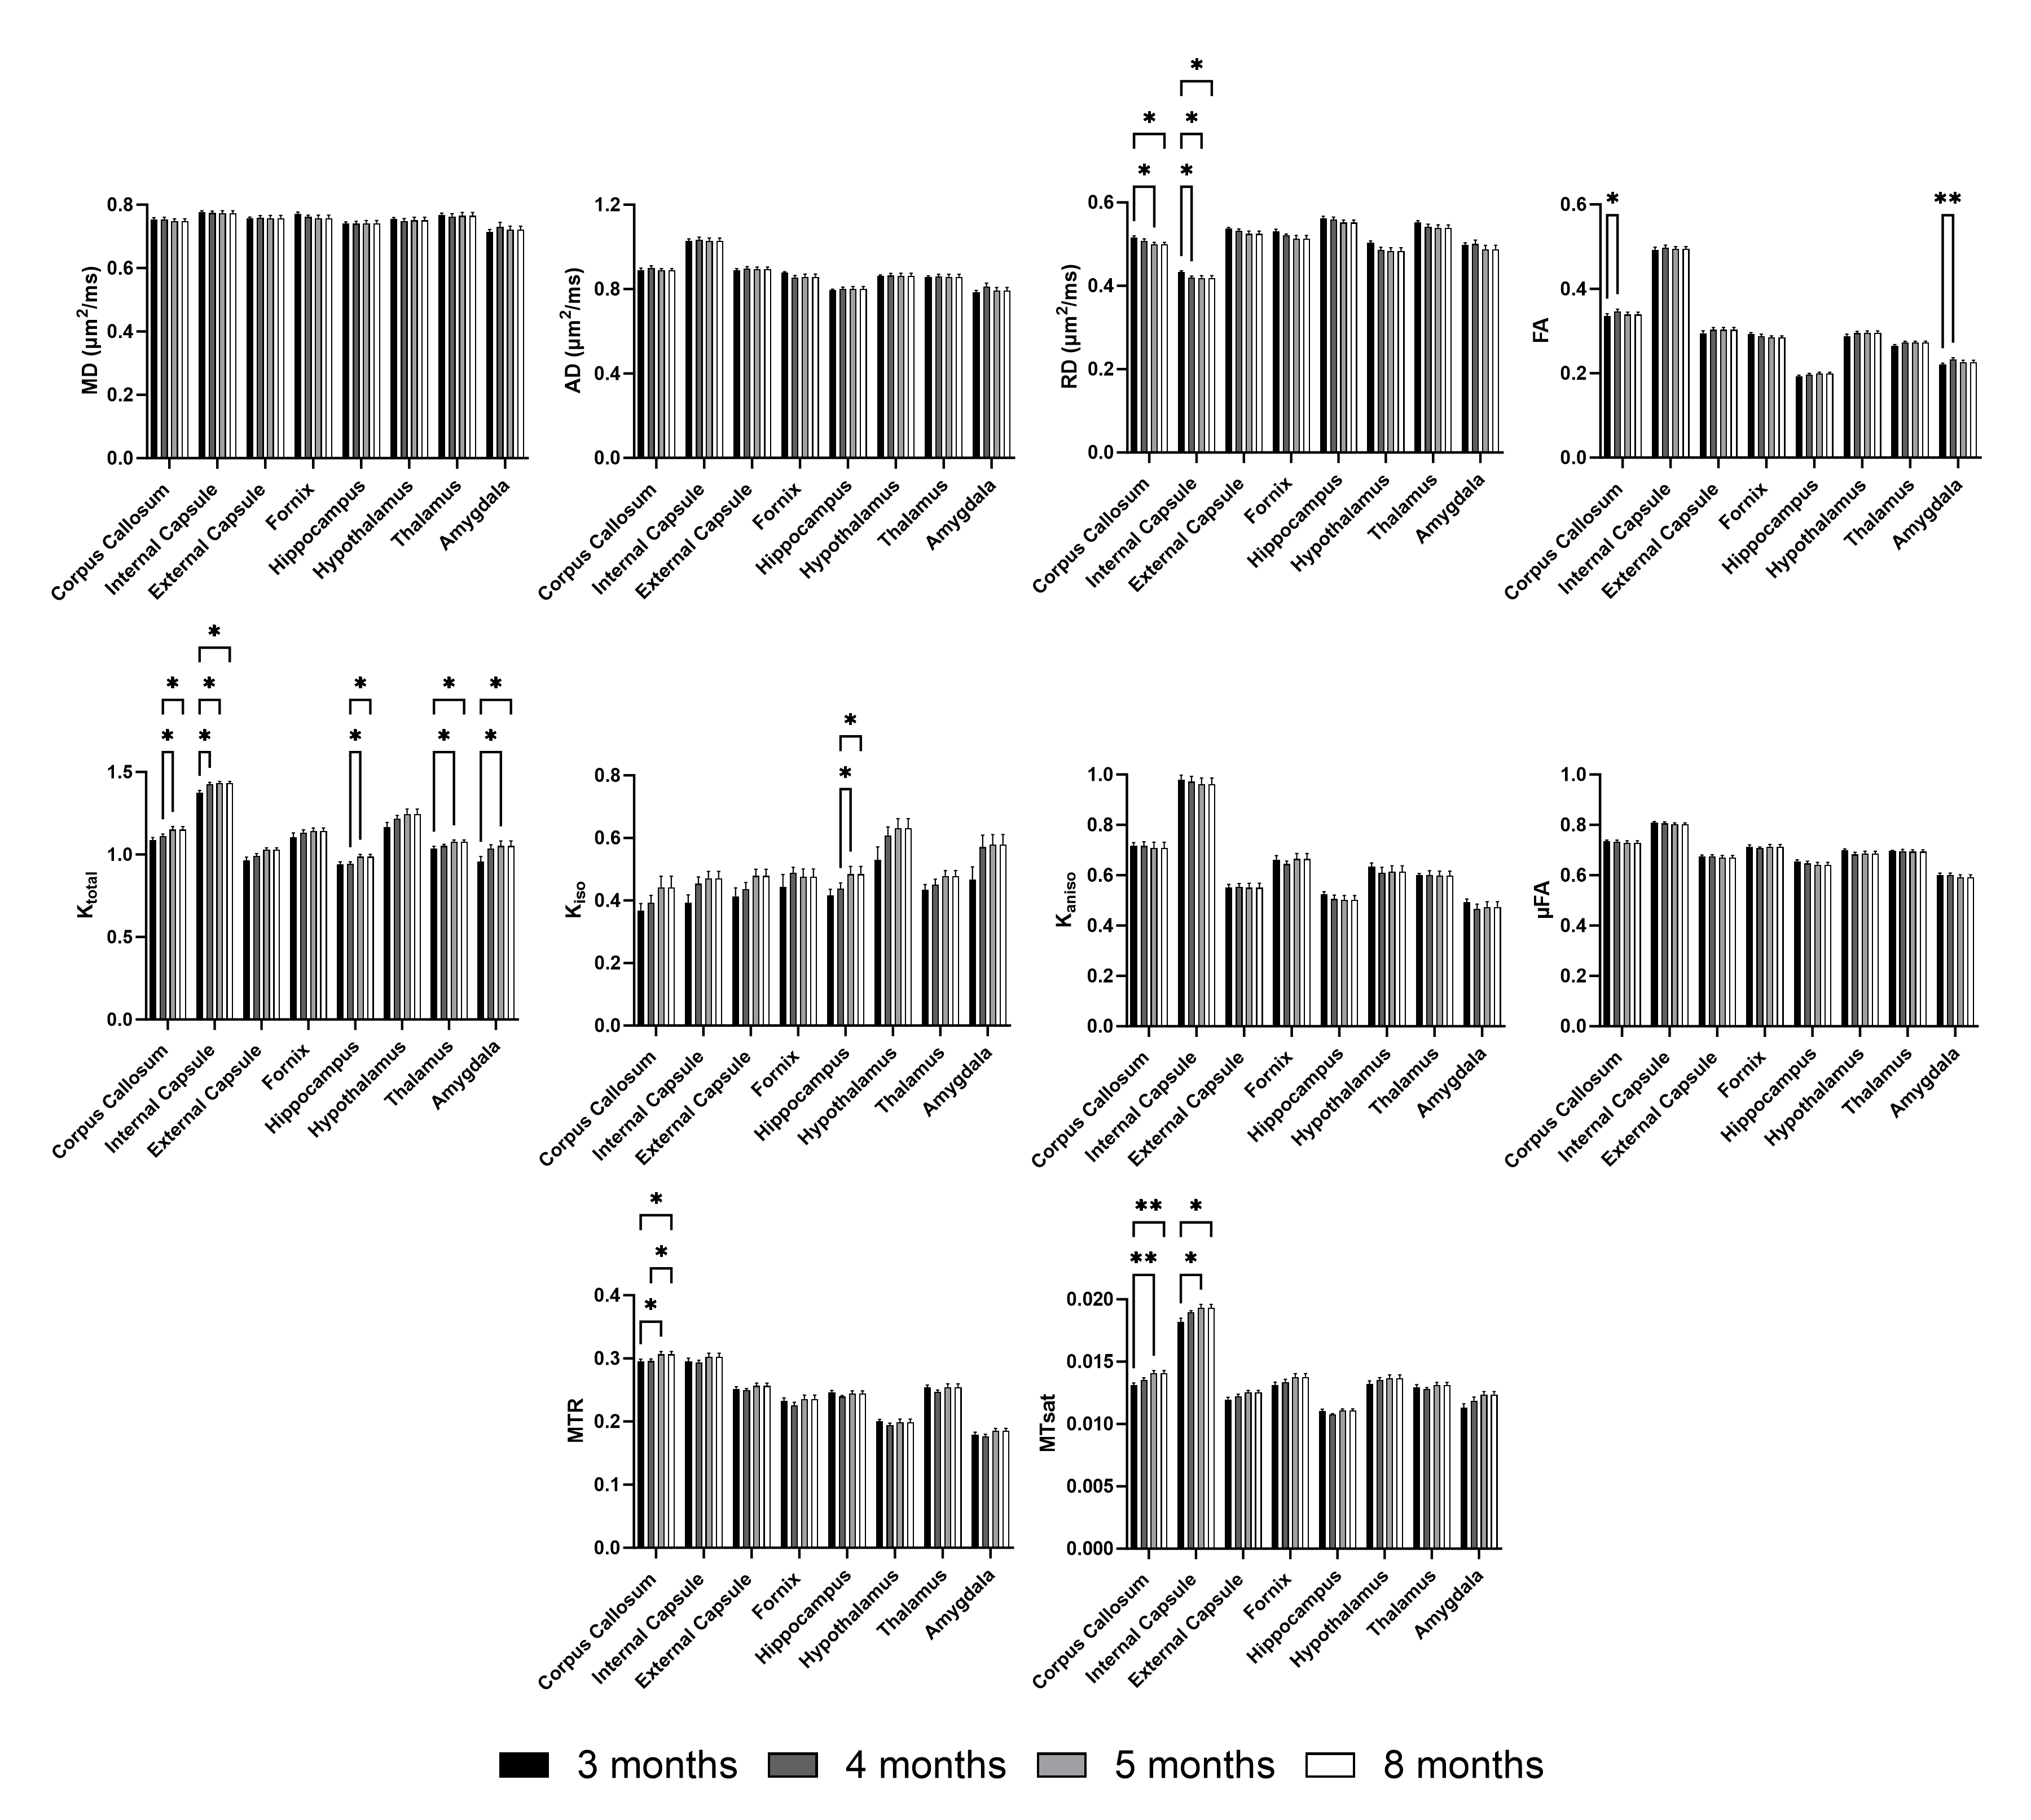
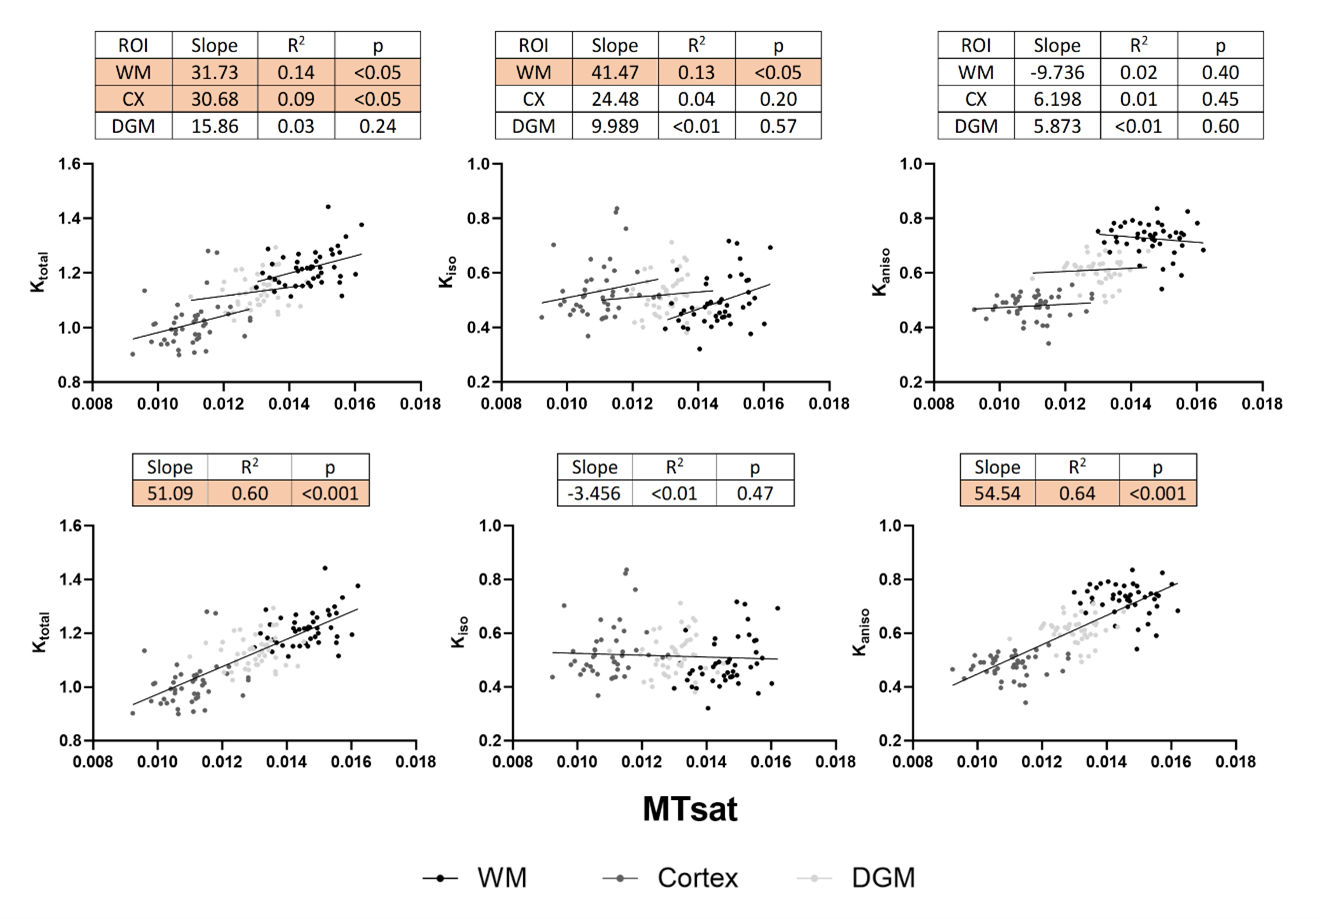
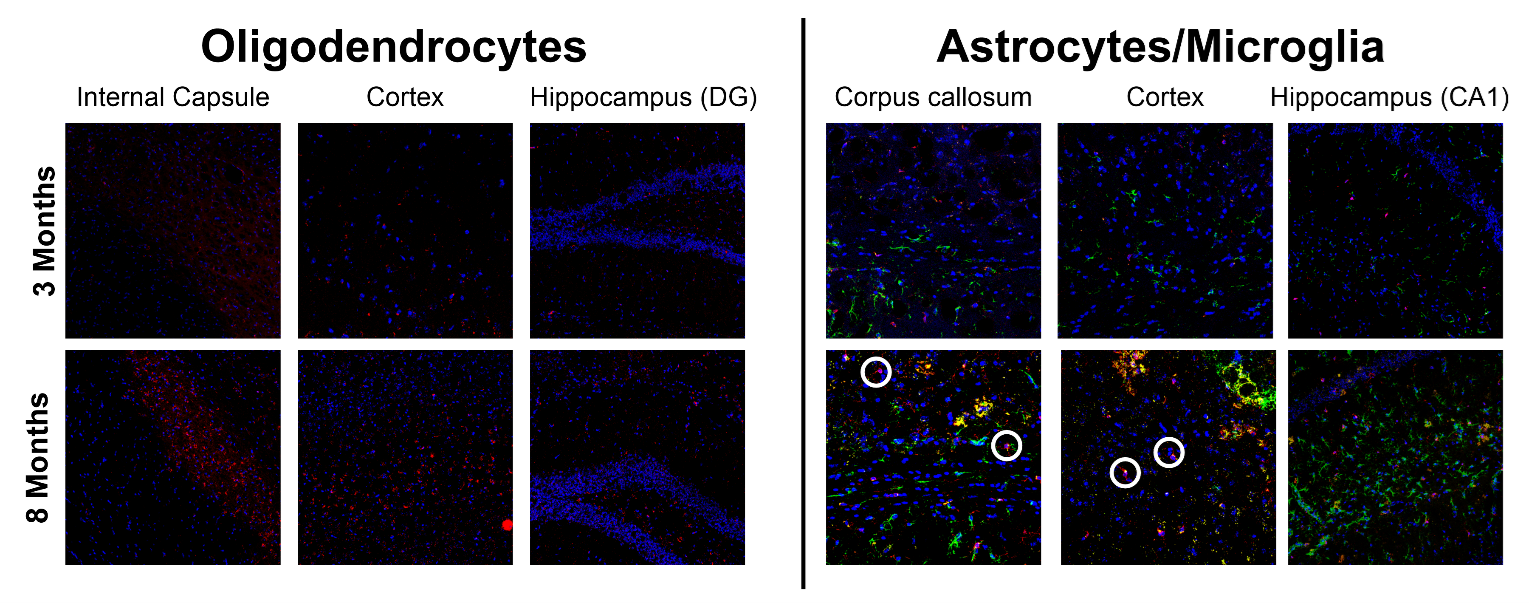
Figure 1 shows representative parameter maps. For global white matter (WM), deep gray matter (DGM), and cortex (CX), the decreases in RD agree with increases in FA (Figure 2). Ktotal shows significant increases, paired with increasing trends of Kiso and MTsat, while Kaniso and µFA (which show similar trends as they are monotonically related) remain stable. The trends are similar for smaller ROIs (Figure 3). As there is a trend of increasing Ktotal, Kiso, and MTsat, Figure 4 explores the relationship of kurtosis metrics with MTsat over time, and between brain regions. Figure 5 shows a marked increase in histological oligodendrocyte content over time in both white and gray matter regions and increased astrocyte content in the hippocampus (CA1). At 8 months of age, activated microglia (amoeboid rather than ramified shapes) are present in the corpus callosum and cortex (shown in white circles).Discussion
MRI Parameter EvolutionSimilar to our results, Hammelrath et al. reported that in most rodent white matter ROIs, FA increased in agreement with increased intensity on myelin staining, and interpreted that the drop in MD and RD with age was due to myelination1. The Ktotal increases are comparable to previous brain maturation studies10–12, which related Ktotal increases to myelination/dense axonal packing in white matter and dendritic architectural modifications in gray matter. However, these interpretations would be expected to coincide with changes in Kaniso (which is specific to fibres while Kiso is not), which was not seen here. In contrast, the Ktotal increases here are paired with increasing MTsat and Kiso.
Relationship of Kurtosis Metrics with MTsat
Figure 4 highlights a key finding in this study, that changes in total kurtosis found over time (in normal brain development) are driven by isotropic kurtosis, while differences in total kurtosis found between brain regions are driven by anisotropic kurtosis. This indicates that while the main differences between white and gray matter regions stem from fiber content/alignment (changing Kaniso), the main differences over time are not related to changes in axonal content. Our results suggest myelination of axons is not a main contributor to µFA and Kaniso.
Kiso as a marker of glial cell content and diversification
Immunohistochemistry shows increased oligodendrocyte and astrocyte content and microglial activation, at 8 months of age compared to 3 months (Figure 5). Increased Kiso may reflect the increased oligodendrocyte content, which is linked to myelin formation, supported by increased MTsat. Kiso may also be sensitive to microglia activation associated with development, and astrocyte cell size and density increasing at different rates in different regions, which would result in diversification of cell morphology13,14. It has previously been hypothesized that increasing Kiso may reflect higher oligodendrocyte content15, and here we provide histological support that changes in Kiso may reflect a combination of glial cell content and diversification.
Acknowledgements
The authors would like to acknowledge the funding sources: NSERC (Natural Sciences and Engineering Research Council), OGS (Ontario Graduate Scholarship), NFREF (New Frontiers in Research Fund).References
1. Hammelrath L, Škokić S, Khmelinskii A, et al. Morphological maturation of the mouse brain: An in vivo MRI and histology investigation. Neuroimage. 2016;125:144-152. doi:10.1016/j.neuroimage.2015.10.009
2. Mengler L, Khmelinskii A, Diedenhofen M, et al. Brain maturation of the adolescent rat cortex and striatum: Changes in volume and myelination. Neuroimage. 2014;84:35-44. doi:10.1016/j.neuroimage.2013.08.034
3. Szczepankiewicz F, Lasič S, van Westen D, et al. Quantification of microscopic diffusion anisotropy disentangles effects of orientation dispersion from microstructure: Applications in healthy volunteers and in brain tumors. Neuroimage. 2015;104:241-252. doi:10.1016/j.neuroimage.2014.09.057
4. Westin CF, Knutsson H, Pasternak O, et al. Q-space trajectory imaging for multidimensional diffusion MRI of the human brain. Neuroimage. 2016;135:345-362. doi:10.1016/j.neuroimage.2016.02.039
5. Arezza NJJ, Tse DHY, Baron CA. Rapid microscopic fractional anisotropy imaging via an optimized linear regression formulation. Magn Reson Imaging. 2021;80(April):132-143. doi:10.1016/j.mri.2021.04.015
6. Helms G, Dathe H, Kallenberg K, Dechent P. High-resolution maps of magnetization transfer with inherent correction for RF inhomogeneity and T1 relaxation obtained from 3D FLASH MRI. Magn Reson Med. 2008;60(6):1396-1407. doi:10.1002/mrm.21732
7. Rahman N, Xu K, Omer M, Budde MD, Brown A, Baron CA. Test-retest reproducibility of in vivo oscillating gradient and microscopic anisotropy diffusion MRI in mice at 9.4 Tesla. PLoS One. 2021;16(11):e0255711. doi:10.1371/journal.pone.0255711
8. Rahman N, Ramnarine J, Xu K, Brown A, Baron C. Test-retest reproducibility of in vivo magnetization transfer ratio and saturation index in mice at 9.4 Tesla. J Magn Reson Imaging. Published online 2022:1-11. doi:10.1002/jmri.28106
9. Rahman N, Xu K, Budde M, Brown A, Baron C. A longitudinal microstructural MRI dataset in healthy C57Bl/6 mice at 9.4 Tesla. Sci Data. Published online 2023:1-16. doi:10.1038/s41597-023-01942-5
10. Das SK, Wang JL, Bing L, Bhetuwal A, Yang HF. Regional Values of Diffusional Kurtosis Estimates in the Healthy Brain during Normal Aging. Clin Neuroradiol. 2015;27(3):283-298. doi:10.1007/s00062-015-0490-z
11. Cheung MM, Hui ES, Chan KC, Helpern JA, Qi L, Wu EX. Does diffusion kurtosis imaging lead to better neural tissue characterization? A rodent brain maturation study. Neuroimage. 2009;45(2):386-392. doi:10.1016/j.neuroimage.2008.12.018
12. Han XF, Geng ZJ, Zhu QF, Song ZH, Lv H Di. Diffusion kurtosis imaging: An efficient tool for evaluating age-related changes in rat brains. Brain Behav. 2021;11(11):1-9. doi:10.1002/brb3.2136
13. Sloane JA, Hollander W, Rosene DL, Moss MB, Kemper T, Abraham CR. Astrocytic hypertrophy and altered GFAP degradation with age in subcortical white matter of the rhesus monkey. Brain Res. 2000;862(1-2):1-10. doi:10.1016/S0006-8993(00)02059-X
14. Sabbatini M, Barili P, Bronzetti E, Zaccheo D, Amenta F. Age-related changes of glial fibrillary acidic protein immunoreactive astrocytes in the rat cerebellar cortex. Mech Ageing Dev. 1999;108(2):165-172. doi:10.1016/S0047-6374(99)00008-1
15. He Y, Aznar S, Siebner HR, Dyrby TB. In vivo tensor-valued diffusion MRI of focal demyelination in white and deep grey matter of rodents. NeuroImage Clin. 2021;30:102675. doi:10.1016/j.nicl.2021.102675
Figures