0645
Robust double-diffusion-encoded spectroscopy (DDES) in the human brain on a clinical MR scanner using metabolite-cycling1CIBM Center for Biomedical Imaging, EPFL Lausanne, Lausanne, Switzerland, 2Cardiff University Brain Research Imaging Centre (CUBRIC), Cardiff University, Cardiff, United Kingdom, 3Magnetic Resonance Methodology, Institute of Diagnostic and Interventional Neuroradiology,, University Bern, Bern, Switzerland, 4Translational Imaging Center, sitem-insel, Bern, Switzerland, 5Clinical Imaging Sciences Centre, Brighton and Sussex Medical School, University of Sussex, Brighton, United Kingdom, 6C.J. Gorter Center for High Field MRI, Department of Radiology, Leiden University Medical Center, Leiden, Netherlands, 7National Physical Laboratory, Teddington, United Kingdom, 8Danish Research Centre for Magnetic Resonance, Centre for Functional and Diagnostic Imaging and Research, Copenhagen University Hospital Amager and Hvidovre, Hvidovre, Denmark, 9Department of Health Technology, Technical University of Denmark, Lyngby, Denmark
Synopsis
Keywords: Microstructure, Brain, DDE, metabolites, microstructure
Motivation: Double-Diffusion-Encoded Spectroscopy (DDES) provides multiple metrics of cell-specific morphology in a single MR experiment but is prone to motion-induced signal distortions.
Goal(s): To obtain robust microstructural metrics of cell-type specific diffusion in different brain regions.
Approach: We combine DDES with metabolite-cycling (MC) and motion-compensation (MoCom) to correct for signal distortions in post processing.
Results: MoCom improves DDES data quality and reproducibility and allows metabolite specific diffusion metrics to be obtained on clinical 3T MR scanners.
Impact: The implementation of robust Double-Diffusion-Encoded Spectroscopy (DDES) on clinical MR scanners can shed new light on cellular microstructure in the healthy and pathological brain.
Introduction
Diffusion-weighted MR spectroscopy (DW-MRS) measures diffusion properties of intracellular metabolites. Although modelling techniques can retrieve diffusion signals from cellular morphology of neuronal (tNAA) and glial (tCho) cells[1], the inverse problem is ill-defined. A possible solution is multi-parametric DW-MRS, where diffusion-encoding, echo- or inversion-time is chosen to sensitize metabolic signals to specific structural features and length scales. Double-diffusion-encoding (DDE), in particular, can distinguish between microscopic compartments such as cylinders and spheres in macroscopically amorphous tissue[2]. In combination with MRS, double-diffusion-encoded spectroscopy (DDES) provides cell-specific morphological information[3]–[6]. However, retrieving nuanced directional differences in metabolite diffusion requires careful suppression of motion effects. Here, we combined DDES with metabolite-cycling (MC) and motion-compensation (MoCom) for robust brain metabolite microscopic anisotropy estimation on clinical MR scanners.Methods
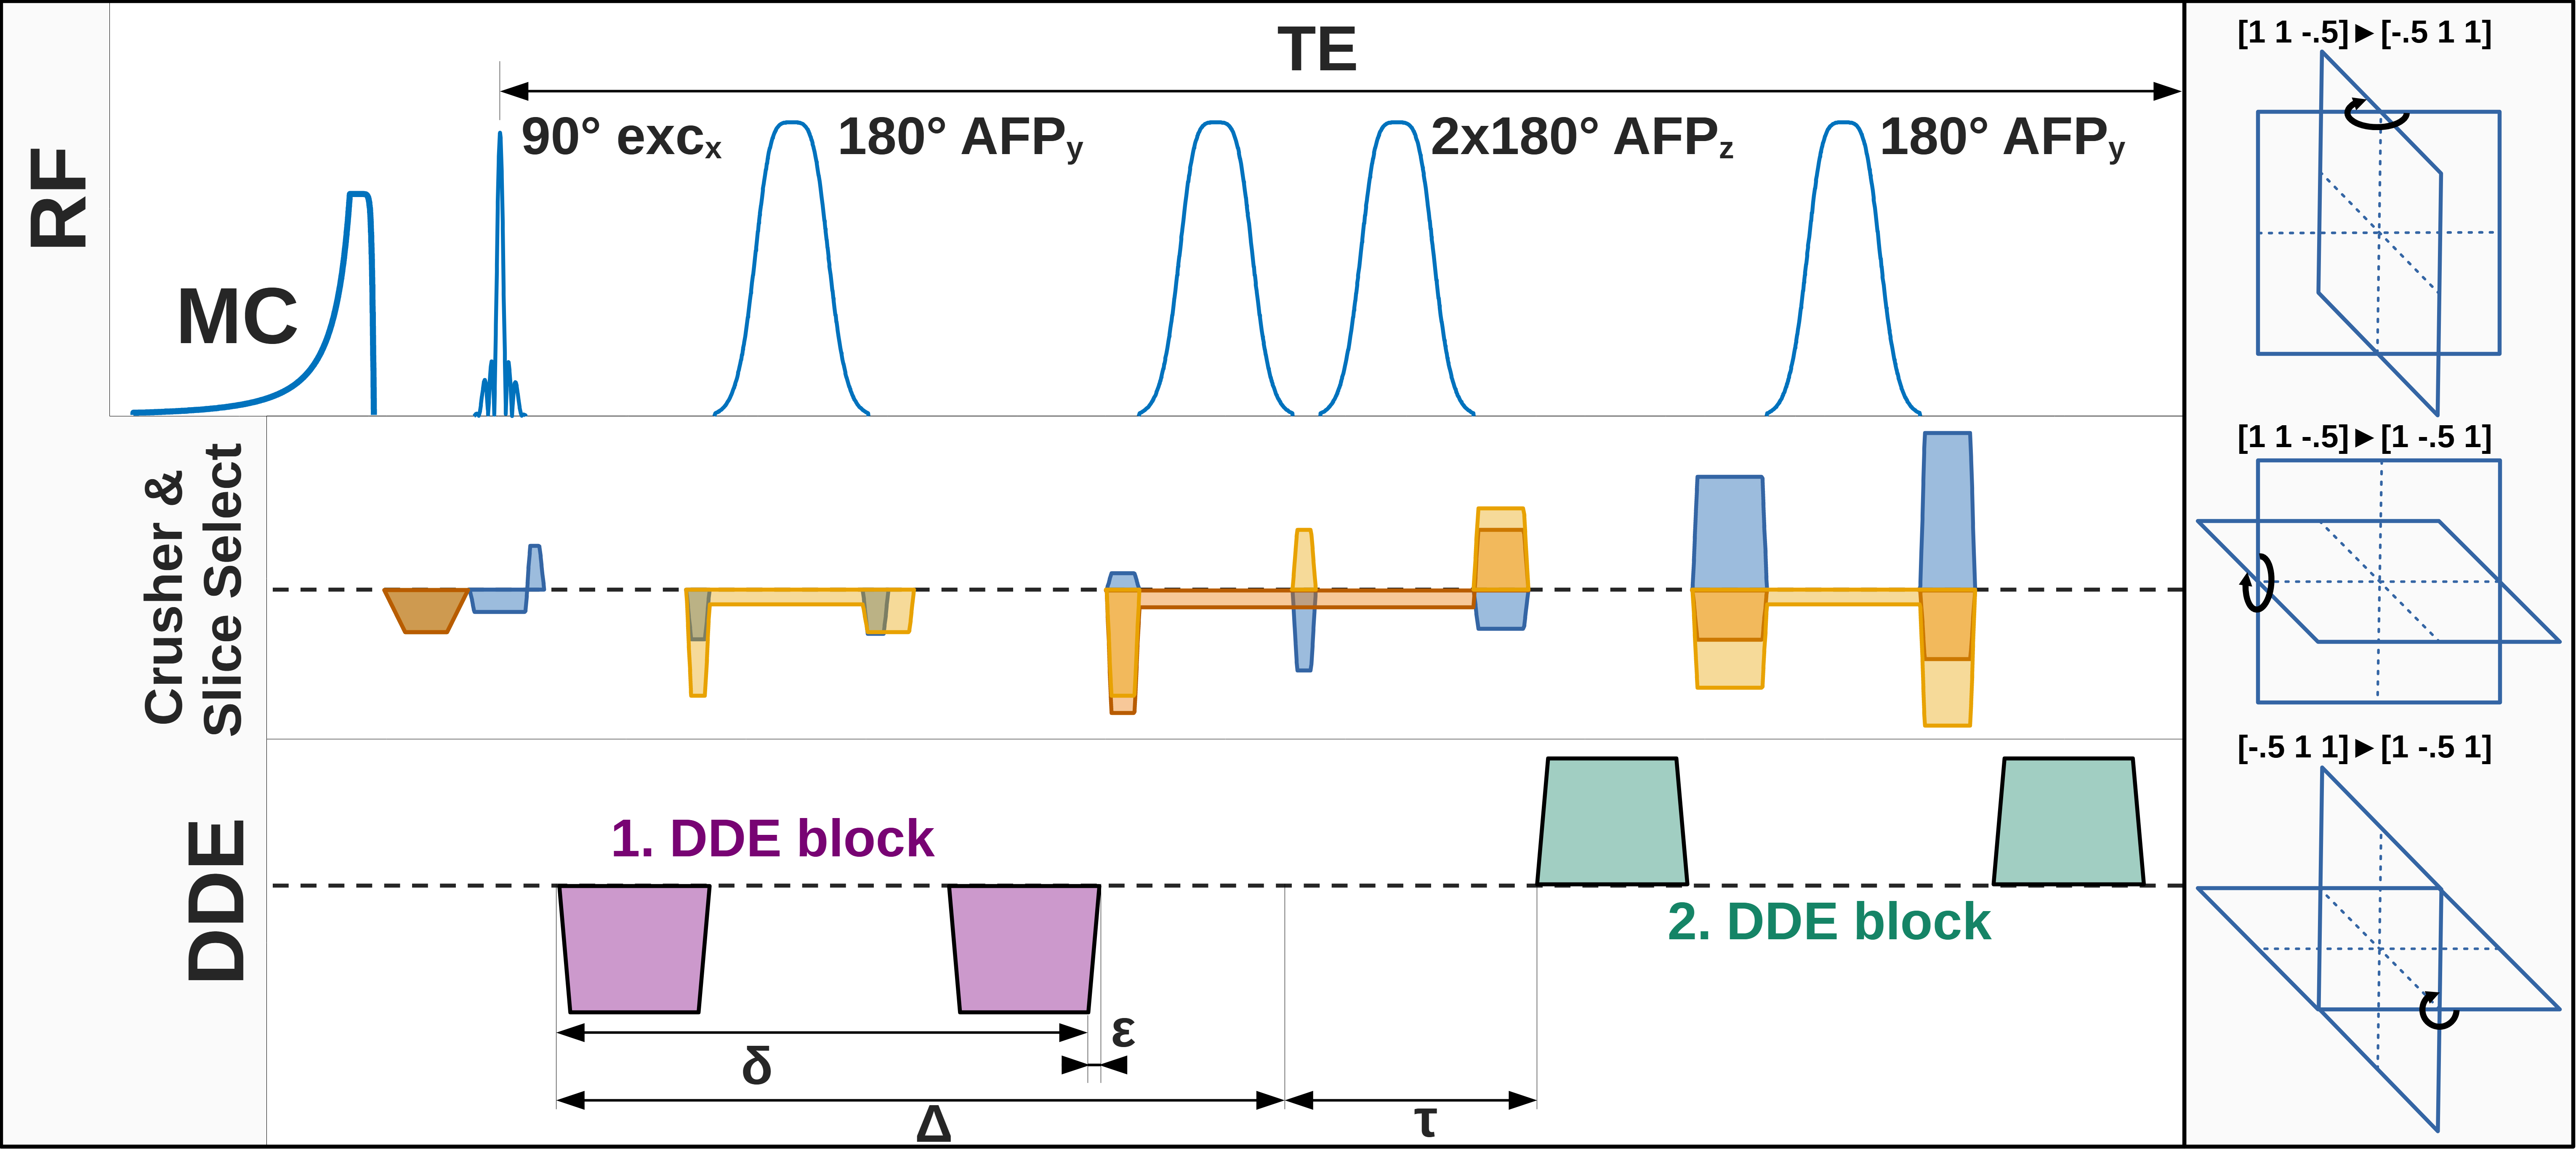
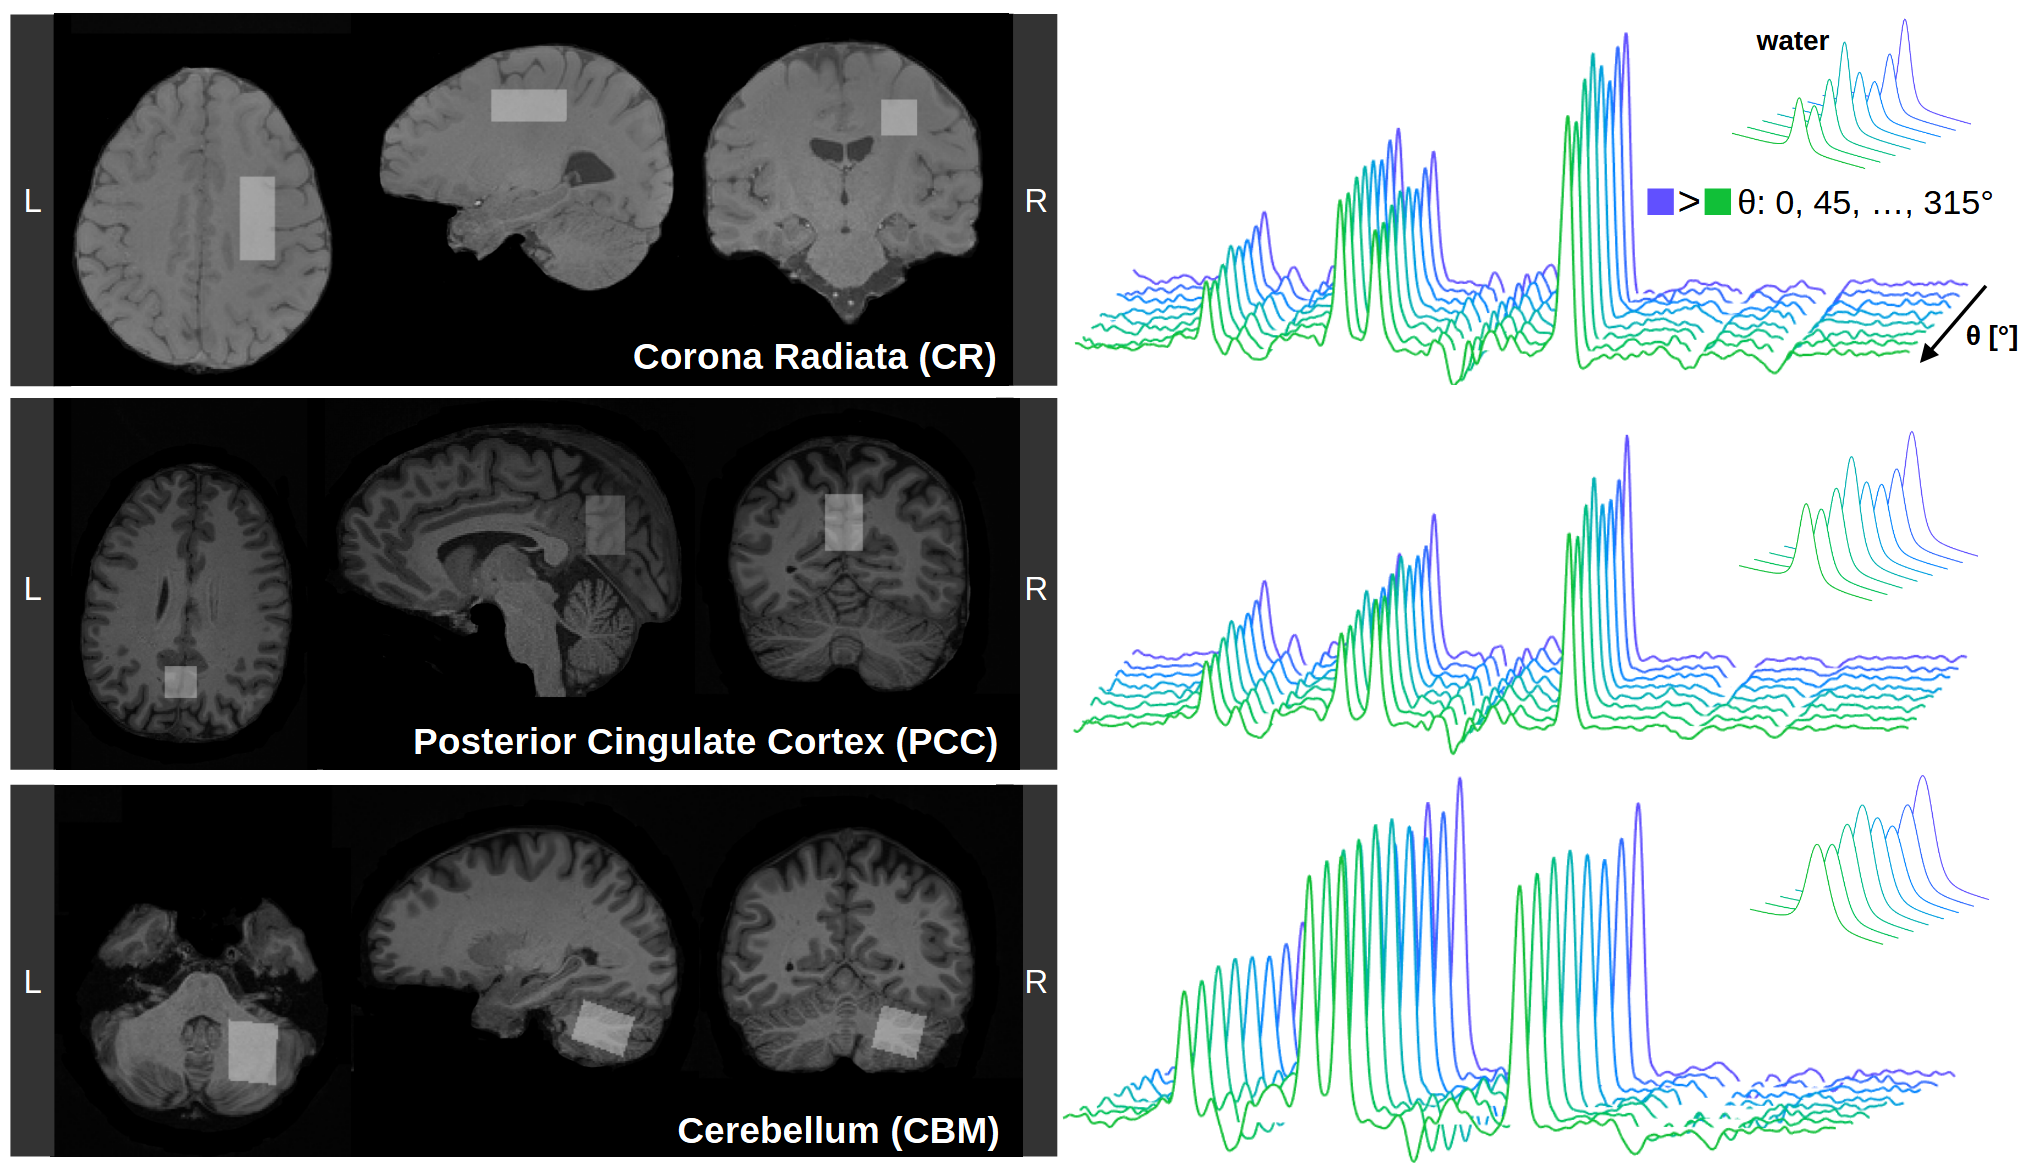
Data acquisition: Measurements were conducted on three 3T Siemens PRISMA MR scanners using 32-channel headcoils. Non-water suppressed diffusion-weighted spectra were acquired using a semiLASER sequence[7] (TE/TR: 125/2500ms) extended by MC and DDE(Fig. 1). The crushing scheme was optimized to reduce spurious diffusion-weighting by splitting crushing gradients to null zero-order moments in between rf-pulses. Diffusion-weighting was applied at a b-value of 5.2ms/µm² with DDE encoding along three orthogonal planes ([1.0 1.0 -0.5], [-0.5 1.0 1.0], [1.0 -0.5 1.0]) using a 5- or 8-step rotation-cycle (θ5: 0, 72, …, 288°; θ8: 0, 45, …, 315°). At b=0 3x16 transients were acquired interleaved within the rotation-cycle. DDE gradient timings were chosen as Δ/δ/ε/τ: 32/14/1/39ms resulting in an effective diffusion-time of 27.3ms for each encoding block(Fig. 1). For each rotation-angle data with negative and positive gradient polarity were acquired with 24 transients each (144 per angle). MPRAGE (1mm³ isotropic) was used for voxel positioning and tissue segmentation(Fig. 2). Total measurement times were 45min and 1hr10min for θ5 and θ8, respectively. Data were obtained from 11 healthy subjects (45.6±14.1yrs, 2 female), with VOIs in the corona radiata (CR: N=4; 10.8±0.5mL; GM/WM/CSF: 7.6±4.5/92.0±4.8/0.4±0.4), posterior cingulate cortex (PCC: N=4; 16.1±2.4mL; GM/WM/CSF: 63.0±5.4/22.7±5.0/14.3±0.8) and cerebellum (CBM: N=3; 11.0±1.4mL; GM/WM/CSF: 59.6±6.3/40.1±6.4/0.3±0.2)(Fig. 2).Analysis, Fitting and Modeling: MC preserves a water reference for each transient, which was used for coil-channel combination, phase-offset, frequency-drift, and eddy-current correction and MoCom using Matlab[8]. A longitudinal signal drift was corrected based on interleaved b=0 scans. Metabolite basis-sets were simulated with MARSS for 18 metabolites[9]. Linear-combination modeling was performed sequentially in FiTAID[10]. The rotation-angle dependence was fitted with a biophysical model of a powder average of 256 uniformly oriented diffusion-tensors with radial (D||) and axial (Dꓕ) diffusion-components[6]. The mean diffusivity (MD) and microscopic fractional anisotropy (μFA) were calculated from D|| and Dꓕ[6]. The analysis was performed without and with MoCom.
Results and Discussion
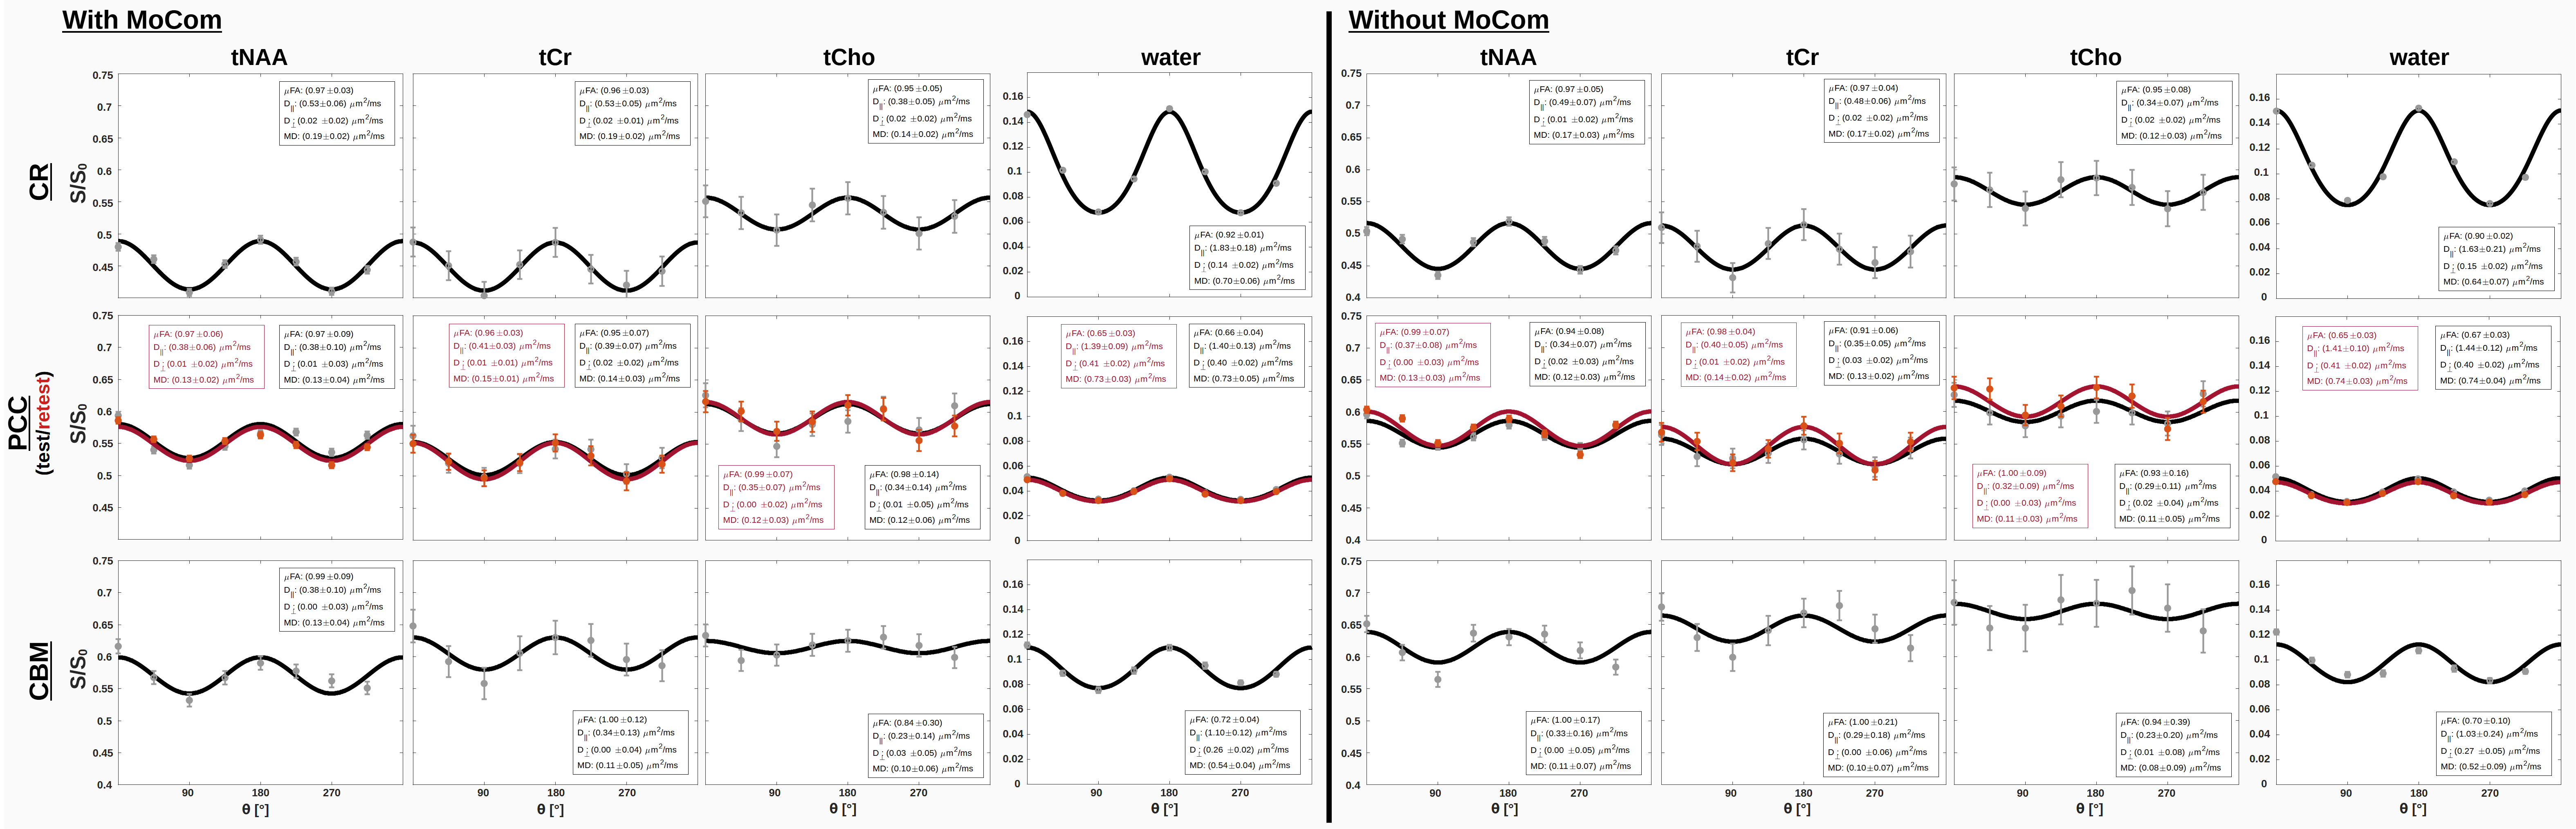
Fig. 2 shows the spectral quality after MoCom exemplarily in CR, PCC and CBM. Apart from the major singlets (tNAA, tCr, tCho) J-coupled metabolites (mI, Glu) are also visible. The NAA peak clearly exhibits oscillation patterns characteristic for microscopic anisotropy.Fig. 3 shows the fitted S(θ) for tNAA, tCr, tCho and the simultaneously acquired water with and without MoCom in all brain regions. The oscillation patterns are more consistent after MoCom and the uncertainties of all fitting parameters reduce cohort-wide for MD(-13%), μFA(-21%), D||(-14%) and Dꓕ(-12%). In general, fitting uncertainties were highest for Dꓕ. A test/retest experiment in PCC and pronounced motion artifact amelioration in CBM demonstrate the benefits of MoCom. Oscillation amplitudes of metabolites are highest in CR and lowest in CBM, while the water amplitude is lowest in PCC.
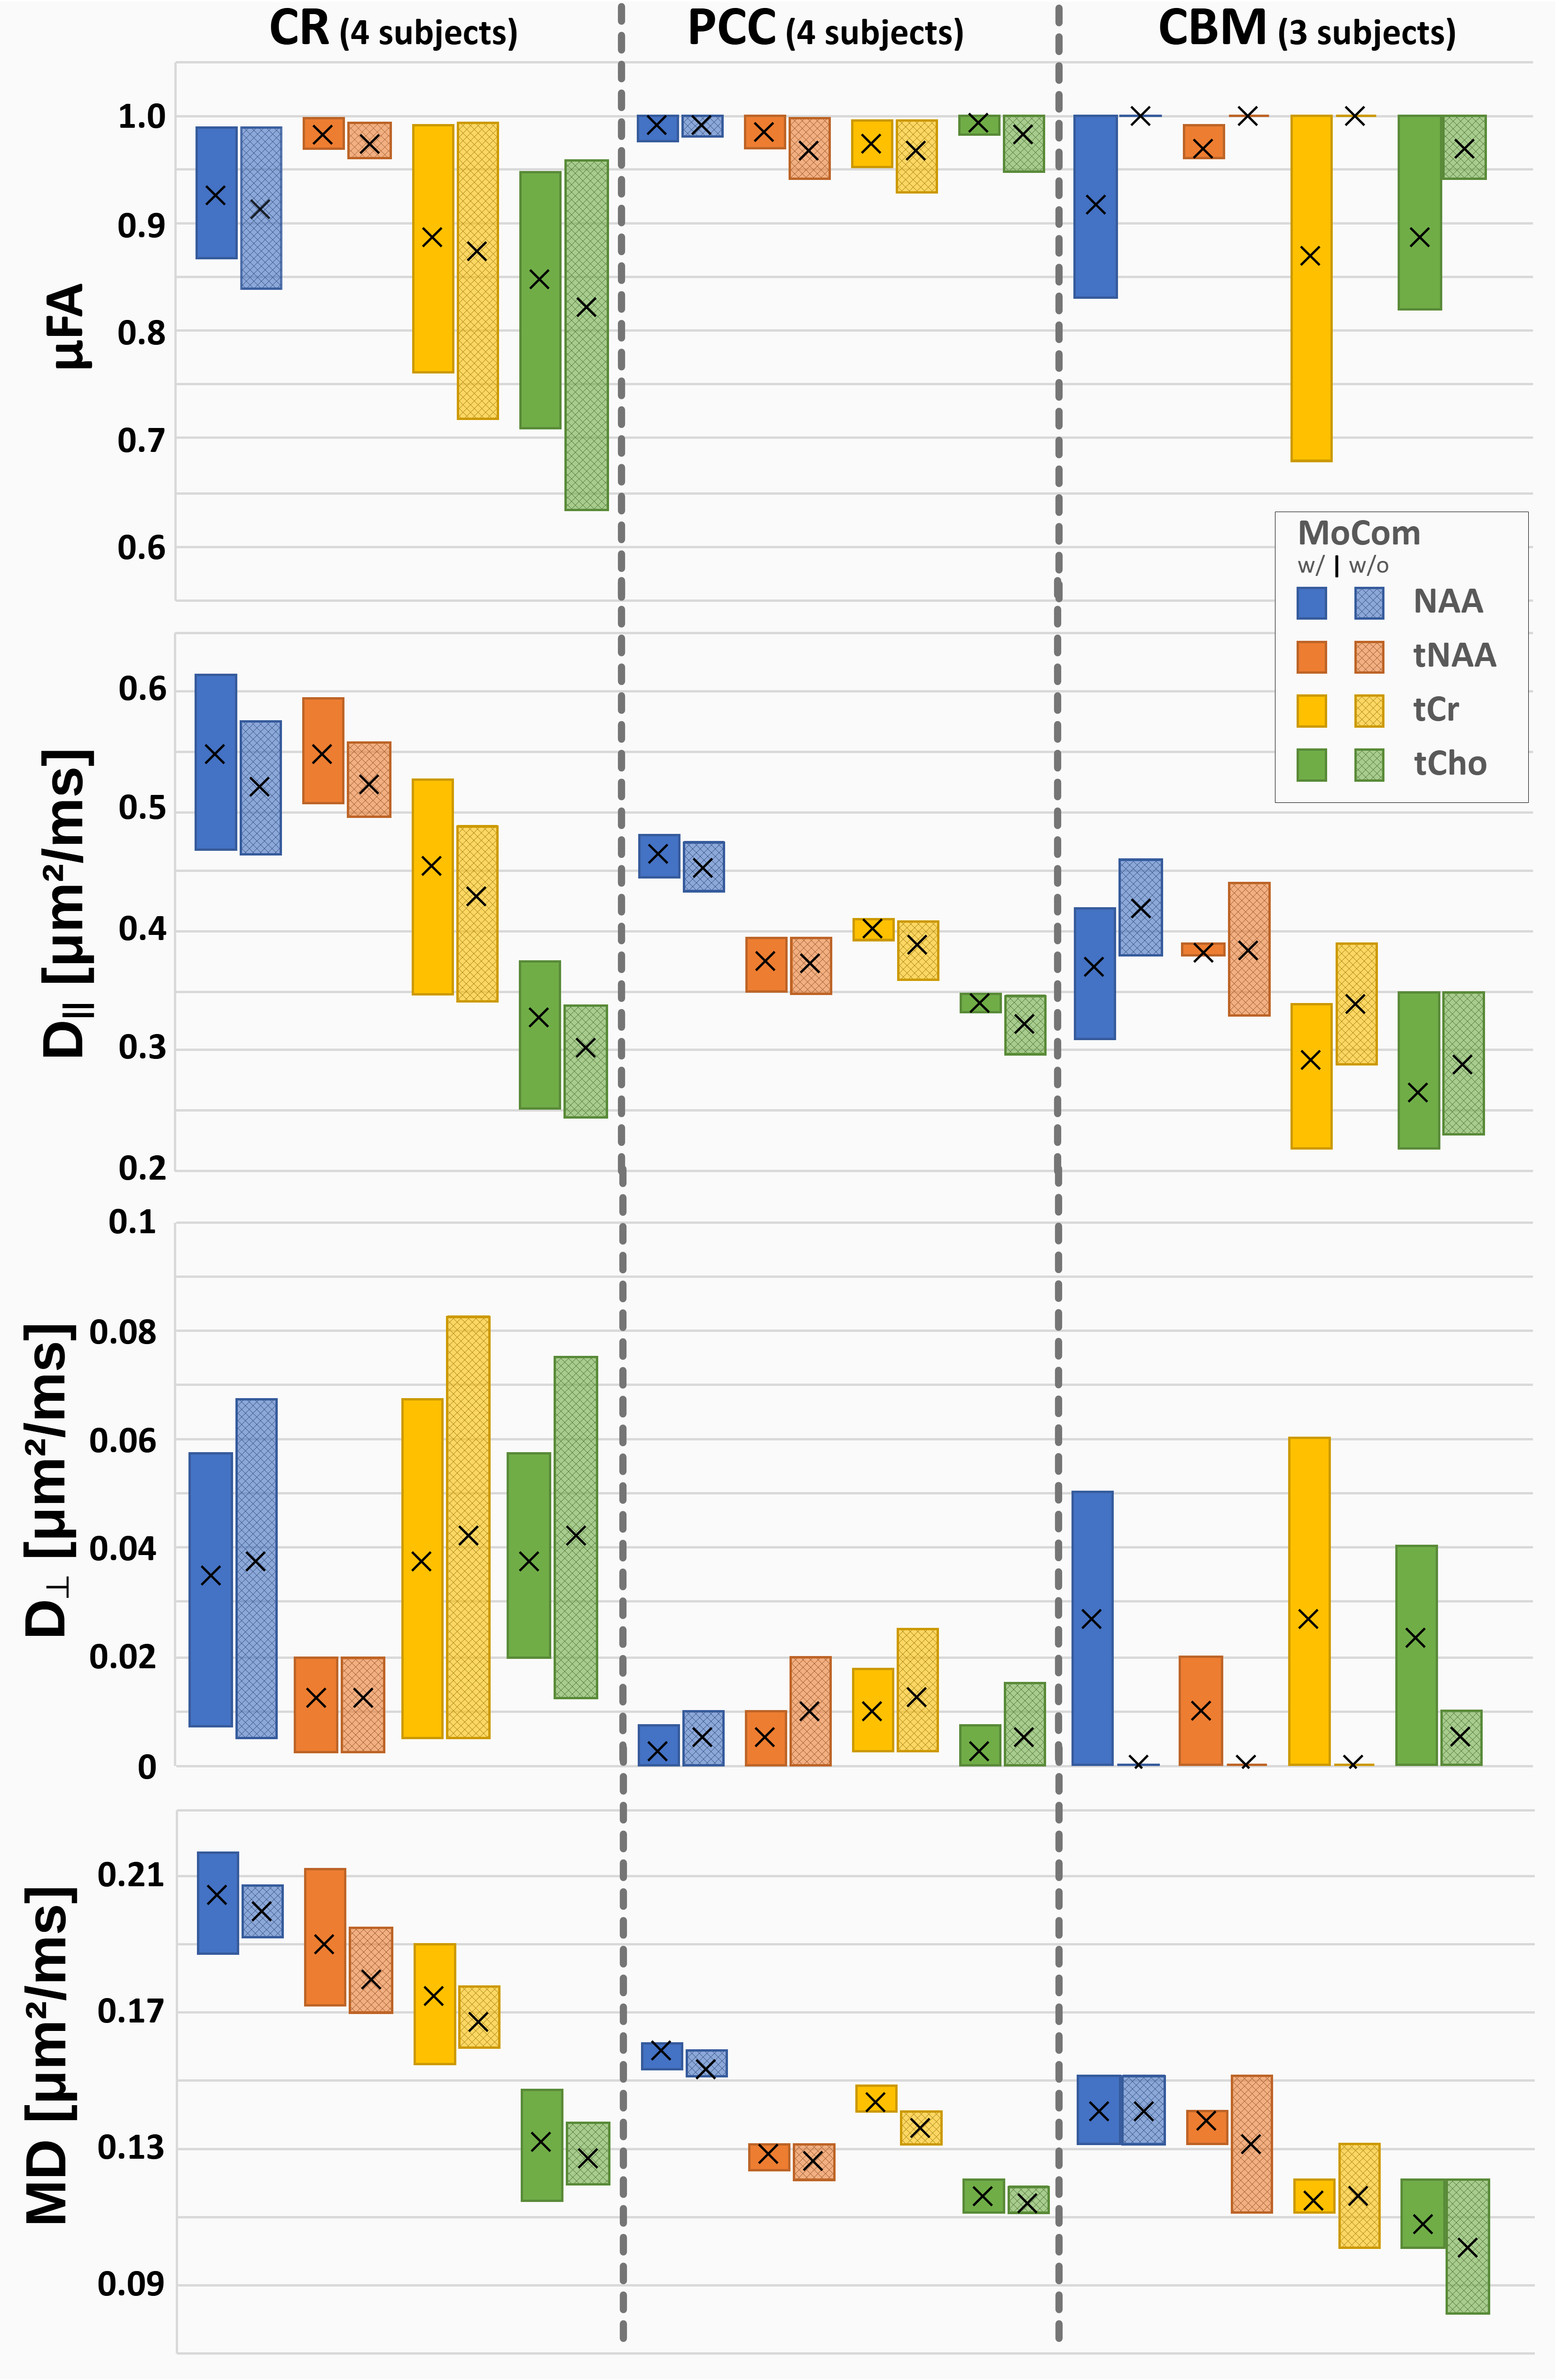
Cohort results are presented in Fig. 4. In PCC, all acquisitions used the longer acquisition scheme θ8, but only 50% in CR and 33% in PCC. This potentially explains higher data variability in the two latter cases where one dataset in CBM could only be fitted with MoCom applied. In PCC, MoCom reduces intersubject variability, but not in CR nor CBM. Consistent μFA values close to 1 are found in all cases but with higher uncertainties in CR and CBM where the shorter rotation-cycle scheme θ5 with less rotation angles is applied. D|| and MD are highest in the WM rich CR and lowest in CBM. In general, tCho diffusion (D||, MD) is more consistent across different brain regions. Dꓕ is close to zero with high uncertainties in all cases.
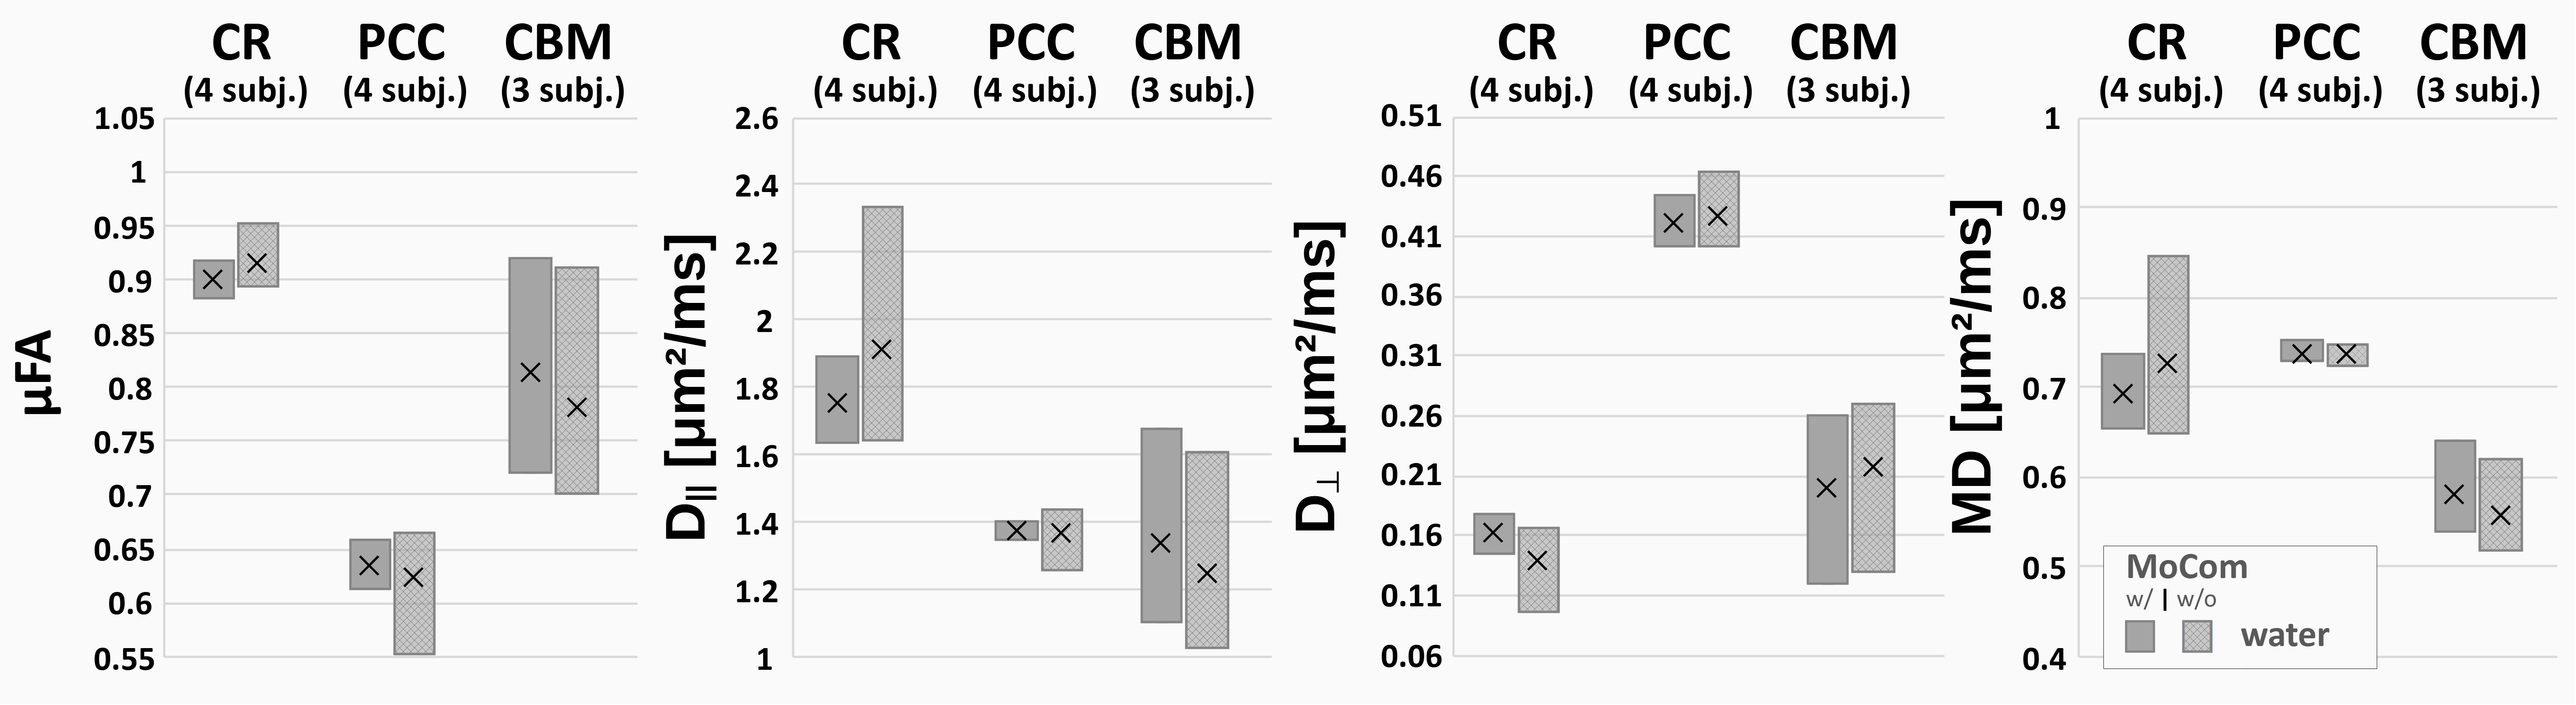
Water diffusion metrics in Fig. 5 align with results reported by Lundell et al.[6]. In general, the intersubject variability of water diffusion metrics is reduced after MoCom.
Conclusion
We show that MC with MoCom improves the robustness of DDES. It can be used to shorten measurement time by simultaneously acquiring metabolite and water diffusion.Acknowledgements
AD is supported by a Swiss National Science Foundation Fellowship (SNSF #202962). HL is supported by the European Research Council (ERC) (EU Horizon 2020, #804746).References
[1] Ligneul C, et al. Diffusion-weighted MR spectroscopy: consensus, recommendations and resources from acquisition to modelling. arXiv. 2305.10829, 2023.
[2] Henriques RN, Palombo M, Jespersen SN, Shemesh N, Lundell H, Ianuş A. Double diffusion encoding and applications for biomedical imaging. J Neurosci Methods. 348:108989, 2021.
[3] Vincent M, Palombo M, Valette J. Revisiting double diffusion encoding MRS in the mouse brain at 11.7T: Which microstructural features are we sensitive to? Neuroimage. 207:116399, 2020.
[4] Shemesh N, et al. Conventions and nomenclature for double diffusion encoding NMR and MRI. Magn Reson Med. 75:82–7, 2016.
[5] Shemesh N, Rosenberg JT, Dumez JN, Grant SC, Frydman L. Distinguishing neuronal from astrocytic subcellular microstructures using in vivo Double Diffusion Encoded 1H MRS at 21.1 T. PLoS One. 12:1–19, 2017.
[6] Lundell H, Najac C, Bulk M, Kan HE, Webb AG, Ronen I. Compartmental diffusion and microstructural properties of human brain gray and white matter studied with double diffusion encoding magnetic resonance spectroscopy of metabolites and water. Neuroimage. 234:117981, 2021.
[7] Döring A, Kreis R. Magnetic resonance spectroscopy extended by oscillating diffusion gradients: Cell-specific anomalous diffusion as a probe for tissue microstructure in human brain. Neuroimage. 202:116075, 2019.
[8] Döring A, Adalid V, Boesch C, Kreis R. Diffusion-weighted magnetic resonance spectroscopy boosted by simultaneously acquired water reference signals. Magn Reson Med. 80:2326–8, 2018.
[9] Landheer K, Swanberg KM, Juchem C. Magnetic resonance Spectrum simulator (MARSS), a novel software package for fast and computationally efficient basis set simulation. NMR Biomed. 34:e4129, 2019.
[10] Adalid V, Döring A, Kyathanahally SP, Bolliger CS, Boesch C, Kreis R. Fitting interrelated datasets: metabolite diffusion and general lineshapes. Magn Reson Mater Physics. 30:429–48, 2017.
Figures