0642
Data-driven classification of tissue water populations by massively multidimensional diffusion-relaxation correlation MRI1A.I. Virtanen Institute for Molecular Sciences, University of Eastern Finland, Kuopio, Finland, 2Department of Chemistry, Lund University, Lund, Sweden
Synopsis
Keywords: Diffusion Analysis & Visualization, Data Analysis, Multidimensional MRI
Motivation: Multidimensional diffusion-relaxation MRI opened new ways to non-invasively study sub-voxel populations of water with distinct MRI signal responses and, by inference, tissue microstructure. However, this technique creates large number nonparametric diffusion-relaxation distributions that are challenging to visualize or translate into microstructure specific maps.
Goal(s): The goal of this study is to automatically classify the distribution components for an ex vivo rat brain and compare them with histology to reveal their links to tissue fractions.
Approach: To achieve the automatic classification, we use an unsupervised data-driven clustering approach.
Results: We successfully separated white matter, gray matter, free water and additional tissue fractions.
Impact: Multidimensional diffusion-relaxation MRI combined with data-driven microstructure clustering offers new perspectives in high-specificity studies of healthy and damage tissue beyond the conventional white matter, gray matter, and free-water fractions. This is achieved by exploring the full sub-voxel multidimensional distribution space.
Introduction
Massively multidimensional diffusion-relaxation correlation MRI (MASSTER-MRI) utilizes frequency dependent-tensor valued diffusion MRI correlated with longitudinal and transverse relaxation rates expressed as nonparametric D(ω)-R1-R2 distributions to provide information on tissues microstructural properties at a sub voxel level1. The distributions can be used to separate different water populations within a single voxel by manually binning the parameter space. In previous brain studies1-5, three bins were defined using two parameters only: the isotropic diffusivity (Diso) and the squared normalized anisotropy (DΔ2) to distinguish the white matter (WM), gray matter (GM) and free water (FW). Each of these tissue types has different diffusivity, anisotropy, and chemical properties; thus, it is important to characterize each fraction to understand the changes that might occur during pathologies. However, while the manual 3-bins approach separates properly WM, GM, and FW of the human and rat brain2,3, it misses the opportunity to disentangle complex tissue fractions. In this study, we used a data-driven clusterization approach to automatically differentiate WM, GM and FW fractions and explore the possibility of identifying additional water populations within a voxel by separating all the parameters available in D(ω)-R1-R2 distributions.Methods
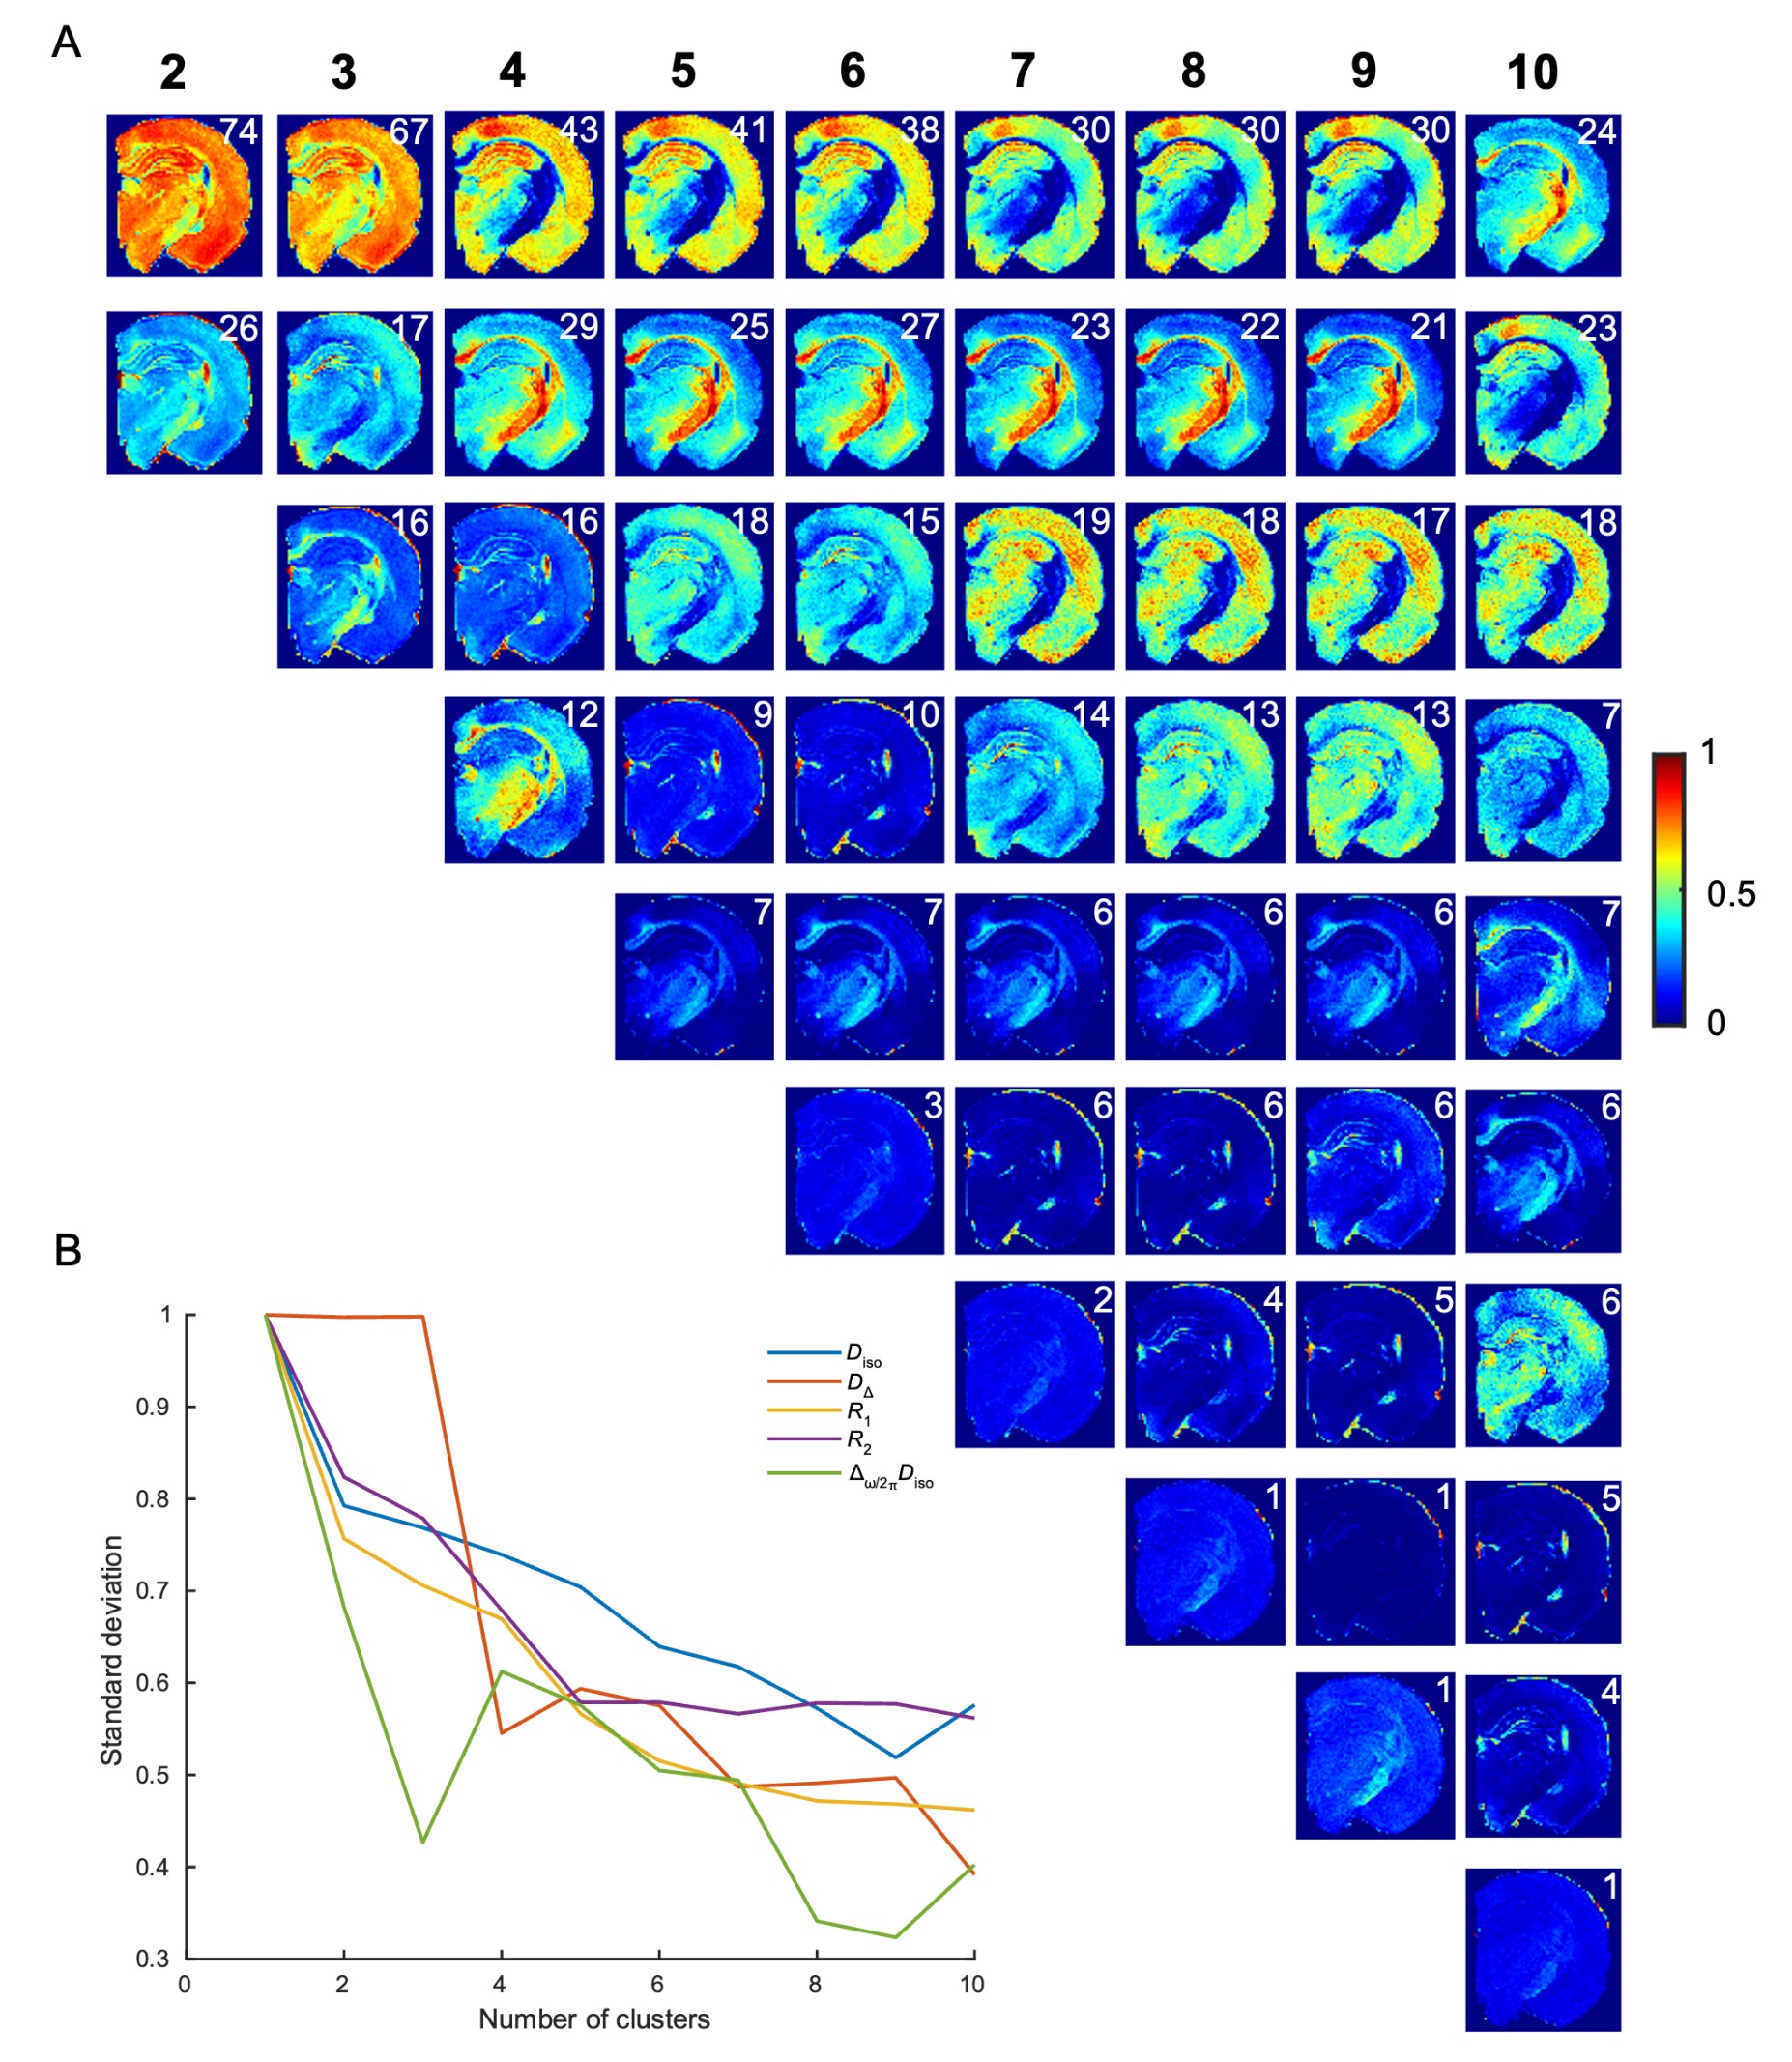
We used a 4% paraformaldehyde-fixed naive rat brain and scanned it in a Bruker Avance-III HD 11.7 T spectrometer equipped with a MIC-5 probe with 3 T/m maximum gradient amplitude. The acquisition used was a multi-slice multi-echo (MSME) sequence customized for tensor-valued diffusion encoding with general gradient waveforms and R1-R2 determination via variable repetition and echo times. The voxel size was 70×70×250 mm3. 1008 images were acquired at varying b-value (0.038–7.13 109 sm−2), centroid frequency ωcent/2π (29–110 Hz), normalized anisotropy bΔ (−0.5 to 1), orientation (Θ, Φ), repetition time τR (200–7000 ms), and echo time τE (6–180 ms). The inversion algorithm was applied to obtain the nonparametric D(ω)-R1-R2distributions as described in previous studies4.First, we applied the manual 3-bins approach1-3 on the 2D Diso-DΔ2 parameter space to obtain the bin-resolved means (E[x]) of each parameter and serve as a reference (Fig. 1A and B). An unsupervised Gaussian Mixture Model (GMM) clustering was then used on the same 2D Diso and DΔ2 parameter space setting cluster number (k)=3 to mimic the 3-bins manual approach. We also set k=2-10 to go beyond the conventional 3 tissue fractions using the full parameter space (Diso, DΔ, R1, R2 and Δω/2πDiso). We obtained the standard deviation curve for each parameter across the number of clusters to try to identify a potential ideal k-value. Finally, we calculated the cluster-resolved means maps for k=6 and compare them with myelin and Nissl staining from the same brain.
Results
We successfully separated WM, GM, and FW by automatic clustering using k=3 (Fig. 1C and D) applied to the 2D Diso-DΔ2 distribution space. We observed that WM and GM were not separated clearly at k=3 (Fig. 2A) when using the full parameter space. In such case, a higher number of clusters allowed obtaining additional WM and GM-like fractions. We selected k=6 to present the cluster-resolved maps (Fig. 3A and B). We observed at k=6 that clusters 2 and 5 display WM regions but the cluster 5 highlights distributions in which R2 is higher and Diso and DΔ2 are lower than in cluster 2 (Fig. 4A-C). Cluster 3 is defined mainly by high values in Diso and Δω/2ΔπDiso (Fig. 4D-F), highlighting regions such as the granular cell layer of the dentate gyrus (gcl), ventromedial nucleus of the hypothalamus (VMH), medial habenula-Interpeduncular Nucleus (MHb), and paraventricular thalamic nucleus (PVP).Discussion
Using an unsupervised clustering approach on the 2D Diso-DΔ2 parameter space allows separating the WM, GM, and FW. However, the addition of relaxation rate dimensions and diffusion frequency-dependence requires a higher number of clusters to resolve meaningful tissue water populations. The histological comparison with the cluster-resolved maps is key to understand the meaning of each cluster fraction. While additional WM cluster fraction (cluster 5 in Fig. 3B) might suggest myelin fraction related and the cluster 3 to the intracellular water fractions, a more detailed study of the contribution remains required to validate this claim.Conclusion
Our results show the potential of the unsupervised classification of MASSTER-MRI dataset to disentangle the per-voxel tissue components beyond WM, GM, and FW in the brain. The unsupervised cluster approach can be used in other body parts (e.g., prostate and breast cancer) without requiring pre-defined bin limits. Furthermore, the characterization of the clusters by diffusivities, anisotropy, and relaxation rates can provide a better understanding of the subtle changes in different cellular fractions in tissue-specific pathologies.Acknowledgements
We thank Maarit Pulkkinen for her assistance in animal and tissue handling.We thank the Academy of Finland, Erkko Foundation, and the Doctoral Programme of Molecular Medicine of the University of Eastern Finland (DPMM) for the funding support.
References
1. Narvaez et al. Massively multidimensional diffusion-relaxation correlation MRI. Front. Phys. 2022.2. Pierpaoli et al. Diffusion tensor MR imaging of the human brain. Radiology. 1996. 201:637-648
3. Yon et al. Diffusion Tensor Distribution Imaging of an In Vivo Mouse Brain at Ultrahigh Magnetic Field by Spatiotemporal Encoding. NMR Biomed. 2020. 33:1–14.
4. Martin et al. Nonparametric D-R1-R2 Distribution MRI of the Living Human Brain. Neuroimage. 2021. 245:118753
5. Topgaard D. Diffusion Tensor Distribution Imaging. NMR Biomed. 2019. 32:e4066–12
Figures
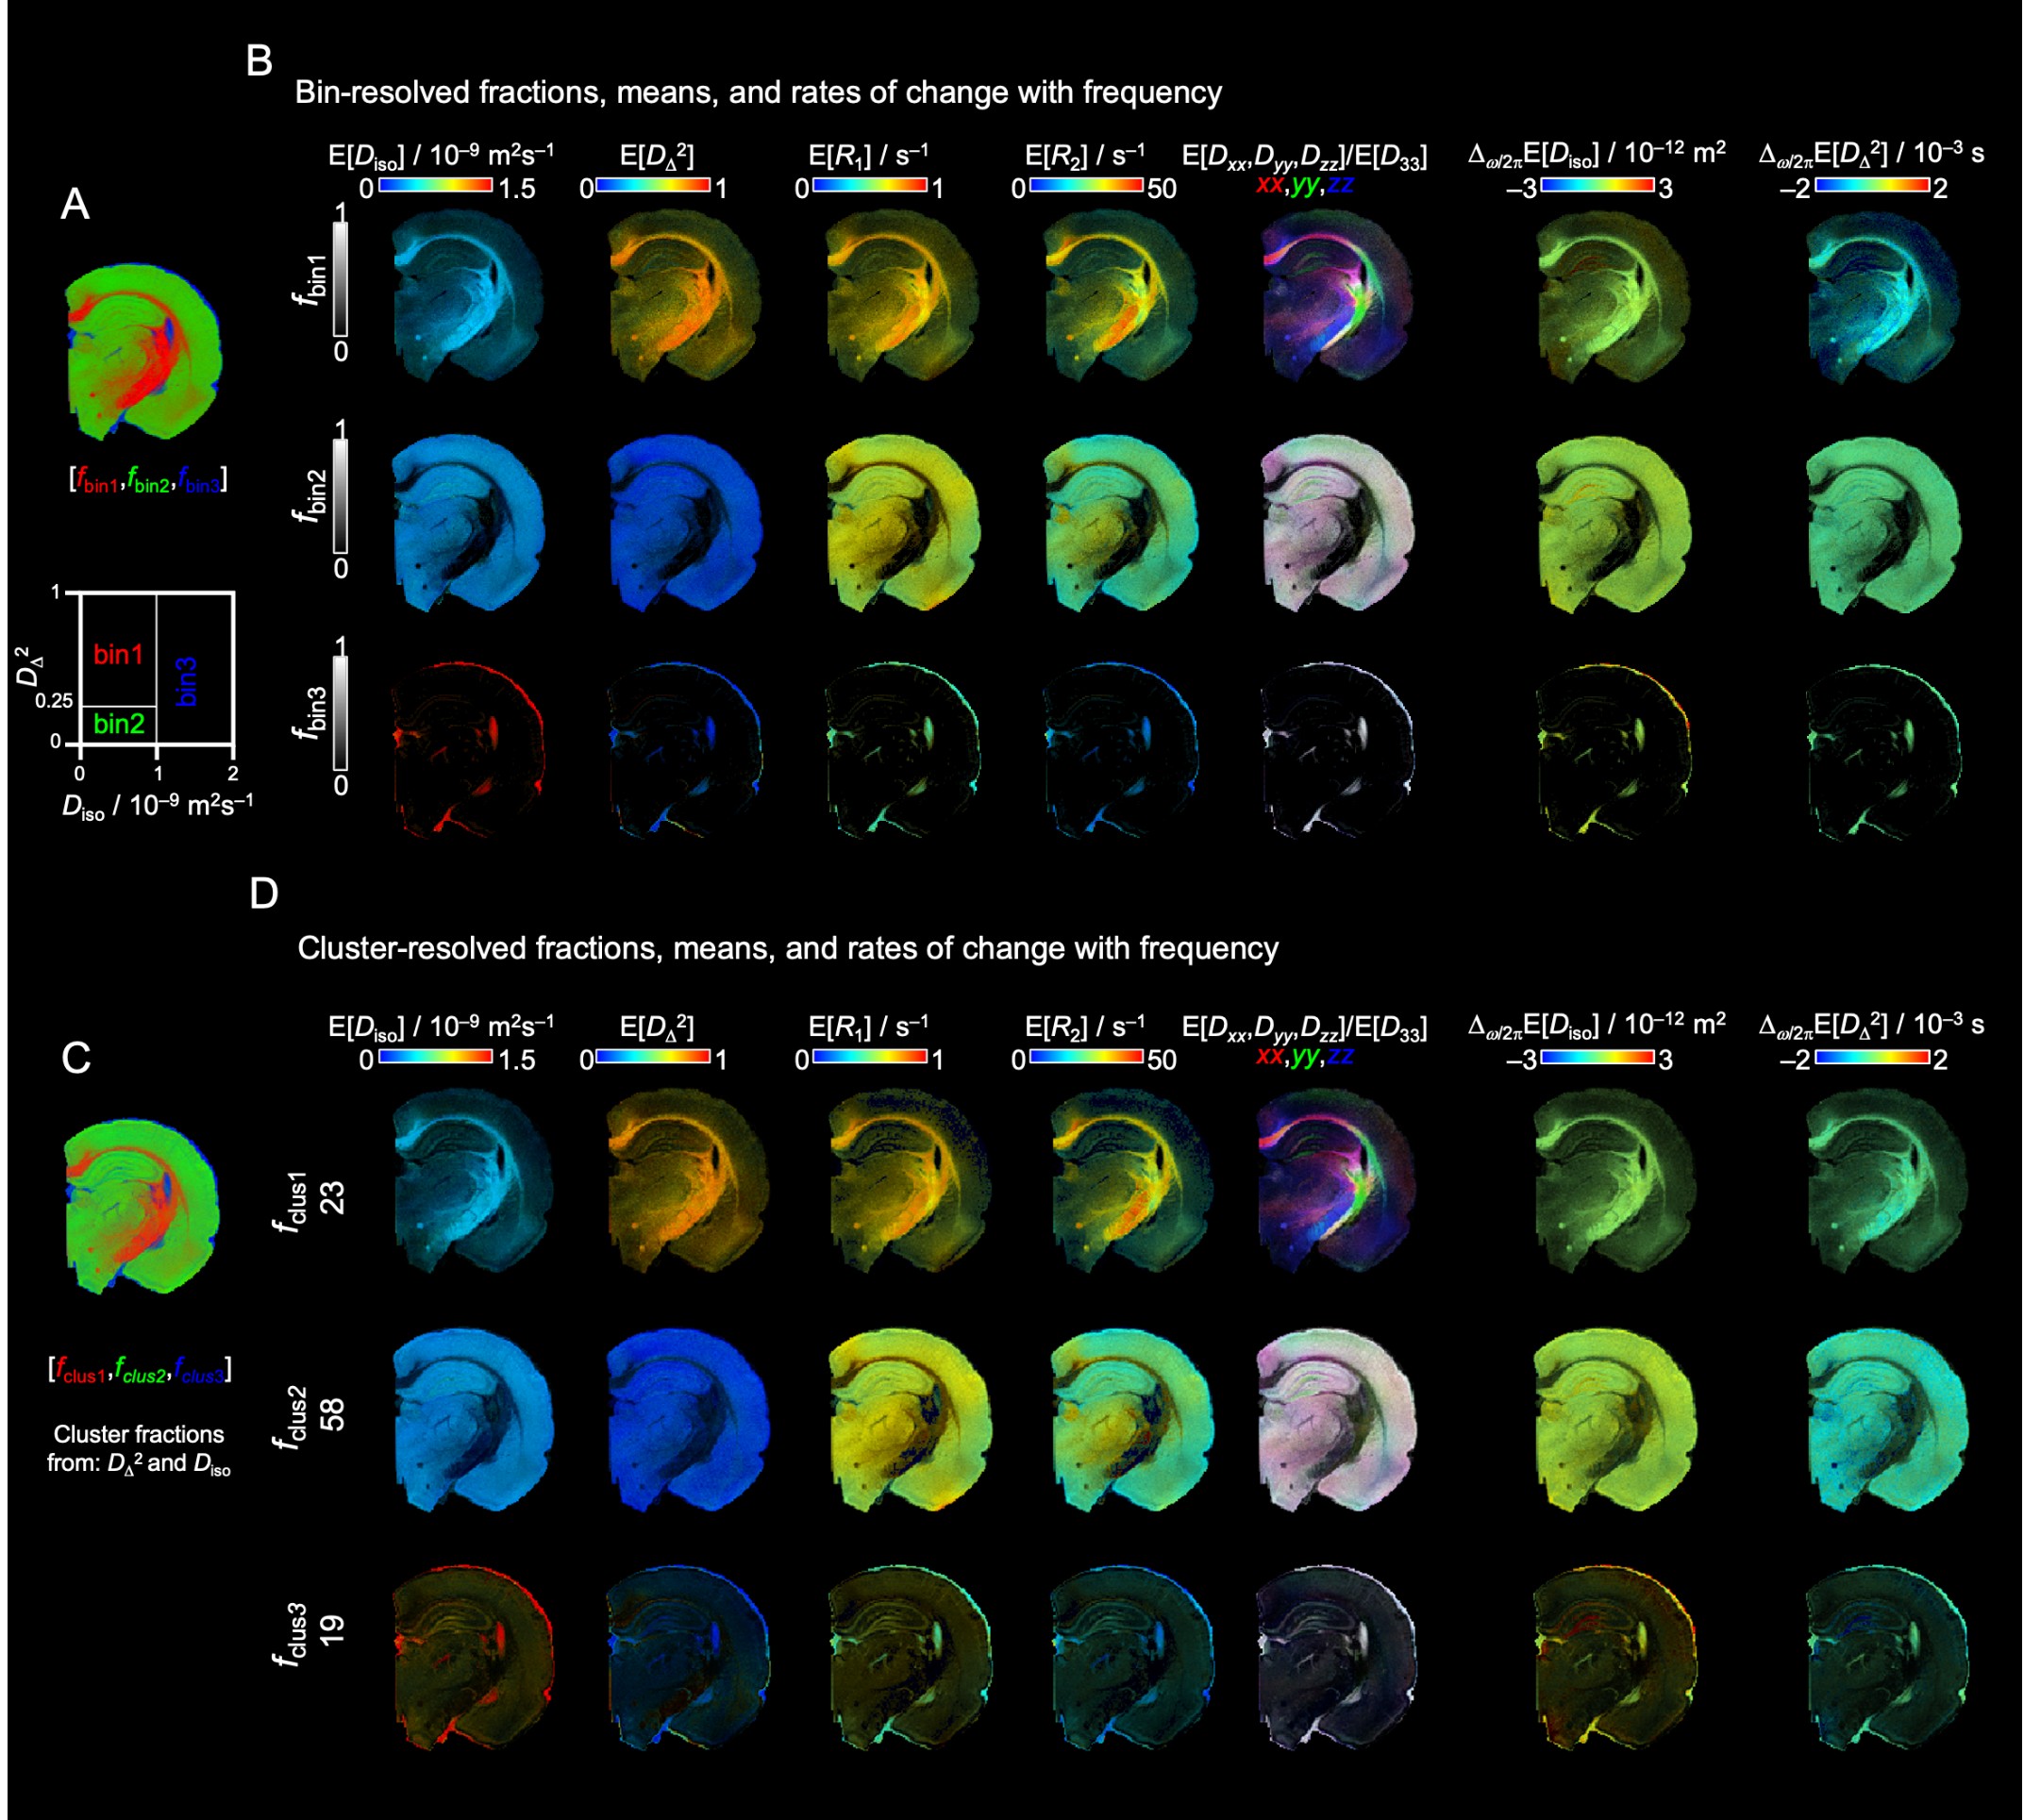
Bin-resolved and cluster-resolved mean maps derived from D(ω)-R1-R2 distributions. (A) Bin fractions segmenting WM, GM and FW regions by manually setting the bin limits in the Diso-DΔ2 space. (B) Bin-resolved parametric maps for each bin fraction. (C) Color coded unsupervised cluster-resolved fractions by setting k=3 using the Diso-DΔ2 distributions. WM, GM and FW fractions are displayed in same colors as the bin fractions. (D) Cluster-resolved parametric maps for each cluster fraction. Each fraction shows in percentage the amount of data belonging to the respective cluster.
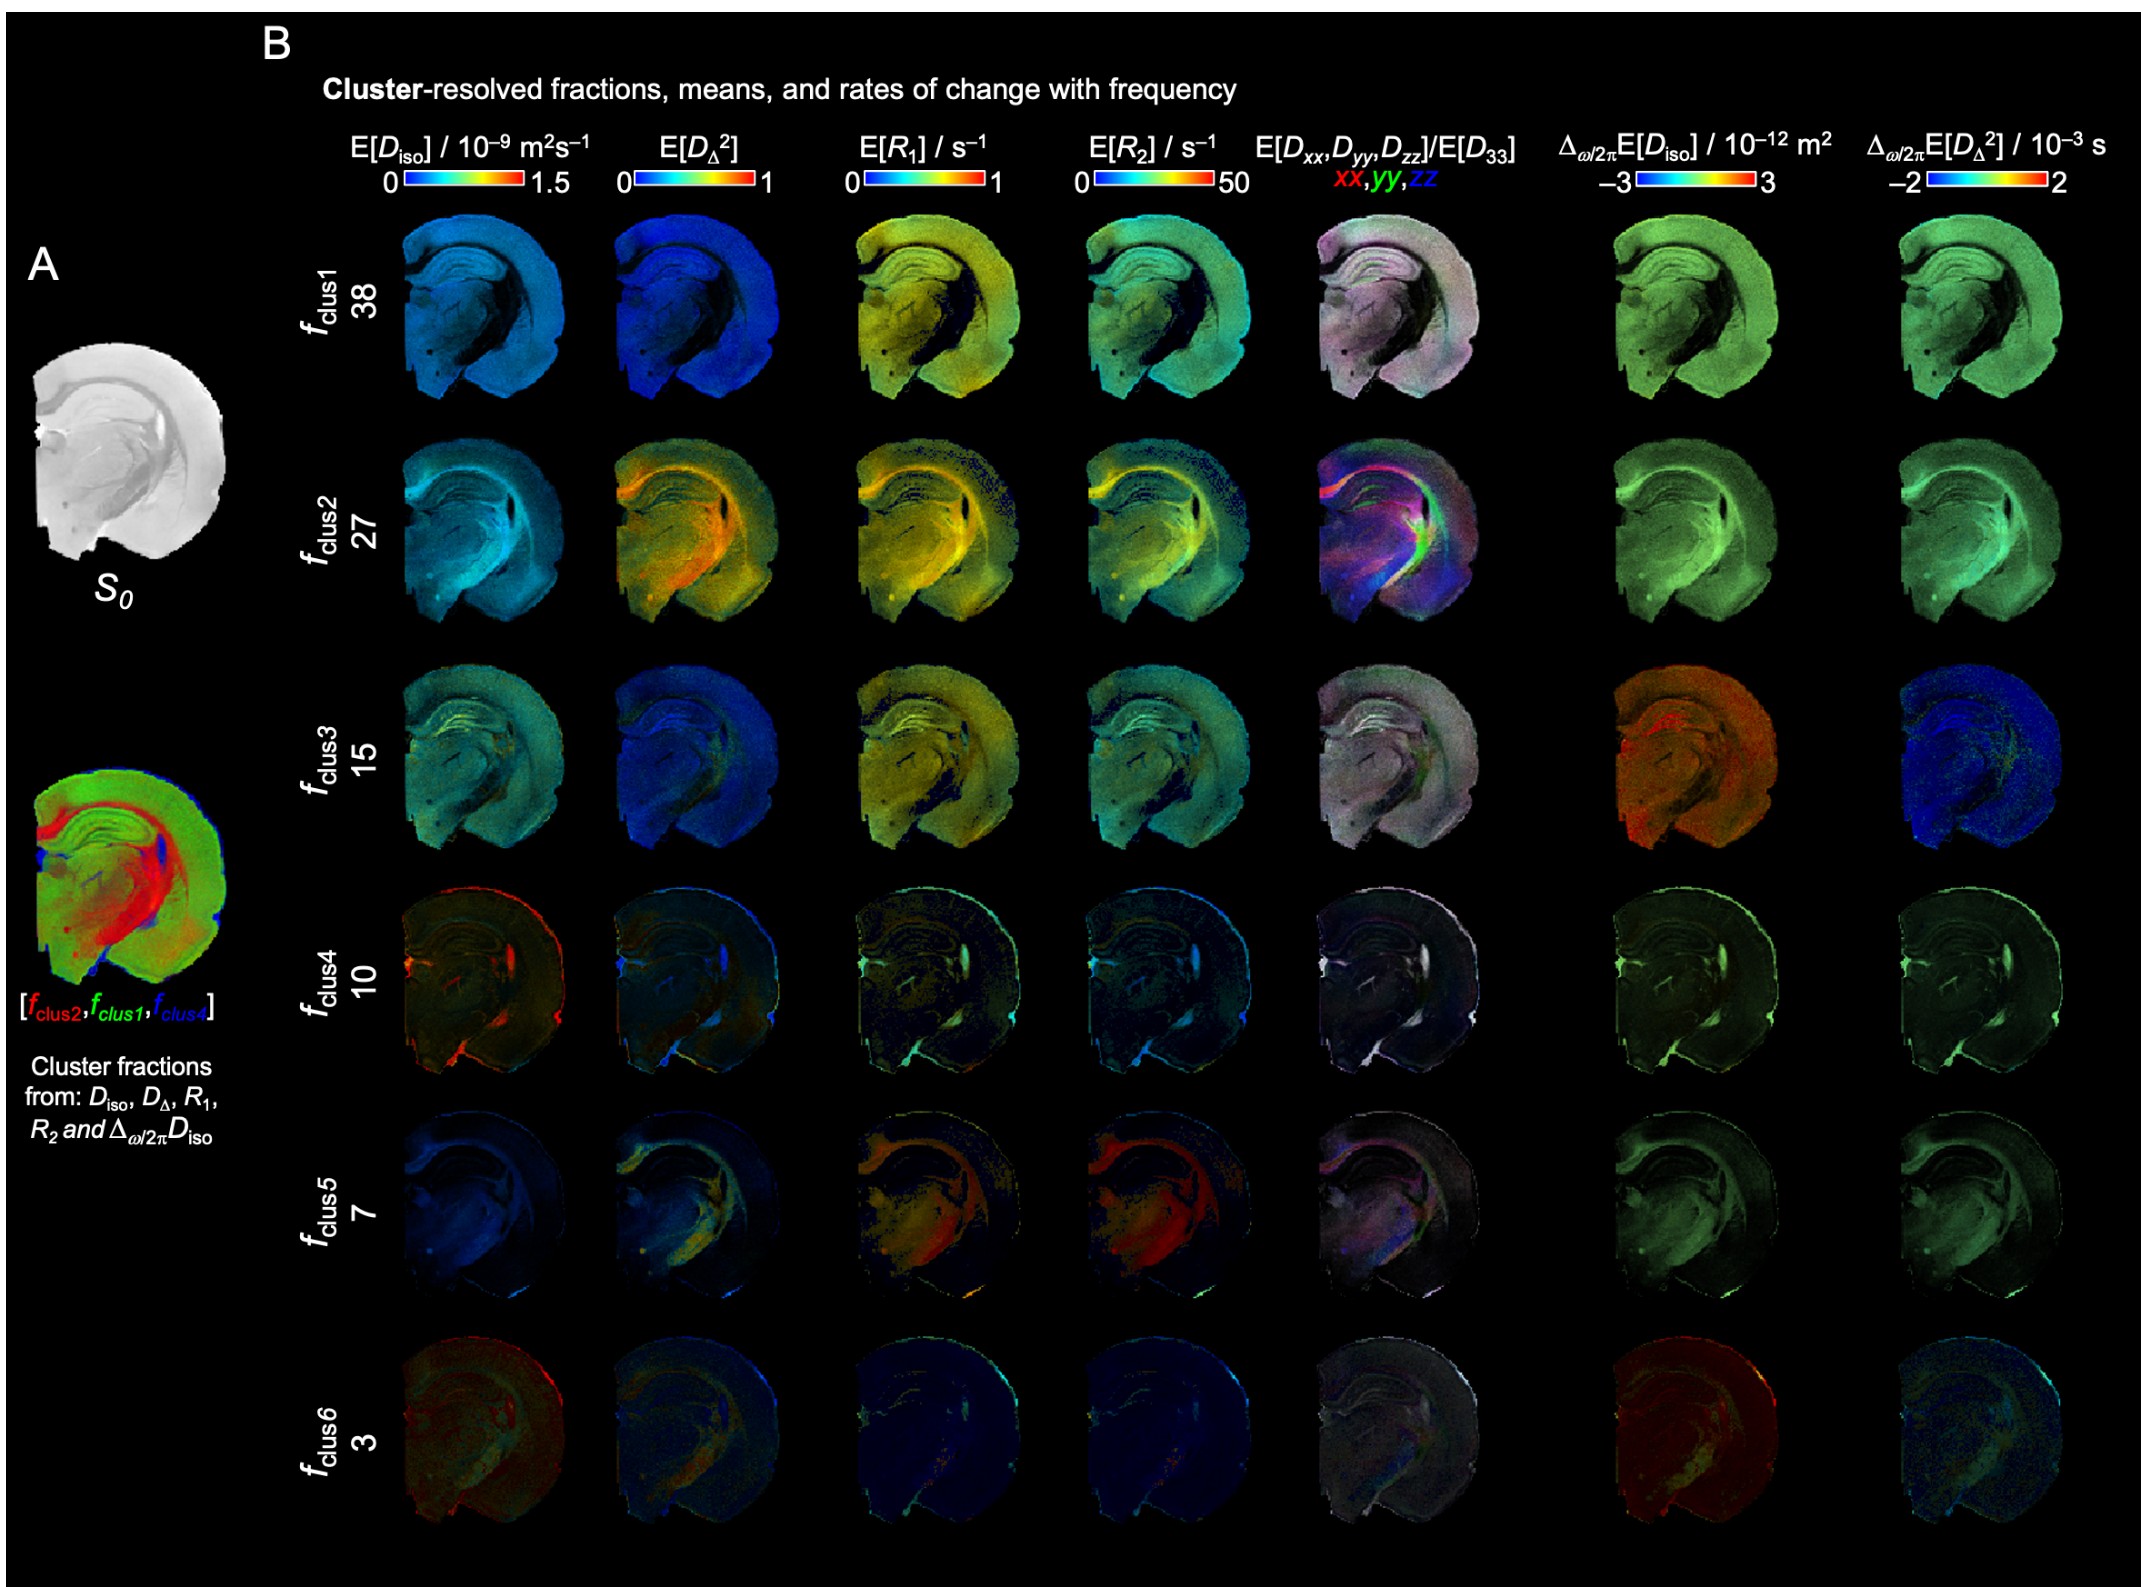
Cluster-resolved (k=6) mean maps derived from D(ω)-R1-R2 distributions. (A) S0 map displayed in gray scale and unsupervised cluster-resolved fractions by setting k=6 using the Diso, DΔ, R1, R2 and Δω/2πDiso distributions in RGB color. The cluster fractions selected to display the RGB color-coded WM, GM and FW fractions are cluster 2, 1 and 4, respectively. (B) Cluster-resolved parametric maps for each cluster fraction. The cluster fractions are ordered from higher to lower percentage of data belonging to each cluster.
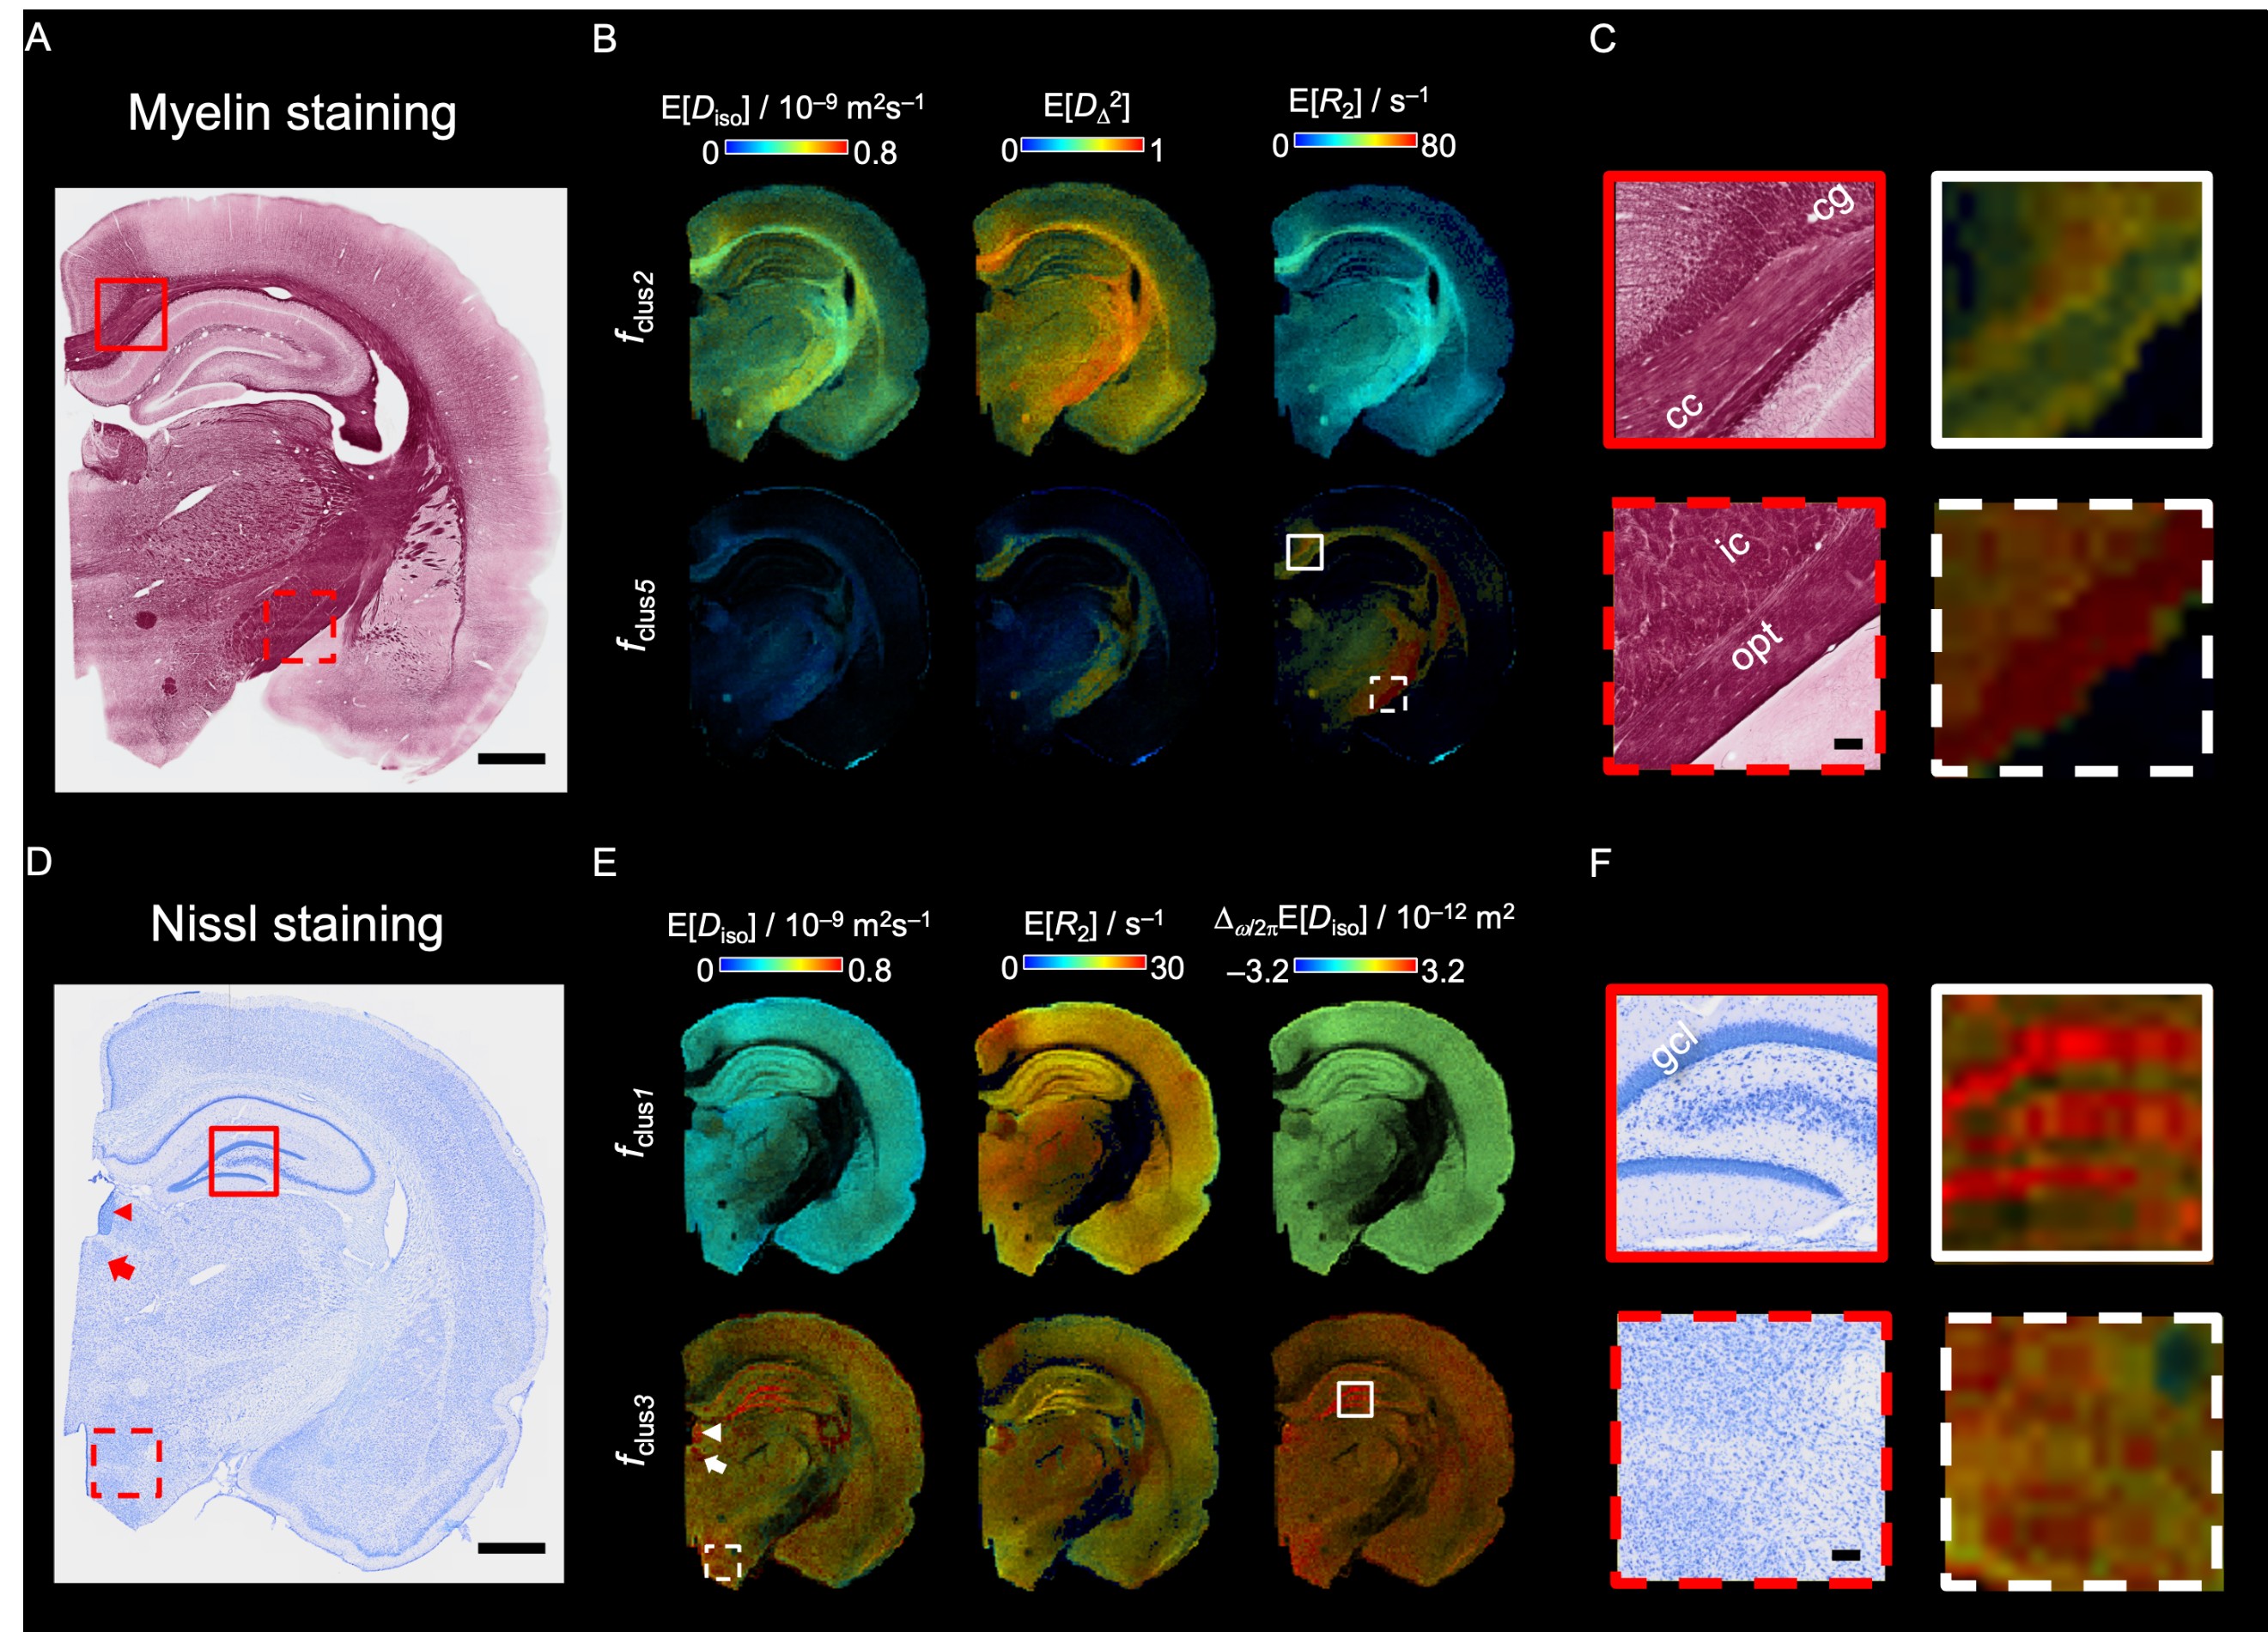
Histology and cluster-resolved parameter maps comparison from k=6 using Diso, DΔ, R1, R2 and Δω/2πDiso distributions. (A) Myelin stained section. (B) Representative cluster-resolved maps (Diso, DΔ2, and R2) from Fig. 3. (C) Close up to 2 different WM regions: corpus callosum (cc) and cingulum (cg); internal capsule (ic) and optic nerve (opt). (D) Nissl stained section. (E) Representative cluster-resolved maps. The white arrowhead points to the MHb nucleus, and the white arrow to the PVP nucleus. (F) Close up to 2 different GM regions: gcl; VMH.