0638
Clinical evaluation of spine disorders using high contrast cartilaginous endplate imaging1UCSD, San Diego, CA, United States, 2Radiology Service, Veterans Affairs San Diego Healthcare System, San Diego, CA, United States, 3Dept of Bioengineering, UCSD, San Diego, CA, United States
Synopsis
Keywords: Other Musculoskeletal, MSK
Motivation: Lower back pain is a common cause of ailment driven by disc degeneration and endplate defects. Imaging the CEP region would increase the diagnostic accuracy of early detection.
Goal(s): To develop an optimized sequence to image the CEP that is readily translatable to clinical settings.
Approach: The clinically available 3D FS-SPGR sequence was optimized and applied to image the CEP with high contrast for both asymptomatic and symptomatic subjects.
Results: The optimized 3D FS-SPGR sequence with T1-weighting can delineate the CEP regions with high contrast and reveal irregularities that are not visible on routinely used protocols.
Impact: The fast T1-weighted 3D FS-SPGR sequence can be readily implemented on clinical scanners, used to highlight the CEP, and shows promise for the detection of intervertebral disc abnormalities.
Introduction
Low back pain is a prevalent condition often associated with spinal degeneration or injury (1). The cartilaginous endplate (CEP) is a thin layer of hyaline-like cartilage situated between the intervertebral disc and its adjacent vertebral endplates, predominantly comprised of type II collagen, proteoglycans, and water (2,3). The CEP plays a pivotal role as a conduit for nutrient transport, ensuring the nourishment of disc cells, which is paramount for sustaining disc health (4). It has been recognized that abnormalities of the CEP region may be a potential source of back pain (5). Thus, there is a need to evaluate the CEP region non-invasively.However, conventional MRI sequences cannot capture sufficient signals from this short T2 tissue. Ultrashort echo time (UTE) sequences, with echo times more than 100 times shorter than conventional clinical sequences, have successfully been applied for CEP imaging (6). However, UTE sequences may not be readily available in clinical practice. In light of this, we have optimized a widely available technique, namely the 3D fat-suppressed spoiled gradient echo (FS-SPGR) sequence, to enhance imaging contrast of the CEP, thus facilitating routine clinical application.
Materials and Methods
Thirty patients with lower back pain (mean age: 58±12 years old, 43% female) and eight asymptomatic controls (mean age: 30 ± 4 years old, 38% female) were scanned with a commercially available 3D FS-SPGR sequence on a 3T clinical MRI scanner (MR750, GE). A four-channel phased array spine coil was utilized for signal reception. Figure 1 shows the sequence diagram of the 3D FS-SPGR.A strong T1 contrast was produced using this sequence with a high FA and relatively short TR. This sequence, leveraging the significant disparity between the T1 relaxation times of the CEP (i.e., ~400ms) and the nucleus pulposus (NP), effectively accentuated the CEP signal intensity relative to the NP. The product SPECtral Inversion At Lipid (SPECIAL) technique was used for fat suppression. A minimum TE was used in order to capture sufficient signals from the short T2 CEP (T2 of ~15ms). Routinely used clinical spine imaging sequences including chemical fat-suppressed (FS) T2w-FSE and non-FS T1w-FSE techniques were also scanned for comparison. The parameters of the FS-SPGR sequence were TR/TE=5.1/2.0ms, FOV=28×28×9.6 cm3, matrix=512×512×36, flip angle (FA)=25°, NEX=1, and scan time=24s.
In the context of imaging healthy volunteers, the FS-SPGR sequence was conducted three times, encompassing a single breath-hold scan and two free-breathing scans. The sequence parameters remained consistent, except that one of the free-breathing scans was executed with an NEX of 4 to enhance signal-to-noise ratio (SNR) performance. For the patient scans, solely the free-breathing scan with an NEX of 4 was performed, as it yielded the highest image quality.
Results and Discussion
Figure 2 shows representative lumbar spine images acquired using the 3D FS-SPGR sequence from an asymptomatic control subject. The FS T2w-FSE and non-FS T1w-FSE images are unable to capture the CEP signals due to their relatively long TE. The CEP regions are visually accentuated in the FS-SPGR images obtained with and without breath-hold. It is worth noting that although the breath-hold scan provides a sharper background compared to the free-breathing scan with NEX of 1, its signal-to-noise ratio (SNR) is relatively low. To enhance SNR performance, NEX was increased to 4 for the free-breathing scan, yielding the highest quality CEP imaging.Figure 3 shows the FS-SPGR images of two patients suffering from lower back pain. Similar to the control study, clinical sequences fail to capture signals from the CEP region due to their relatively long TEs. In contrast, the 3D FS-SPGR sequence distinctly delineates the CEP regions from the vertebral body and intervertebral disc. Additionally, the FS-SPGR images reveal abnormalities in the CEP region.
Figure 4 presents FS-SPGR images from two female patients with low back pain. In contrast to the conventional clinical sequences, the FS-SPGR sequence effectively captures succinct CEP irregularities as thin and fissured regions. Focal discontinuities of CEP are also observed on the superior L5 and inferior L4.
These findings demonstrate that the optimized 3D FS-SPGR sequence can emphasize the CEP region and detect CEP abnormalities in patients, showing promise for clinical diagnosis of low back pain.
Conclusion
The commercially accessible 3D FS-SPGR sequence is proficient at generating high-contrast imaging of the CEP for the evaluation of spinal disorders. FS-SPGR can effectively discern CEP abnormalities that remain imperceptible in standard clinical FS T2w- and non-FS T1w-FSE sequences.Acknowledgements
The authors acknowledge grant support from National Institutes of Health (F32AG082458-01, K01AR080257, R01AR062581, R01AR068987, R01AR075825, and R01AR079484, and RF1AG075717), VA Research and Development Services (I01CX001388, I01CX002211, I01CX000625 and I01BX005952), and GE Healthcare.References
1. Andersson GB. Epidemiological features of chronic low- back pain. Lancet 1999;354:581-5.
2. Moon, Sung M., et al. "Evaluation of intervertebral disc cartilaginous endplate structure using magnetic resonance imaging." European Spine Journal 22 (2013): 1820-1828.
3. Urban, Jill P.G. PhD; Smith, Stanton DPhil; Fairbank, Jeremy C.T. MD, FRCS. Nutrition of the Intervertebral Disc. Spine 29(23):p 2700-2709,
4. Hwang D, et al. Quantitative magnetic resonance imaging of the lumbar intervertebral discs. Quant Imaging Med Surg. 2016;6:744–755. doi: 10.21037/qims.2016.12.09. - DOI
5. Fields AJ, Liebenberg EC, Lotz JC. Innervation of pathologies in the lumbar vertebral end plate and intervertebral disc. Spine J 2014;14:513-21.
6. Lombardi AF, Wei Z, Wong J, et al. High contrast cartilaginous endplate imaging using a 3D adiabatic inversion-recovery-prepared fat-saturated ultrashort echo time (3D IR-FS-UTE) sequence. NMR Biomed. 2021;34(10):1-11. doi:10.1002/nbm.4579Figures
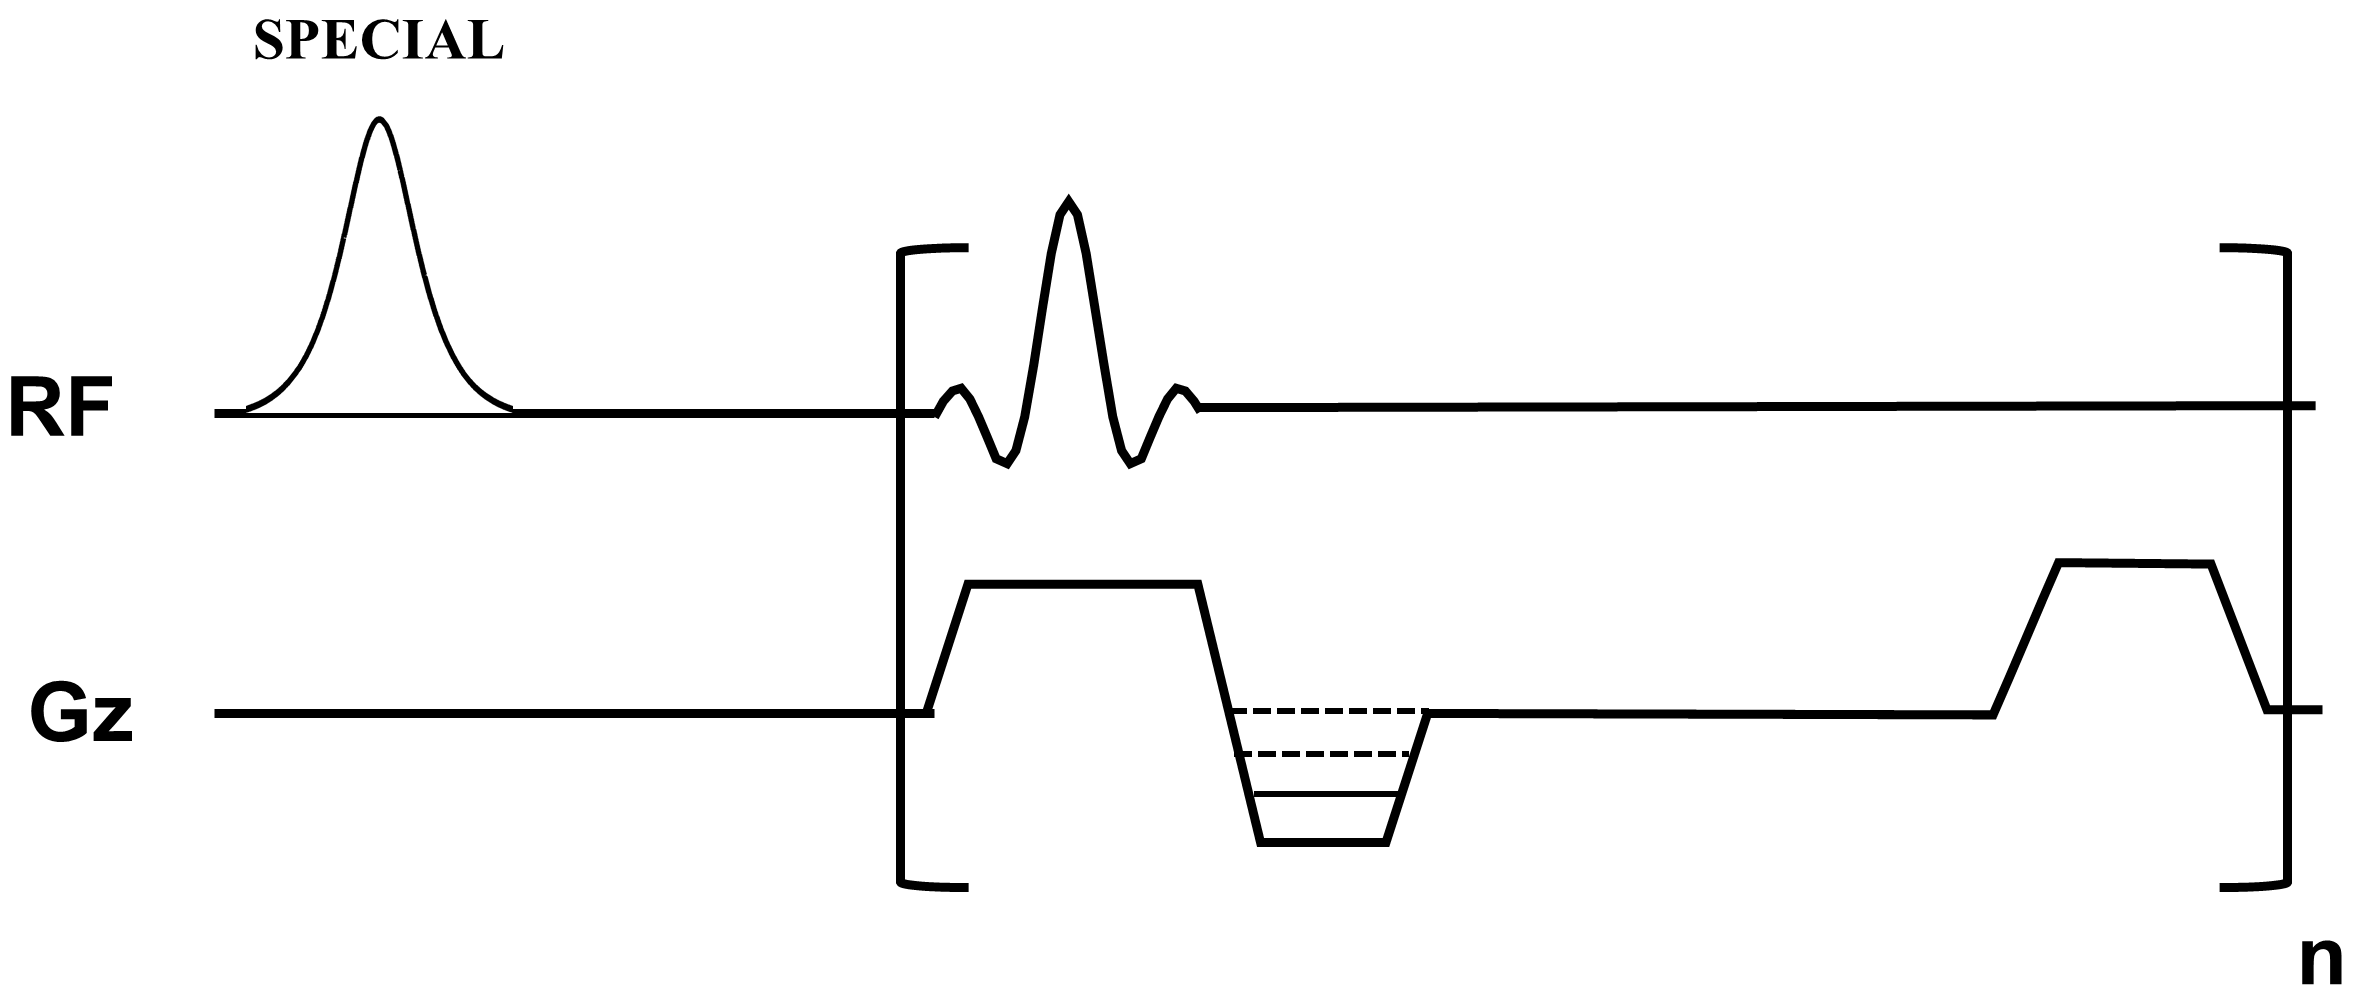
Figure 1. Sequence diagram of the 3D fat suppressed spoiled gradient echo (FS-SPGR) sequence. The product SPECtral Inversion At Lipid (SPECIAL) technique was used for fat suppression.
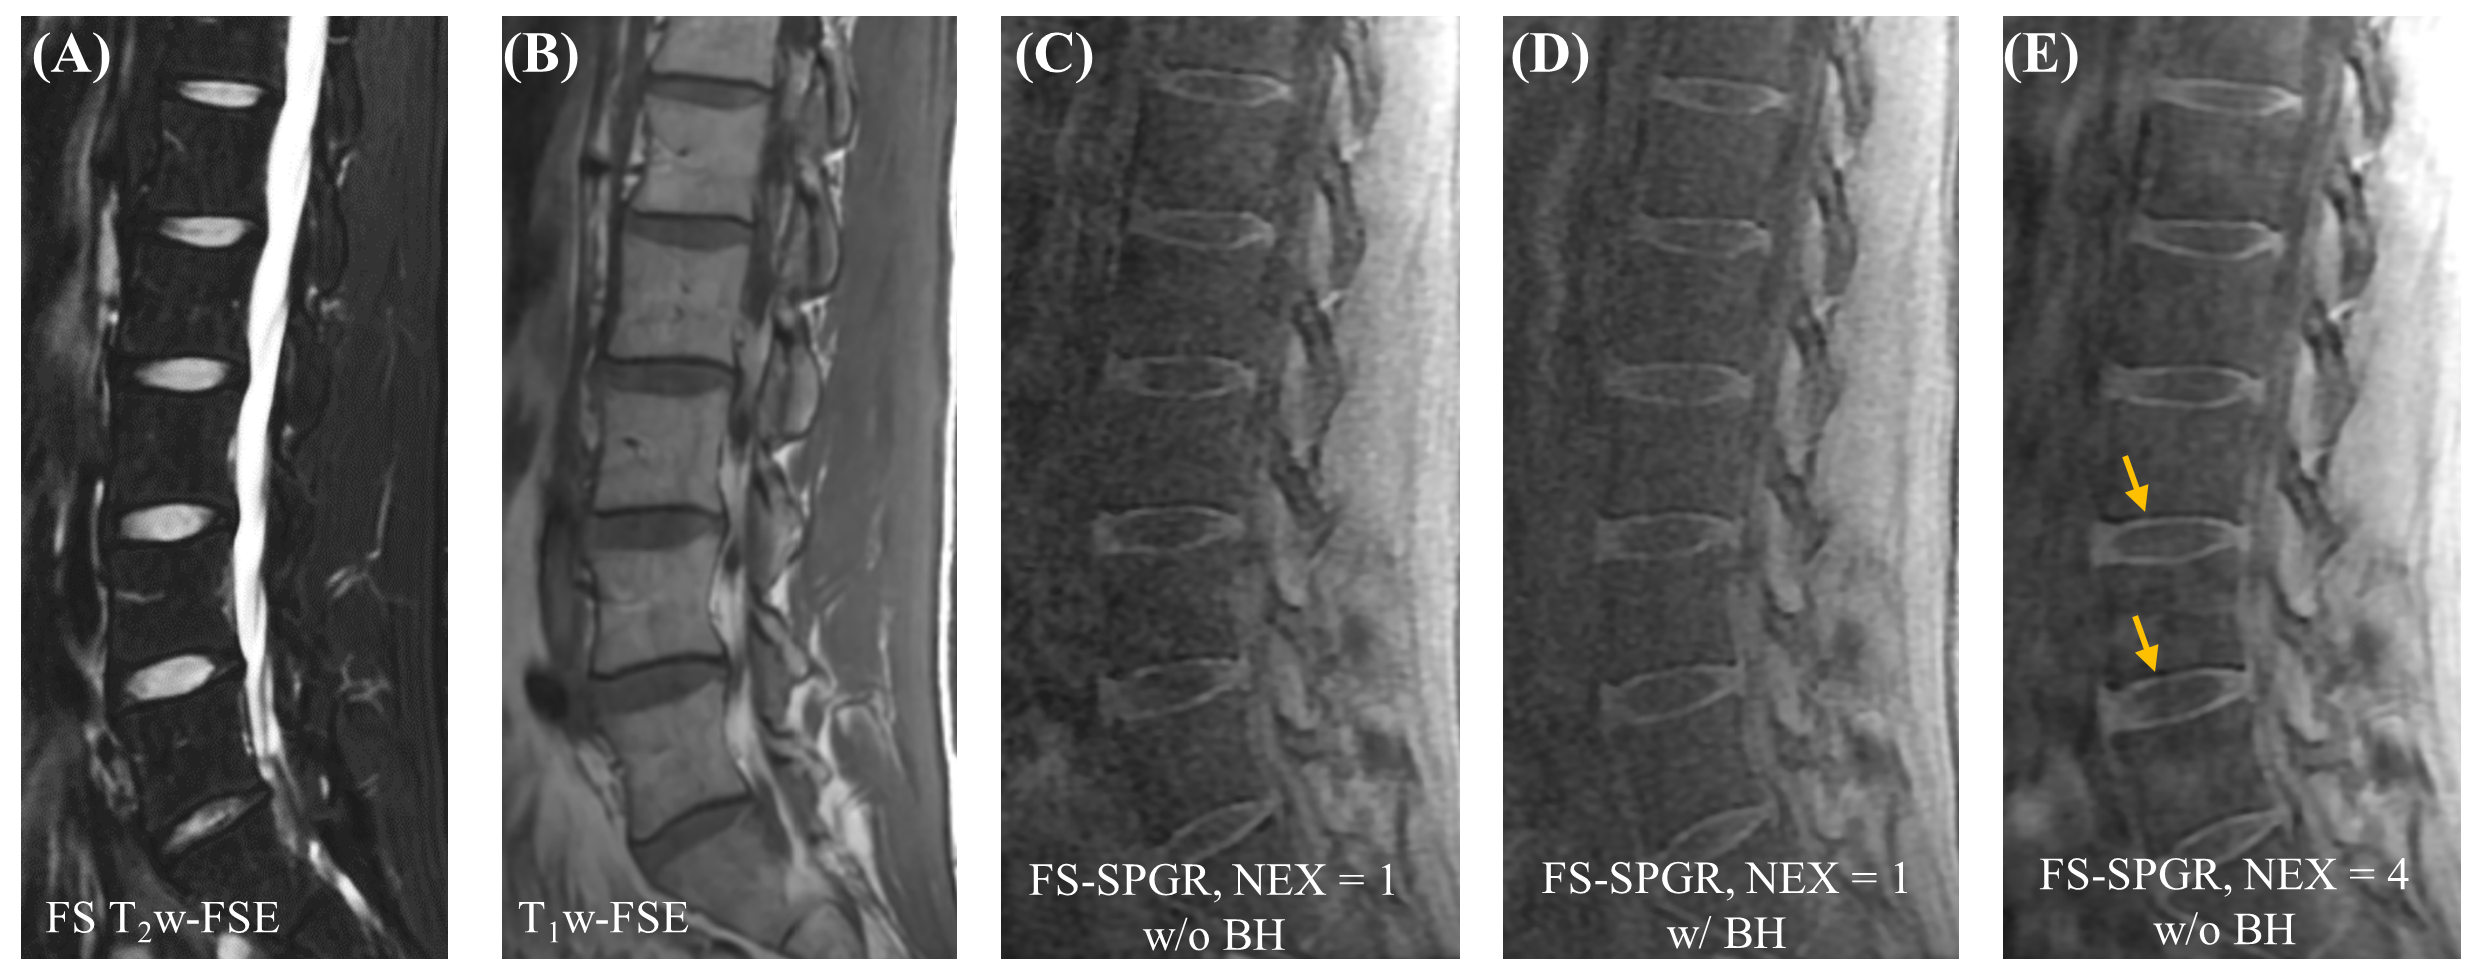
Figure 2. Clinical FS T2w-FSE (A) and T1w-FSE (B) images as well as 3D FS-SPGR images (C-D) from a 32-year-old healthy man. Panels C and D show the single NEX FS-SPGR images without and with breath-hold (BH). To improve the SNR, NEX was increased to 4 for the free breathing scan (E), with arrows pointing towards the high contrast CEP region.
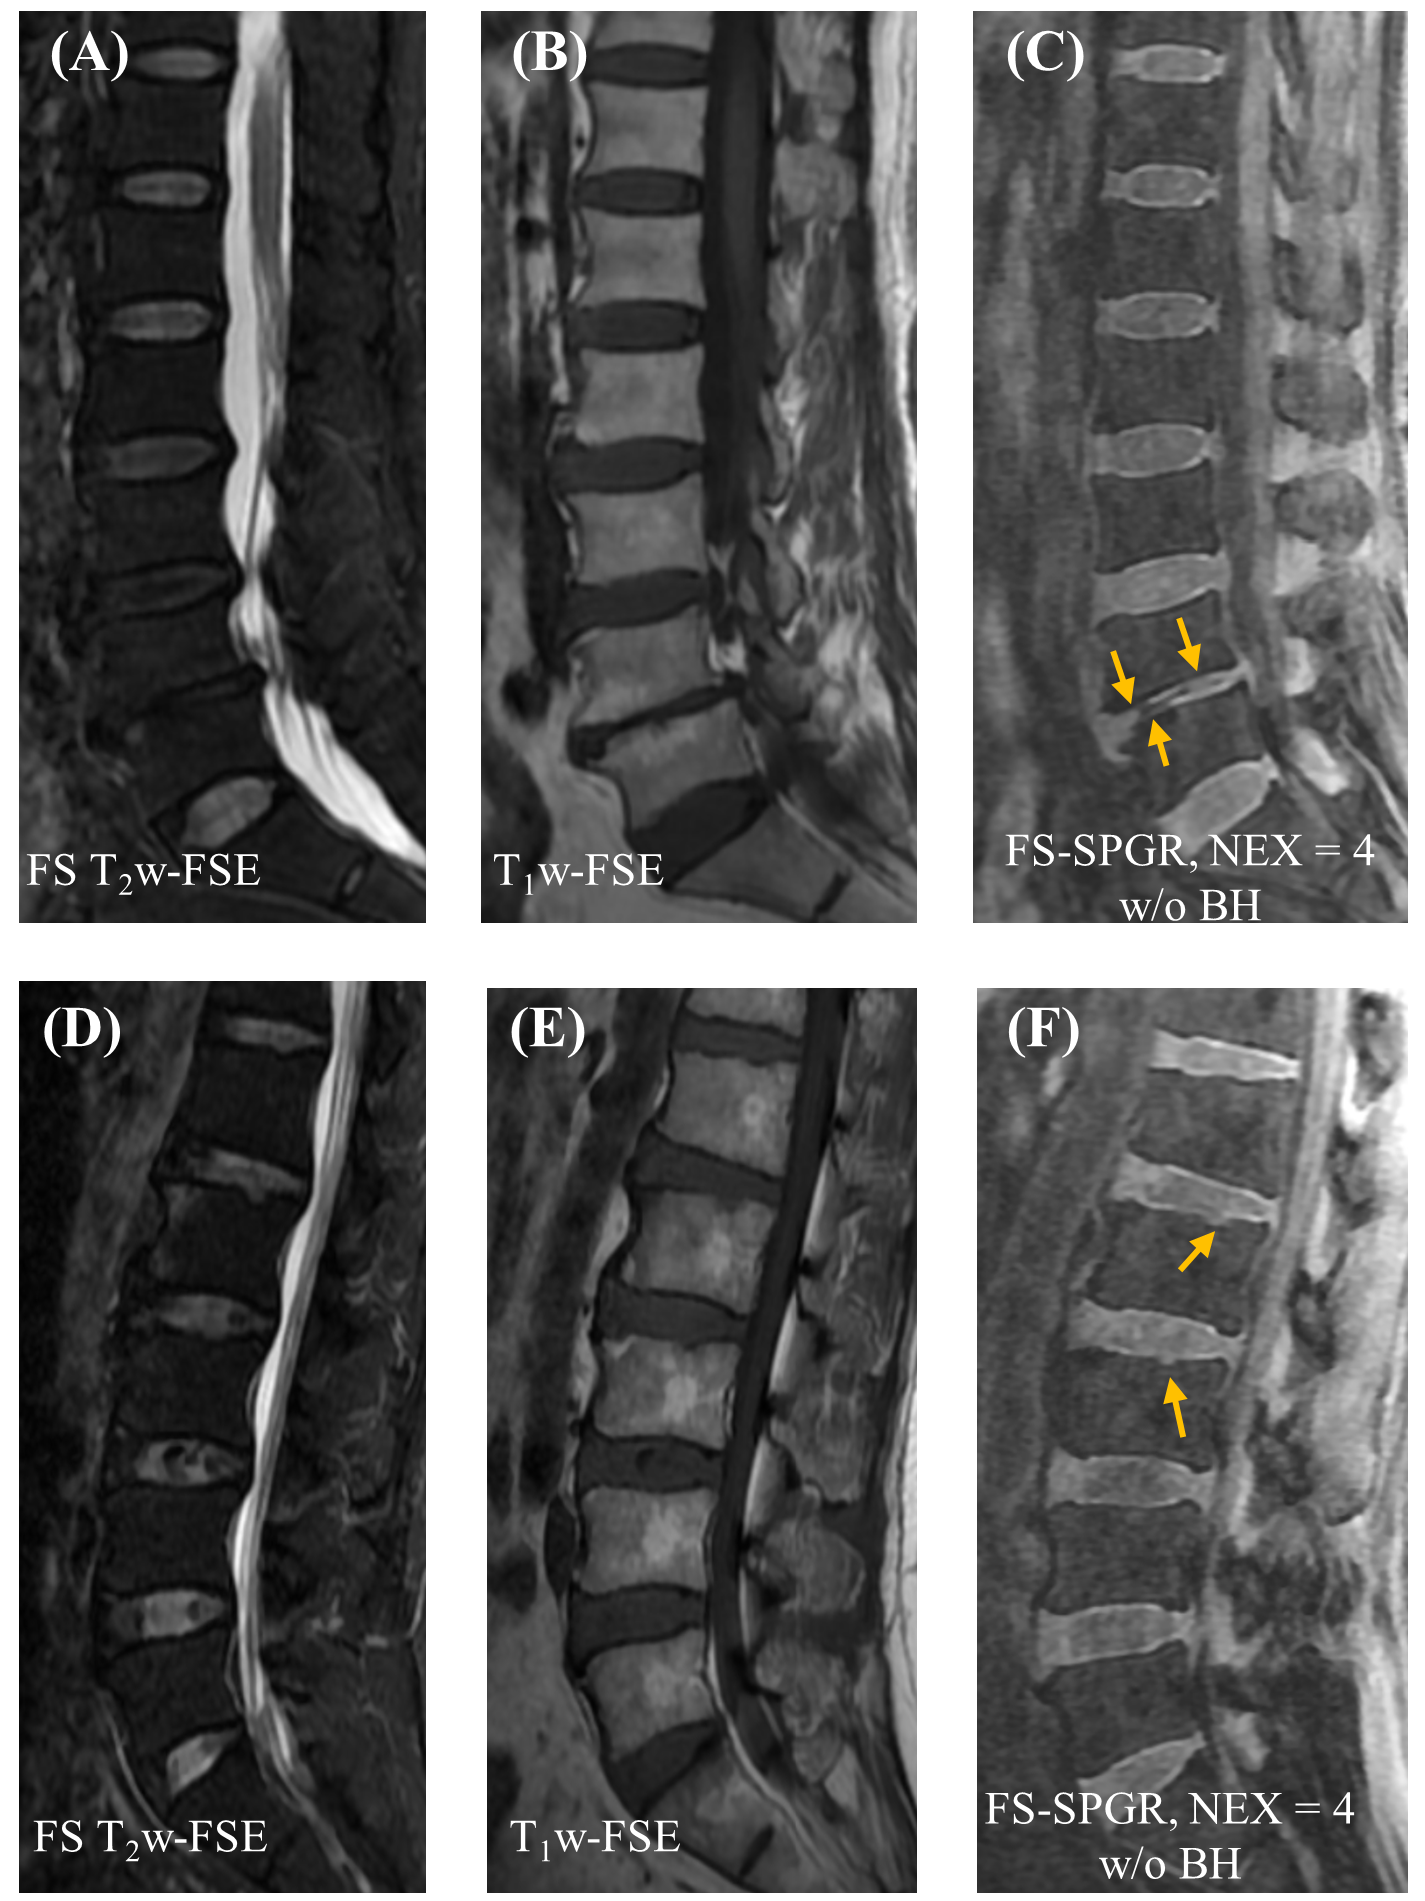
Figure 3. Clinical FS T2w-FSE (A, D) and T1w-FSE (B, E) images as well as 3D FS-SPGR (C, F) images acquired from two patients with lower back pain (first row: 67-year-old woman; second row: 61-year-old man). Abnormalities in the CEP region are evident on the 3D FS-SPGR images, including segments that are absent (arrows in panel C) and focal areas of loss corresponding to Schmorl’s nodes (arrows in panel F).
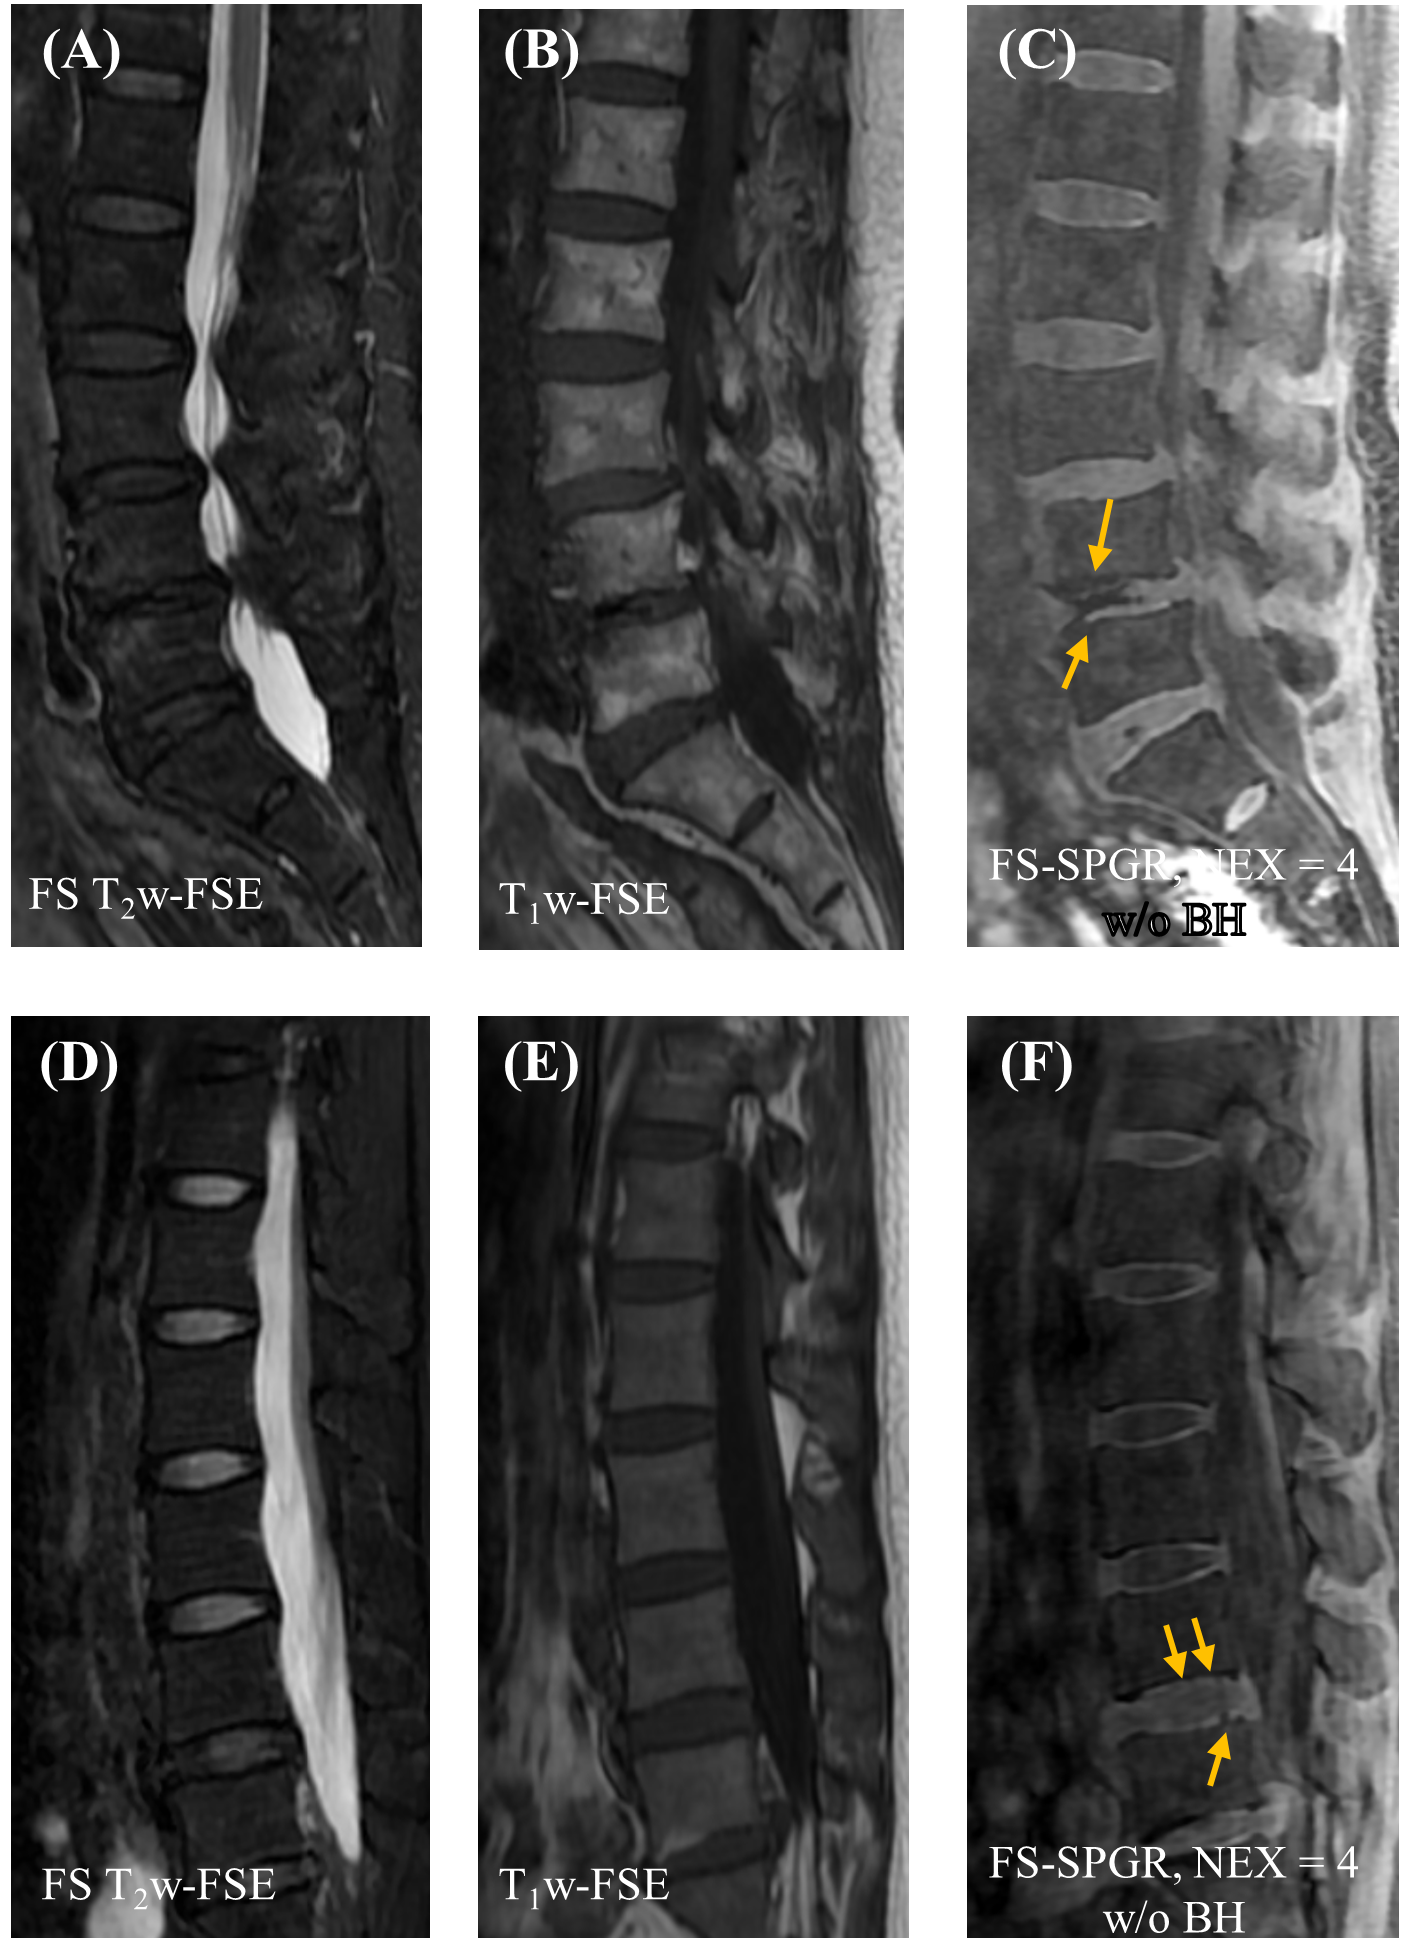
Figure 4. Clinical FS T2w-FSE (A, D) and T1w-FSE (B, E) images as well as 3D FS-SPGR (C, F) images acquired from two patients with lower back pain (first row: 70-year-old woman; second row: 46-year-old woman). The CEP region is thin and fissured and is marked by the arrows depicted in panels C and F respectively.