0637
Quantitative UTE Imaging of Zonal Difference in Meniscus1Shu Chien-Gene Lay Department of Bioengineering, University of California, San Diego, San Diego, CA, United States, 2Department of Radiology, University of California, San Diego, San Diego, CA, United States, 3Radiology Service, Veterans Affairs San Diego Health Care System, San Diego, CA, United States
Synopsis
Keywords: Quantitative Imaging, Cartilage, Meniscus
Motivation: Quantitative MR imaging techniques could reveal compositional differences between red and white zones in menisci. Unfortunately, this type of analysis may not be possible using conventional sequences due to the rapid signal decay of menisci.
Goal(s): The study aimed to investigate whether quantitative UTE imaging techniques could detect the zonal difference between the red and white zones in menisci.
Approach: UTE imaging techniques, including UTE-T1, UTE-MT modeling, UTE-AdiabT1ρ, and UTE-T2*, were used to assess menisci in vivo quantitatively.
Results: T1, MMF, and T2* values in the red zone are significantly lower than those in the white zone.
Impact: Our qUTE MRI techniques enable a quantitative, zonal, and compositional analysis of menisci in vivo, which is valuable in helping understand the role of menisci in the pathogenesis of complex diseases such as osteoarthritis.
Introduction
Menisci play a crucial role in the knee joint and is an exciting research target for osteoarthritis pathogenesis1–4. Because menisci only have blood supply in their peripheral regions, they can be segmented into three different regions: red-red, red-white, and white-white zones. The red-red zone, located in the most peripheral region of the meniscus’s crescent shape, is the most vascularized. The red-white and the white-white zones have little to no vascularization, respectively.1,5 Aside from vascularity, other important features characterize these distinct zones, including biochemical composition differences such as which collagen types compose the matrix and which cell types inhabit the matrix1,5,6Clinical MRI has been routinely used for screening meniscal tears. However, due to the rapid signal decay of menisci, quantitative zonal evaluation of the meniscus may not be possible using the clinical MR sequences. Ultrashort echo time (UTE) techniques with echo times at least 100 times shorter than clinical sequences allow for the acquisition of fast-decaying signals from tissues such as the meniscus. In this study, we aimed to investigate the compositional difference between different vascular regions of menisci comprehensively using quantitative UTE imaging techniques, including UTE variable flip angle (UTE-VFA) technique for T1 mapping 7, UTE magnetization transfer modeling (UTE-MT) for macromolecular proton fraction (MMF) mapping 8, UTE adiabatic T1ρ (UTE-AdiabT1ρ) sequence for T1ρ mapping 9, and multi-echo UTE sequence for T2* mapping 10.
Methods
Figure 1 shows diagrams of the quantitative UTE imaging sequences used. 15 healthy volunteers with a mean age of 32±7 years were scanned on a 3T GE MR750 scanner.The field of view and matrix size for each knee joint scan were 15×15×10 cm3 and 256×256×36, respectively. Other sequence parameters of the quantitative UTE imaging protocols were: A) 3D UTE-AFI sequence: TR1/TR2/TE = 20/100/0.032ms and flip angle (FA) = 45°; and B) 3D UTE-VFA sequence: FAs = 5°, 10°, 20°, and 30° and repetition time (TR)/echo time (TE) = 20/0.032ms; C) 3D UTE-MT sequence: MT pulse FAs = 500°, 1000°, and 1500°, MT pulse frequency offsets = 2, 5, 10, 20, and 50kHz, TR/TE = 100/0.032ms, FA = 7°, number-of-spokes per-TR (Nsp) = 11, and spoke interval (τ) = 6ms; D) 3D UTE-AdiabT1ρ sequence: spin lock times (TSLs) = 0, 12, 24, 36, 48, 72, and 96ms corresponding to the number of adiabatic full passage (AFP) pulses = 0, 2, 4, 6, 8, 12, and 16, TR/TE = 400/0.032ms, FA = 10°, Nsp = 27, and τ = 5.2ms; E) 3D multi-echo UTE sequence with an echo train of six: TEs = 0.032, 4.4, 8.8, 13.2, 22, and 35.2ms, TR = 100ms, and FA = 10°. With this protocol, T1, T1ρ, T2*, and MMF of menisci can be quantified.
Regions of interest (ROIs) were manually drawn on the anterior and posterior horns of the lateral menisci in sagittal knee image slices. Similar to Juras et al11, Red zone ROIs were drawn on the menisci’s highly vascularized (red-red) zones, while white zone ROIs were drawn on the remaining zones (red-white + white-white) 11. UTE-AdiabT1ρ subtraction images (0-24ms spin lock time (TSL)) with high signal contrast in the menisci were generated and used as a template for ROI drawing. Paired t-test was performed to investigate the statistical difference between the red and white zones for all four quantitative UTE measurements.
Results and Discussion
Representative UTE-T1, UTE-MT, UTE-AdiabT1ρ, and UTE-T2* images and clinical PD- and T2-FSE images are shown in Figure 2. As expected, meniscus signals were much higher in the UTE images than in the clinical images. Meniscus signals decayed quickly with longer TSLs and TEs in respective UTE-AdiabT1ρ and UTE-T2* images. Figure 3 shows representative ROIs and fitting curves for the red and white zones of the menisci. Figure 4 shows representative quantitative UTE maps of the meniscus and bar plots for the mean values of red and white zones from all 15 volunteers. The red zones showed significantly lower T1 (743±55ms vs 840±82ms), MMF (14.4±2.2% vs 17.34±1.4%), and T2* (8.9±1.1ms vs 11.2±1.9ms) values compared to the white zones. Our study demonstrates that the proposed UTE imaging protocol can comprehensively evaluate biochemical components in menisci. As shown from the UTE T1, MMF, and T2* measurements, compositional differences were observed between red and white zones. Applying this technique to draw comparisons between normal and OA volunteers would be a plausible and interesting future follow-up to this study.Acknowledgements
The authors acknowledge grant support from National Institutes of Health (R01AR062581, R01AR068987, R01AR075825, K01AR080257, R01AR079484, and RF1AG075717), VA Research and Development Services (Merit Awards I01CX001388, I01CX002211, and I01BX005952), DFG (SE 3272/1-1), and GE Healthcare.References
1. Fox AJS, Bedi A, Rodeo SA. The Basic Science of Human Knee Menisci: Structure, Composition, and Function. Sports Health 2012;4(4).
2. Englund M, Guermazi A, Lohmander SL. The Role of the Meniscus in Knee Osteoarthritis: a Cause or Consequence? Radiol Clin North Am. 2009;47(4).
3. Ozeki N, Koga H, Sekiya I. Degenerative Meniscus in Knee Osteoarthritis: From Pathology to Treatment. Life. 2022;12(4).
4. Loeser RF, Goldring SR, Scanzello CR, Goldring MB. Osteoarthritis: A disease of the joint as an organ. Arthritis Rheum. 2012;64(6).
5. Makris EA, Hadidi P, Athanasiou KA. The knee meniscus: Structure-function, pathophysiology, current repair techniques, and prospects for regeneration. Biomaterials. 2011;32(30).
6. Chan PSH, Kneeland JB, Gannon FH, Luchetti WT, Herzog RJ. Identification of the vascular and avascular zones of the human meniscus using magnetic resonance imaging: Correlation with histology. Arthroscopy 1998;14(8).
7. Ma YJ, Zhao W, Wan L, et al. Whole knee joint T1 values measured in vivo at 3T by combined 3D ultrashort echo time cones actual flip angle and variable flip angle methods. Magn Reson Med 2019;81(3).
8. Ma YJ, Chang EY, Carl M, Du J. Quantitative magnetization transfer ultrashort echo time imaging using a time-efficient 3D multispoke Cones sequence. Magn Reson Med 2018;79(2).
9. Ma YJ, Carl M, Searleman A, Lu X, Chang EY, Du J. 3D adiabatic T1ρ prepared ultrashort echo time cones sequence for whole knee imaging. Magn Reson Med 2018;80(4).
10. Chen B, Zhao Y, Cheng X, et al. Three-dimensional ultrashort echo time cones (3D UTE-Cones) magnetic resonance imaging of entheses and tendons. Magn Reson Imaging 2018;49.
11. Juras V, Apprich S, Zbýň Š, et al. Quantitative MRI analysis of menisci using biexponential T 2* fitting with a variable echo time sequence. Magn Reson Med 2014;71(3).
Figures
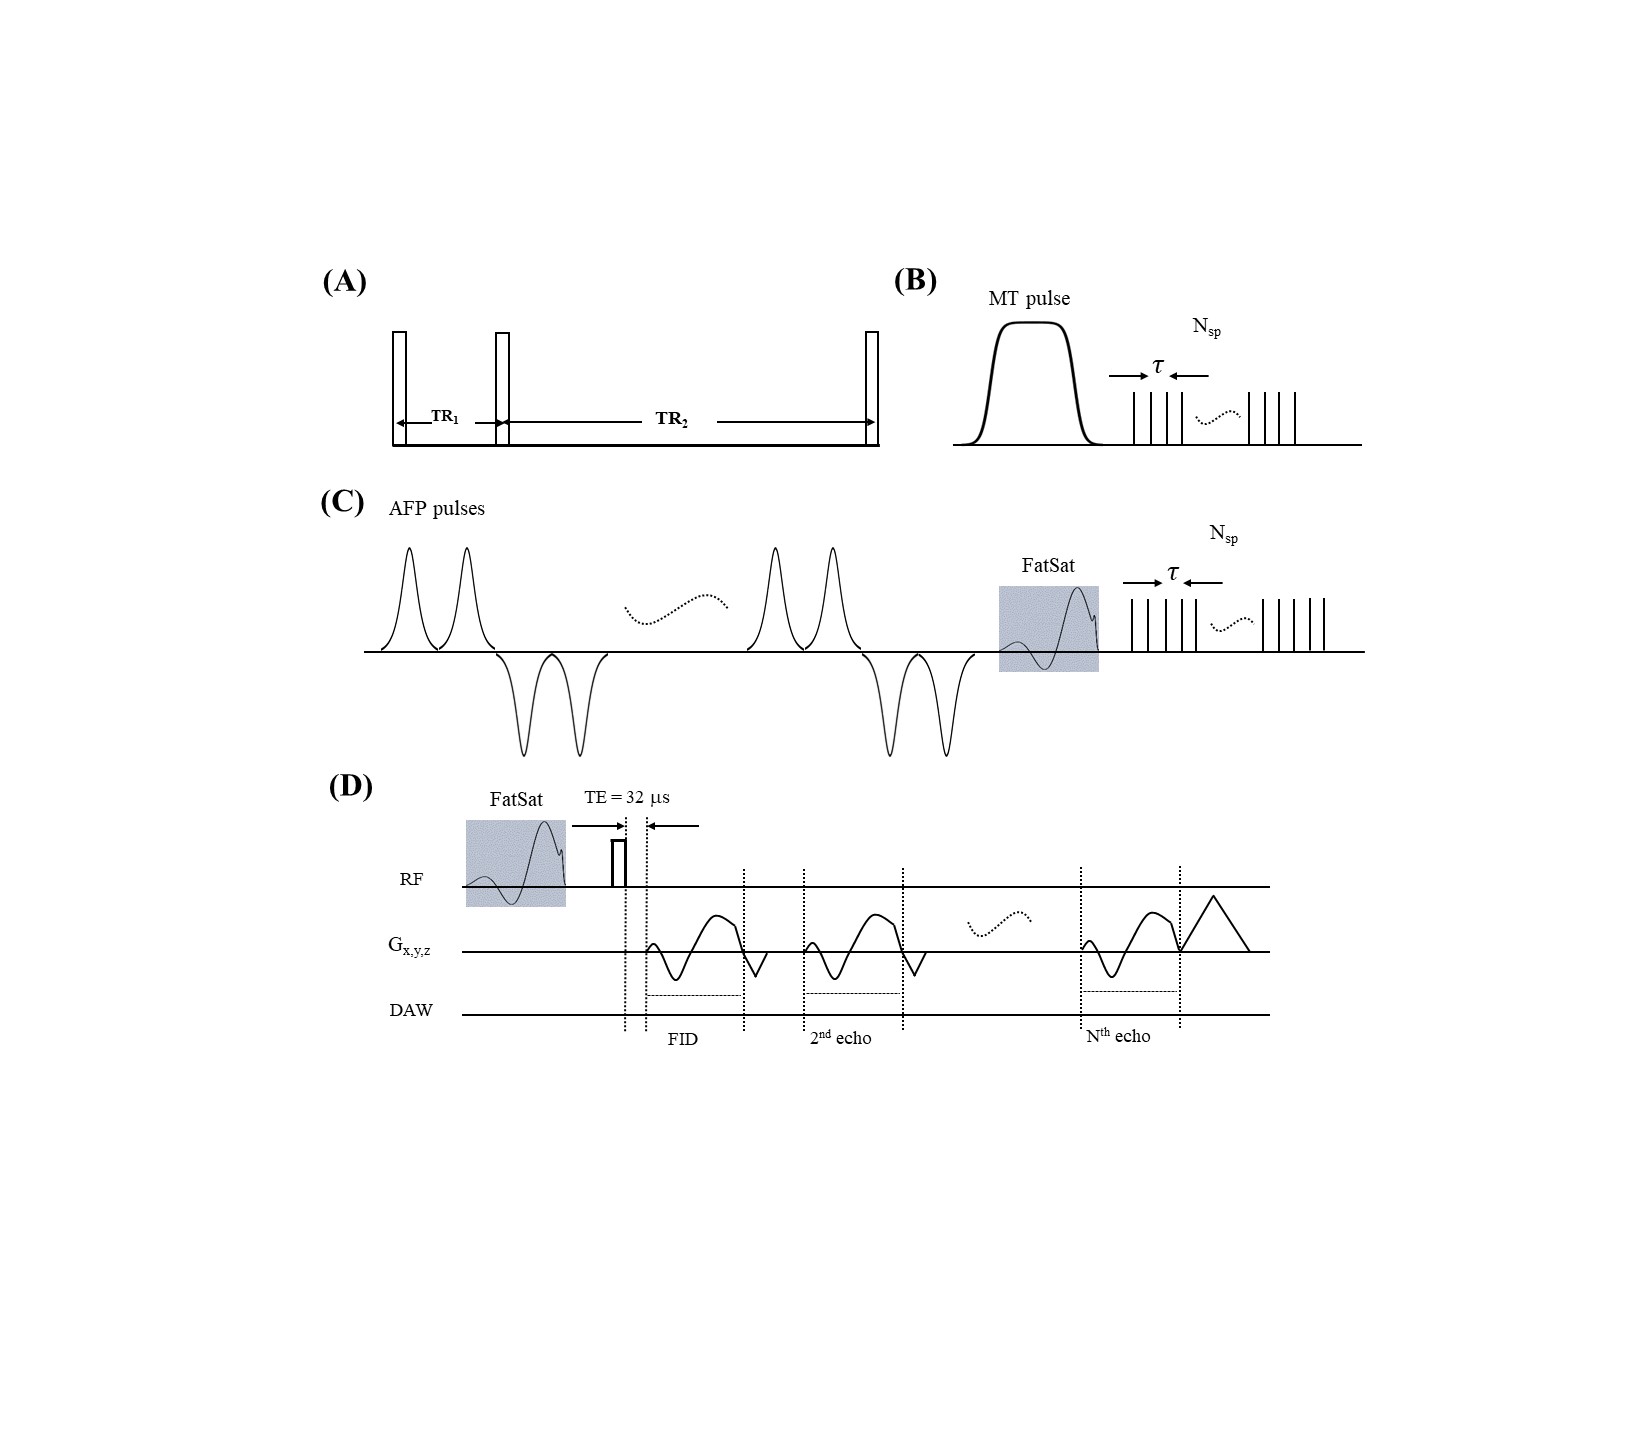
Figure 1. Quantitative 3D UTE sequences. The UTE-AFI sequence with interleaved TRs is used to measure and correct B1 inhomogeneity for all quantifications (A). A Fermi pulse with a duration of 8ms and a bandwidth of 160Hz is used to saturate the magnetization of the macromolecular proton pool to generate the MT contrast in UTE-MT (B). A train of AFP pulses is used to lock the spin to generate the T1ρ contrast in UTE-AdiabT1ρ (C). A multi-echo UTE sequence is used for T2* measurement (D). Fat saturation (FatSat) was applied to UTE-AdiabT1ρ and multi-echo UTE sequences for fat suppression.
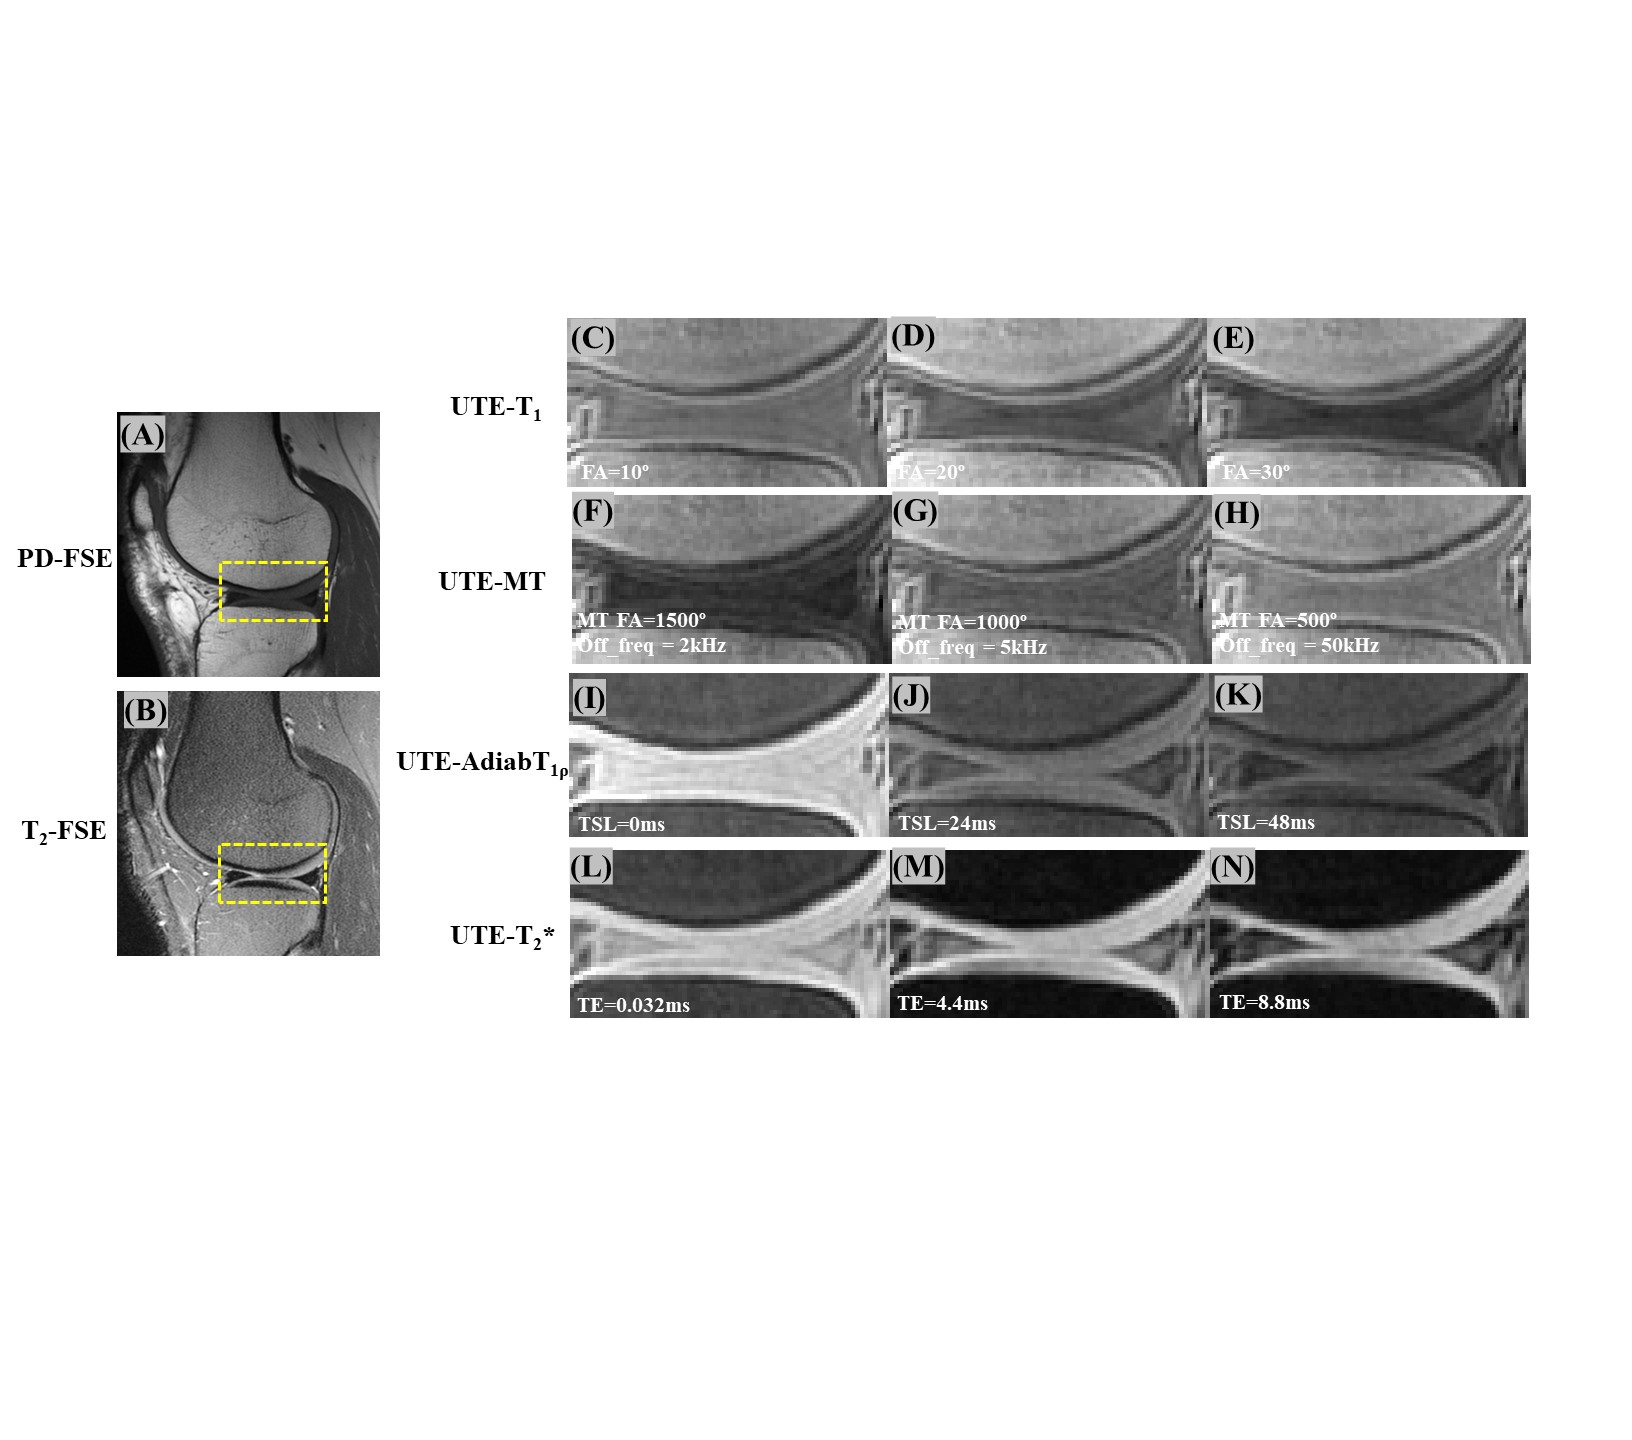
Figure 2. Representative clinical and UTE images from a 42-year-old male volunteer. The zoomed UTE images of the region inside of the yellow box (seen in A or B) show the menisci region at different contrast levels with four different techniques, including UTE-T1 (FAs of 10° (C), 20° (D), and 30° (E)), UTE-MT (MT FA=1500° and frequency offset=2kHz (F), MT FA=1000° and frequency offset=5kHz (G), and MT FA=500° and frequency offset=50kHz (H)), UTE-AdaibT1ρ (TSLs of 0 (I), 24 (J), and 48ms (K)), and UTE-T2* (TEs of 0.032 (L), 4.4 (M), and 8.8ms (N)).
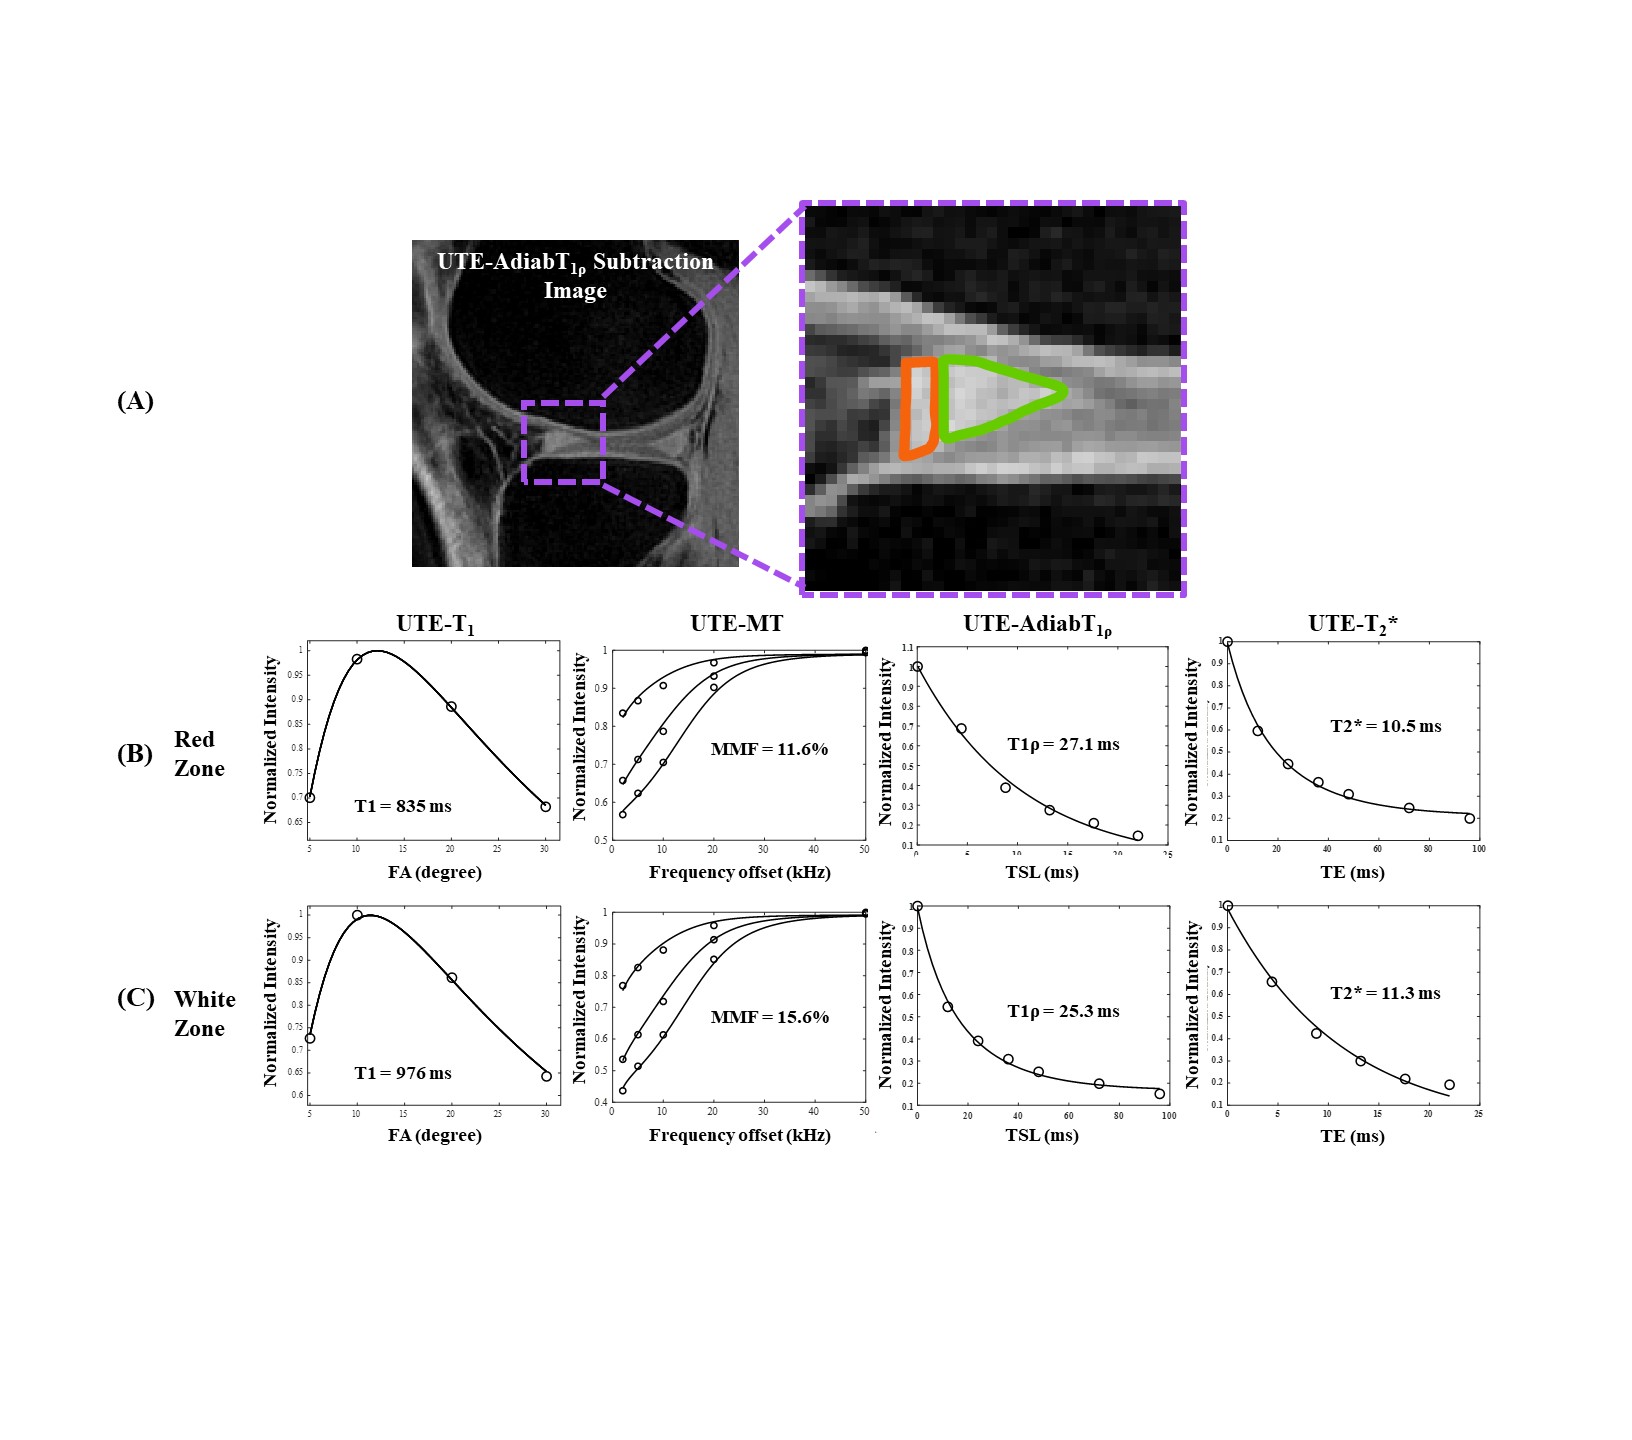
Figure 3. Representative curve fitting for all four quantitative UTE techniques with ROIs drawn in the highly vascularized red zone (the orange-outlined region in (A)) and non-vascularized white zone of the meniscus (the green-outlined region in (A)) on a healthy volunteer’s knee (42-year-old, male). The fitting curves of the UTE biomarkers of T1, T1ρ, T2*, and MMF are presented from the first to fourth column, respectively, for red (B) and white (C) zones of the meniscus.
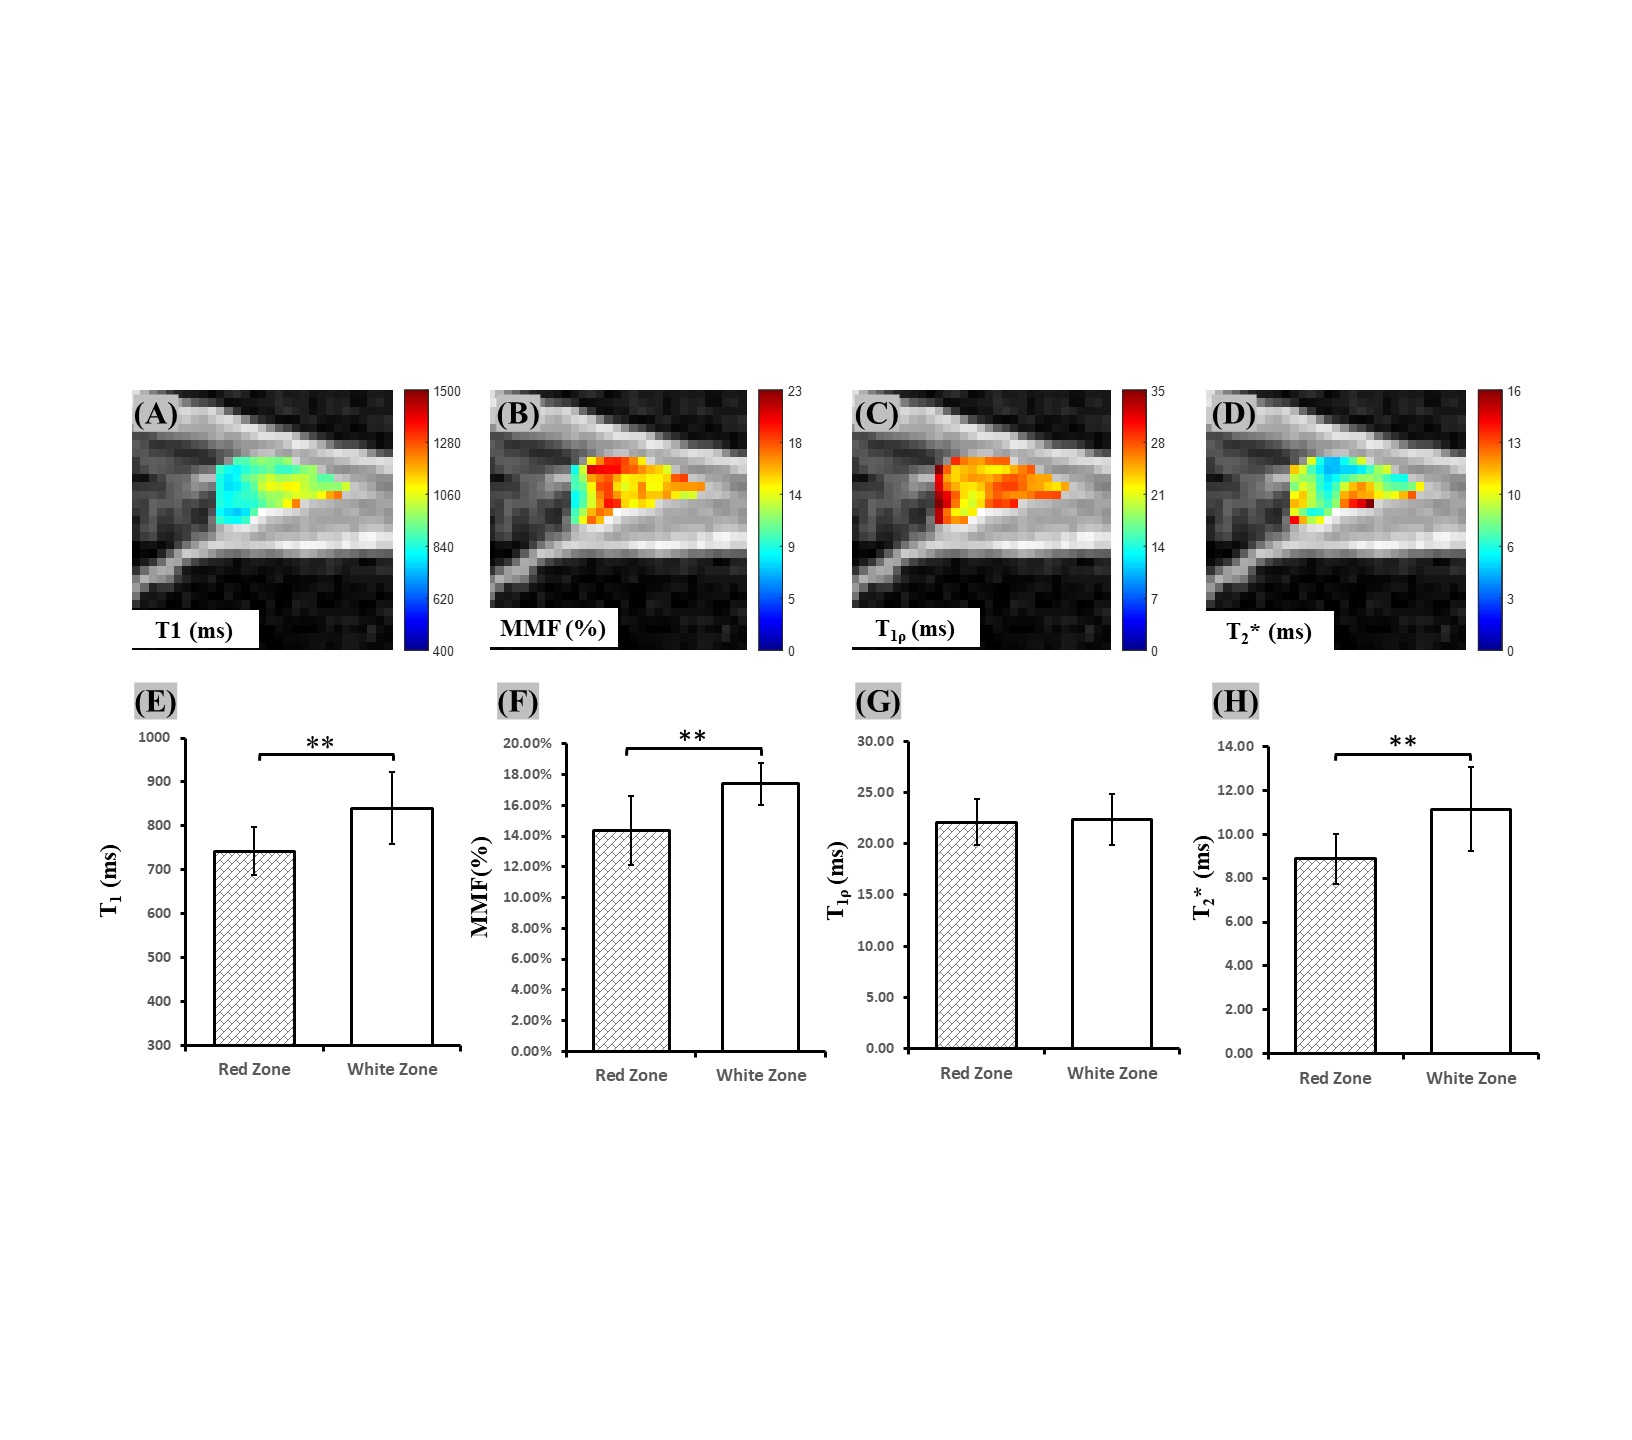
Figure 4. Representative UTE T1, T1ρ, MMF, and T2* maps (A-D) and bar plots for the mean UTE measurements of red and white zones from all 15 volunteers (E-H). “**” indicates a p-value less than 0.01.