0635
Importance of ACL substructure composition for quantitative analysis using UTE1Medical Physics Group, University Clinic and Outpatient Clinic for Radiology, University Hospital Halle (Saale), Halle (Saale), Germany, 2Halle MR Imaging Core Facility, Medical Faculty, Martin-Luther-University Halle-Wittenberg, Halle (Saale), Germany
Synopsis
Keywords: Tendon/Ligament, Quantitative Imaging
Motivation: Quantitative MR-imaging of ligaments needs special approaches like ultra-short echo-time (UTE) imaging. Most quantitative studies of the anterior cruciate ligament (ACL) regard it as a uniform structure and do not consider differences in ligament composition at different anatomical positions.
Goal(s): This study is aimed to use UTE to evaluate anatomical position specific T1 and T2* parameters of the ACL.
Approach: The region specific ACL T1 and T2* values of 10 healthy volunteers were investigated by quantitative UTE mapping.
Results: Quantitative mapping revealed that T1 and T2* values decrease from the distal to the proximal ACL endings, due to different fractions of free water.
Impact: This study reveals that the anterior cruciate ligament (ACL) shows severe differences in quantitative values between its proximal and distal ends. The ACL region plays an important role in quantitative analysis and should be considered for assessments of pathologies.
Introduction
Ligaments and tendons are important structures for musculoskeletal imaging and diagnosis after traumatic injuries. Due to their very fast apparent transverse relaxation times (T2*) they generate nearly no MR-signal in conventional imaging and their quantitative imaging requires alternative approaches like ultra-short echo times (UTE) MRI1. Quantitative parameters, such as T2* and T1 can be determined from UTE data, and were previously shown to provide an enhanced characterization of structural changes in tendiopathoies2 or in affected ligaments, for example after injuries or recontrsuctions3. Exemplary, the cruciate ligaments are filigree structures, whose shape depends on knee angulation. Quantitative MRI in situ studies of the posterior cruciate ligament indicate effects on quantitative parameters in different ligament compartments4. Studies of human knees after reconstructions of anterior cruciate ligament (ACL) also reported quantitative differences to healthy ligaments and influenced healing in different ligament compartments5. However, most previous studies regarded the ACL as a uniform structure and do not consider differences in ligament composition at different anatomical positions. Therefore, this study aims to determine these differences by evaluating the anatomical position specific T1 and T2* relaxation times, which were extracted from quantitative UTE knee images of healthy volunteers.Methods
In this study the knees of 10 healthy volunteers (8 female, 24.6±3.2 years) without any background of knee injury where investigated. All measurements were performed on a 3T MR-scanner (MAGNETOM Vida, Siemens Healthineers, Erlangen, Germany) using an 18-channel transmit/receive knee coil. The knee angulation was around 15° in all volunteers. As shown previously, fast T1 and T2* maps were computed based on two 0.8 mm³ isotropic measurements acquired by using a 3D spoiled gradient echo UTE research application sequence with stack of spirals readout (see Fig.1)6–8. For fast T2*mapping, which requires two echo readouts in this method, two separate computations with two different TE combinations were compared in terms of their sensitivity for the expected T2*-range in ACL tissue (Comb1: TE1/TE2:0.03/2.46ms; Comb2: TE1/TE2:0.03/4.92ms). In addition to UTE scans, a 3D turbo spin echo image series (SPACE, TR/TE:900/49ms, FA:120°, isotropic voxel size:0.8mm) was acquired to annotate three regions of interest at different ACL positions (proximal, medial and distal, Fig.2). The ROIs were identified by an experienced radiologist by using dedicated tools of syngo.via platform (Siemens Healthineers, Forchheim, Germany). Afterwards ROIs were transformed to corresponding relaxometry maps to access ROI specific mean T1 and T2* values. Statistical analysis was performed by One-way ANOVA followed by post hoc comparisons using GraphPad Prism (GraphPad Software, Boston, Massachusetts USA).Results
The results of T2* mapping performed with two different TE combinations are shown in Fig.3. In both maps the T2* values decreased to the proximal end of ACL to about 63–73% compared to T2* values at the distal end. The T2* map computed by using TE1/TE2=0.03/2.46ms shows higher distal T2* values compared to the T2* map computed by using TE1/TE2=0.03/4.92ms. The T1 mapping results are shown in Fig.4. The T1 values decreased to the proximal ACL end to 81% of the distal values. T2*/ T1 evolutions obtained in single volunteer at examined ACL positions are shown in Fig.5.Discussion
This study shows that relaxometry parameters in ACL are strongly depending on the selected ligament region. Both investigated parameters (T1, T2*) reveal continuous decrease from the distal to the proximal end of the ACL. This can be explained by changes of the ligament composition. At the proximal end, the ACL fibers are highly ordered, which restricts the accumulation of surrounding free water. On the other hand, the ligament fans out to the distal part, which allows free water accumulation and thus leads to increased T1 and T2* values. The differences observed in the distal ACL part for T2* mappings performed with different TE combinations are related to the different sensitivity ranges, which are defined by the TE2. The TE2=2.46ms does not allow precise measurements for T2* values over 8-10ms, which is indicated by a T2* overestimation and higher T2* scattering in this range. The TE2=4.92ms enables more precise T2* measurement up to about 10-12ms, which leads to a lower T2* scattering and significantly shorter values of computed T2* values. For the intrinsically lower T2* in the proximal ACL part both TE combinations lead to comparable results.Conclusion
Our study demonstrates significant differences of relaxometry parameters in different ACL parts of healthy volunteers. This anatomy driven behavior should be taken into account in future studies investigating for example ligament lesions at different ACL locations. This study is based on the labelling of a single radiologist and is therefore biased by the experience of this radiologist.Acknowledgements
The authors thank Siemens Healthineers for providing the 3D spiral UTE research application sequence and Thomas Benkert (MR Application Predevelopment, Siemens Healthineers GmbH, Erlangen, Germany) for technical support. This study was performed on a human research MR scanner founded by the German Research Foundation (DFG, Deutsche Forschungsgemeinschaft, INST 271/ 406-1 FUGG).References
1. Wehrli FW. Magnetic resonance of calcified tissues. J Magn Reson. 2013;229:35-48. doi:10.1016/j.jmr.2012.12.011
2. Grosse U, Syha R, Hein T, et al. Diagnostic value of T1 and T2∗ relaxation times and off-resonance saturation effects in the evaluation of achilles tendinopathy by MRI at 3T. J Magn Reson Imaging. 2015;41(4):964-973. doi:10.1002/jmri.24657
3. Chu CR, Williams AA. Quantitative MRI UTE-T2* and T2* Show Progressive and Continued Graft Maturation Over 2 Years in Human Patients After Anterior Cruciate Ligament Reconstruction. Orthop J Sport Med. 2019;7(8):1-10. doi:10.1177/2325967119863056
4. Wilms LM, Radke KL, Latz D, et al. UTE-T2* versus conventional T2* mapping to assess posterior cruciate ligament ultrastructure and integrity-an in-situ study. Quant Imaging Med Surg. 2022;12(8):4190-4201. doi:10.21037/qims-22-251
5. Yoshimizu R, Nakase J, Okuda M, et al. Ligamentization of the reconstructed ACL differs between the intraarticular and intraosseous regions: A quantitative assessment using UTE-T2* mapping. PLoS One. 2022;17(7 July):1-10. doi:10.1371/journal.pone.0271935
6. Qian Y, Boada FE. Acquisition-weighted stack of spirals for fast high-resolution three-dimensional ultra-short echo time MR imaging. Magn Reson Med. 2008;60(1):135-145. doi:10.1002/mrm.21620
7. Mugler JI, Fielden SWMCH, A. AT, et al. Breath-hold UTE Lung Imaging using a Stack-of-Spirals Acquisition. In: 23rd Annual Meeting ISMRM. ; 2015:1476.
8. Rothe M, Deistung A, Brill R, Wohlgemuth WA, Gussew A. Validation of fast in vivo T1 and T2* mapping of tissues in the knee using 3D UTE. In: Joint Annual Meeting ISMRM-ESMRMB. ; 2022:1342.
Figures
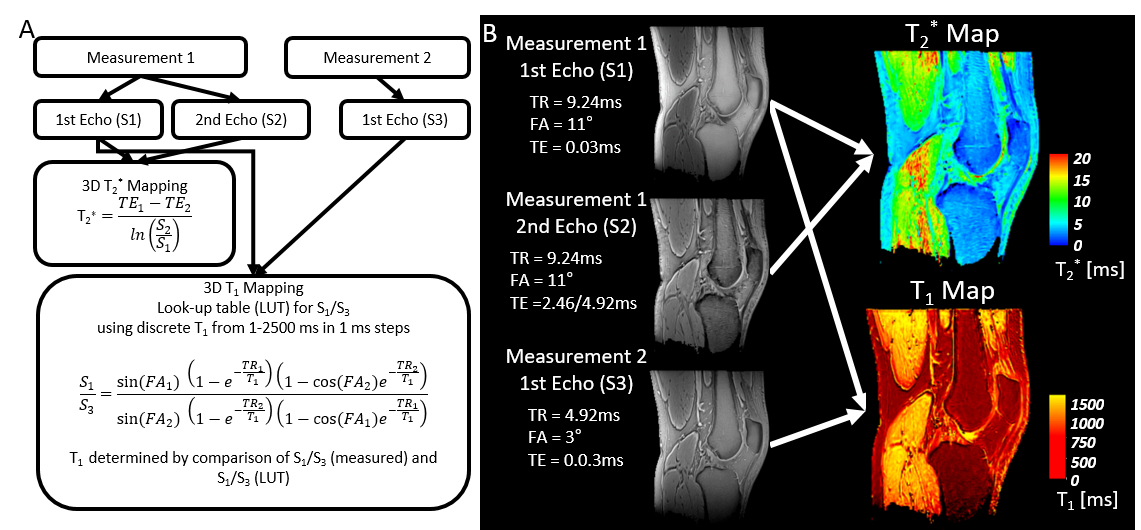
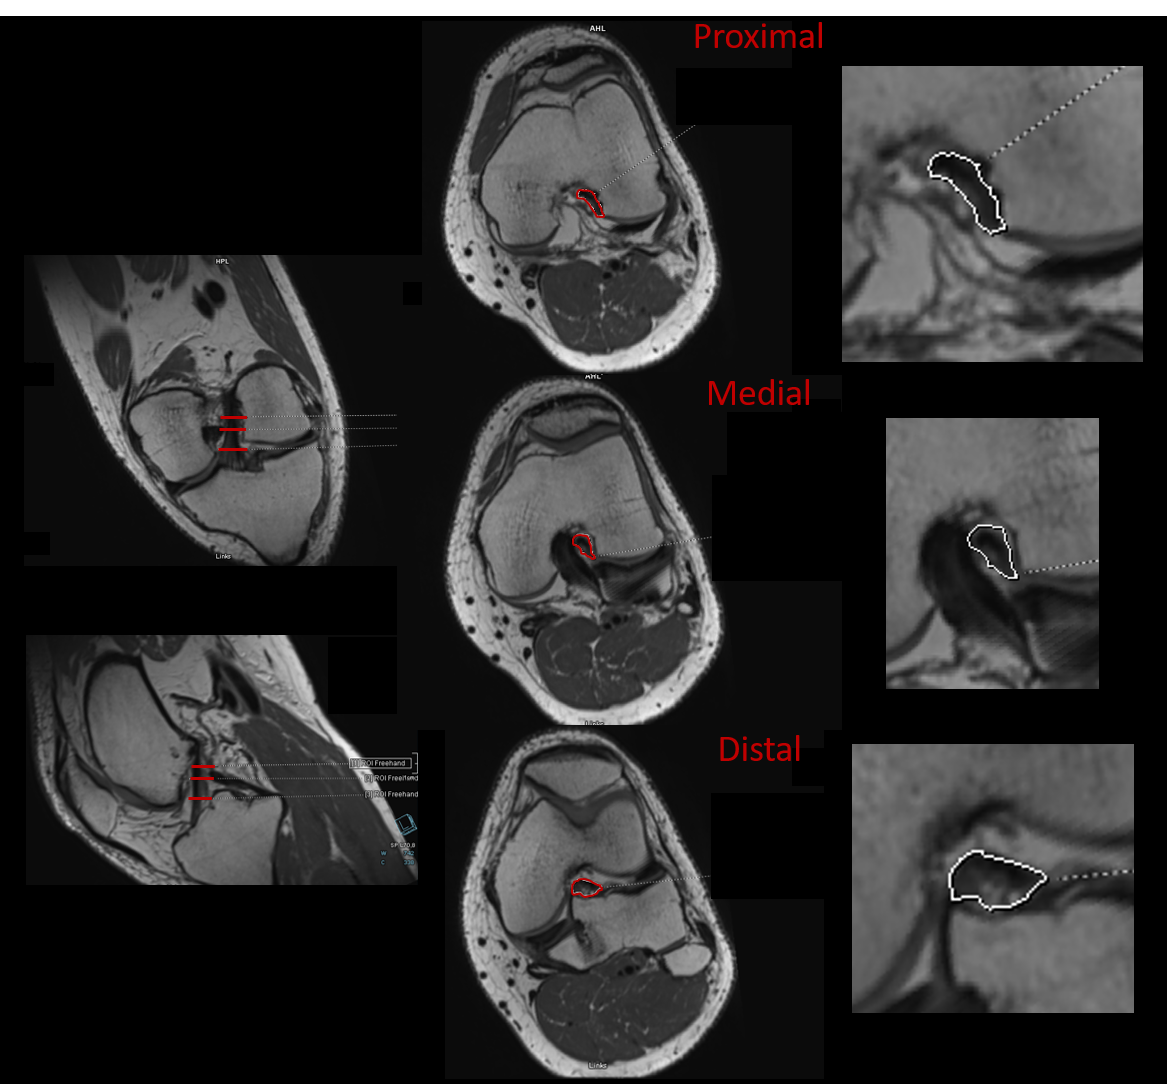
Figure 2: Representative SPACE images and the labeling of the three different regions of interest (distal, medial and proximal) of the anterior cruciate ligament. On the right, a magnification shows the small structural differences of the anterior cruciate ligament between the proximal and distal regions.

Figure 3: Results of the T2* mapping using a dual echo method with TE1/TE2 = 0.03/2.46 ms and TE1/TE2 = 0.03/4.92 ms in three examined anterior cruciate ligament regions. Statistical analysis was performed by One-way ANOVA followed by post hoc comparisons (P-values of significance: ns>0.05, *<0.05, **<0.01, ***<0.001, ****<0.0001).

Figure 4: Results of the T1 mapping in three examined anterior cruciate ligament regions. Statistical analysis was performed by One-way ANOVA followed by post hoc comparisons (P-values of significance: ns>0.05, *<0.05, **<0.01, ***<0.001, ****<0.0001).