0622
Simultaneous 3D T1, T2, and fat-fraction mapping with respiratory-motion correction, for comprehensive liver tissue characterisation at 0.55T1School of Biomedical Engineering and Imaging Sciences, King's College London, London, United Kingdom, 2MR Research Collaborations, Siemens Healthcare Limited, Camberley, United Kingdom, 3School of Engineering, Pontificia Universidad Católica de Chile, Santiago, Chile, 4Millennium Institute for Intelligent Healthcare Engineering, Santiago, Chile, 5Institute for Biological and Medical Engineering, Pontificia Universidad Católica de Chile, Santiago, Chile
Synopsis
Keywords: Quantitative Imaging, Quantitative Imaging, Liver, Low-Field
Motivation: Mulitparametric quantitative MRI is a powerful tool for diagnosis of liver disease, but current clinical sequences will acquire 2D slices in separate scans, prone to misregistration.
Goal(s): Demonstrate the simultaneous in-vivo acquisition of T1, T2, and fat fraction maps over the whole liver from a single free-breathing scan at 0.55T.
Approach: A dictionary-matching-based framework with non-rigid respiratory motion corrected reconstruction was validated in a cohort of ten healthy subjects.
Results: T1, T2, and fat fraction values acquired in phantoms and in vivo showed good agreement with values from corresponding reference scans.
Impact: Our technique promises an efficient means to acquire multiple parameter maps providing comprehensive staging and diagnosis of non-alcoholic fatty liver disease, believed to affect over two billion people worldwide.
Introduction
Non-alcoholic fatty liver disease is believed to affect more than 2 billion people worldwide1. MRI offers the means to quantitatively and non-invasively stage this disease thanks to the ability to measure multiple tissue parameters correlated with its progression—including T1 for fibrosis, T2 for inflammation, and fat fraction for fat infiltration2—but currently these maps need to be acquired with separate 2D breathhold scans, being prone to misregistration and providing limited liver coverage. We propose a framework to simultaneously acquire 3D T1, T2, and fat-fraction maps, from a single free-breathing scan with a non-rigid motion corrected reconstruction, providing three full-coverage co-registered maps in under ten minutes. The proposed sequence is implemented on a wide-bore 0.55 T scanner, promising lower costs and greater accessibility.Methods
As laid out in Fig. 1, the proposed sequence acquires four volumes through an interleaved acquisition with a two-echo, bipolar, spoiled gradient-echo readout, and a 2D image navigator (iNAV)3 preceding each interleave. A spiral-like Cartesian trajectory with golden-angle increment4 ensures that k-space sampling is incoherent with respiratory motion. A repeating cycle of inversion recovery (IR) and T2 preparation (T2prep) pulses creates different T1 and T2 weightings in each volume: IR (TI = 700 ms), T2prep (100 ms), T2prep (50 ms), no preparation.Respiratory motion is estimated through translational registration of the iNAVs, allowing respiratory binning of all data with intra-bin translational motion correction. Inter-bin displacement fields are estimated through non-rigid registration of the bins of the first volume, reconstructed at a reduced resolution, and these fields are then applied in a motion-corrected iterative-SENSE reconstruction of all volumes5. After Dixon water-fat separation, T1, T2, and M0 are estimated separately for water and fat by matching the respective signals against a precomputed dictionary, generated using 1D Bloch simulations. Fat-fraction is estimated from the ratio of fat M0 to the total water and fat M0.
To avoid artefacts due to motion of the arms, in-vivo measurements were performed in sagittal orientation, thus omitting the arms from the excited slab. Imaging was performed with an AP readout to minimise respiratory motion artefacts of the chest wall, while the iNAVs used a FH readout to obtain the best resolution in the direction of respiratory motion tracking.
The mapping accuracy and precision of the proposed sequence was validated in a set of three phantoms (T1MES standardised 1.5 T T1/T26, in-house T1/T2, in-house water/fat), and in-vivo feasibility was demonstrated in ten healthy subjects. All experiments were performed on a 0.55 T scanner (MAGNETOM Free.Max, Siemens Healthcare, Erlangen, Germany), with the following parameters: sagittal acquisition with AP readout, FOV = 240 mm × 372 mm × 240 mm, isotropic 3 mm resolution, undersampling factor = 4, scan time 9 min 25 s; 31 readouts per interleave with flip angle = 8°, TR = 9.92 ms, TE = 2.84 ms and 6.47 ms, bandwidth = 299 Hz / pixel; 14 navigator lines per interleave with FH readout, flip angle = 3°, TR = 6.37 ms, TE = 2.84 ms. Reference T1 and T2 values were obtained from spin-echo measurements in phantoms, and with MOLLI and T2-prepared bSSFP 2D cardiac research sequences respectively in-vivo. Reference fat fraction was estimated from a conventional two-point Dixon sequence in both cases.
Results
Phantom measurements showed good accuracy and precision for T1, T2, and fat fraction (Fig. 2). In-vivo volumes show good image quality with minimal blurring (Figs. 3 and 4). T1 values in the liver were 70.8 ms greater on average than those measured by MOLLI, and T2 values were 30 ms lower on average than those measured with T2-prepared bSSFP (Fig. 5).Discussion
All measurements demonstrated good consistency. In-vivo T1 and T2 measurements exhibited noticeable bias, but the conventional sequences used as reference are themselves known to be biased7,8. The combination of sagittal acquisition with AP readout was very effective and preventing artefacts due to respiratory and involuntary motion, and the obtained in-vivo image quality clearly demonstrates the effectiveness of the respiratory motion correction. Future work will include extension of the readout to a greater number of echoes, permitting T2* measurement and accurate PDFF estimation.Conclusion
This work demonstrated the ability to acquire co-registered 3D T1, T2, and fat-fraction maps with whole-liver coverage, in a clinically feasible scan time of under ten minutes at 0.55T, validated both in phantoms and in a small cohort of healthy subjects.Acknowledgements
The authors acknowledge financial support from: (1) BHF RG/20/1/34802 (2) EPSRC EP/V044087/1 (3) Wellcome EPSRC Centre for Medical Engineering (NS/A000049/1), (4) ANID Millennium Institute iHEALTH, ICN2021_004; Fondecyt 1210637 and 1210638; Basal Funding, IMPACT, FB210024 and (5) the Technical University of Munich – Institute for Advanced Study.References
1. K. Riazi, H. Azhari, J. H. Charette, et al., “The prevalence and incidence of NAFLD worldwide: A systematic review and meta-analysis,” The lancet gastroenterology & hepatology, 2022.
2. J. J. Schaapman, M. E. Tushuizen, M. J. Coenraad, and H. J. Lamb, “Multiparametric MRI in patients with nonalcoholic fatty liver disease,” Journal of Magnetic Resonance Imaging, vol. 53, no. 6, pp. 1623–1631, 2021.
3. M. Henningsson, P. Koken, C. Stehning, R. Razavi, C. Prieto, and R. M. Botnar, “Whole-heart coronary MR angiography with 2D self-navigated image reconstruction,” Magnetic resonance in medicine, vol. 67, no. 2, pp. 437–445, 2012.
4. C. Prieto, M. Doneva, M. Usman, et al., “Highly efficient respiratory motion compensated free-breathing coronary MRA using golden-step Cartesian acquisition,” Journal of Magnetic Resonance Imaging, vol. 41, no. 3, pp. 738–746, 2015.
5. G. Cruz, D. Atkinson, M. Henningsson, R. M. Botnar, and C. Prieto, “Highly efficient nonrigid motion-corrected 3D whole-heart coronary vessel wall imaging,” Magnetic resonance in medicine, vol. 77, no. 5, pp. 1894–1908, 2017.
6. G. Captur, P. Gatehouse, K. E. Keenan, et al., “A medical device-grade T1 and ECV phantom for global T1 mapping quality assurance—the T1 mapping and ECV standardization in cardiovascular magnetic resonance (T1MES) program,” Journal of cardiovascular magnetic resonance, vol. 18, no. 1, pp. 1–20, 2016.
7. M. D. Robson, S. K. Piechnik, E. M. Tunnicliffe, and S. Neubauer, “T1 measurements in the human myocardium: The effects of magnetization transfer on the SASHA and MOLLI sequences,” Magnetic resonance in medicine, vol. 70, no. 3, pp. 664–670, 2013.
8. S. Giri, Y.-C. Chung, A. Merchant, et al., “T2 quantification for improved detection of myocardial edema,” Journal of cardiovascular magnetic resonance, vol. 11, no. 1, pp. 1–13, 2009.
Figures
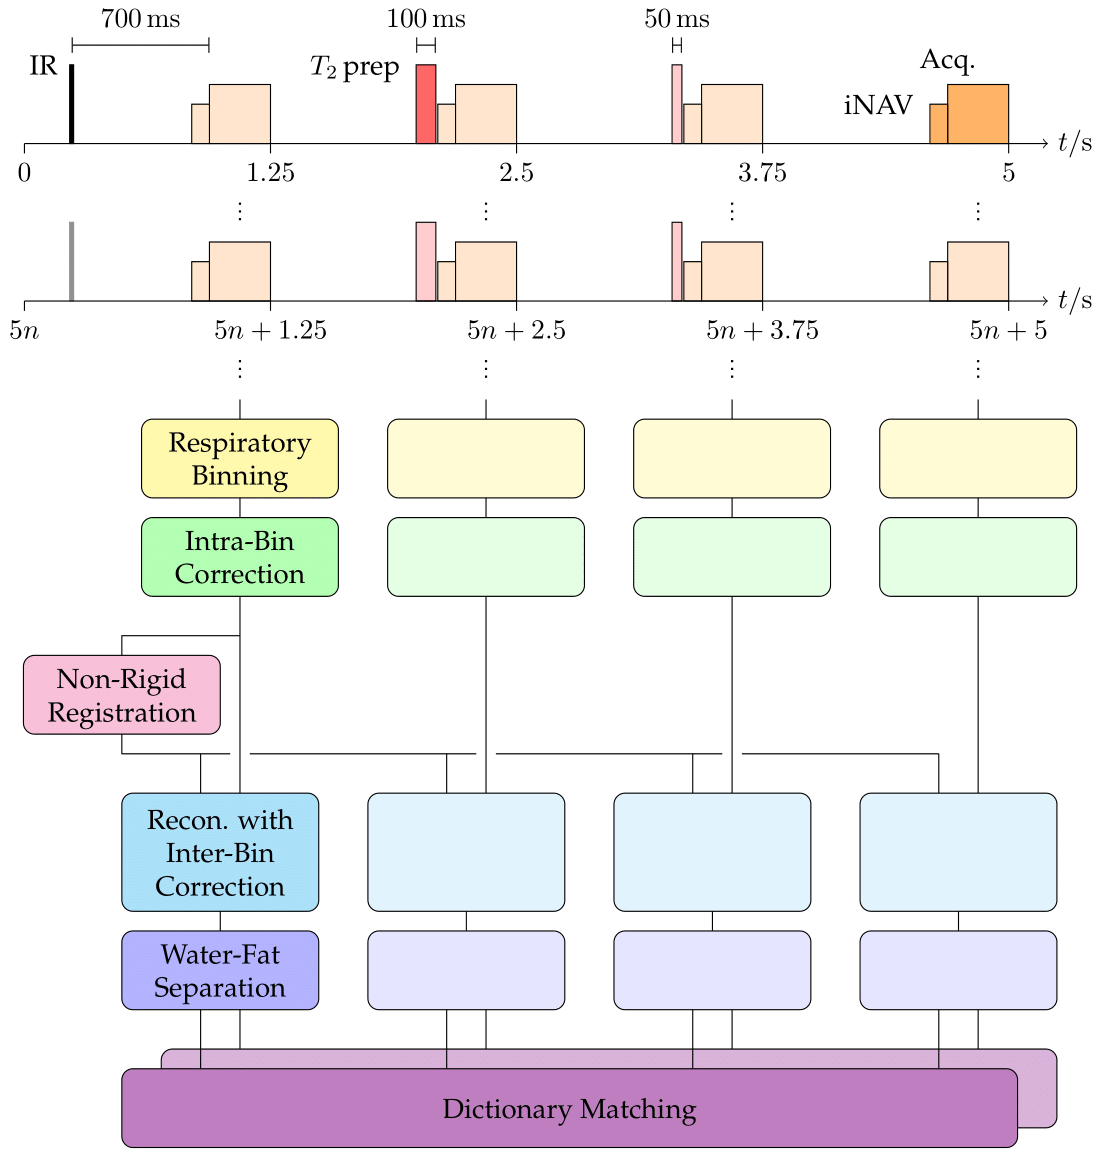
The proposed acquisition and reconstruction pipeline. Four volumes with different T1 and T2 weightings are acquired through an interleaved acquisition. A navigator preceding each interleave allows respiratory binning and intra-bin translational motion correction. Registration between bins provides displacement fields for a non-rigid motion-corrected iterative SENSE reconstruction. Separated water and fat signals are then matched against a pre-simulated dictionary to estimate T1 and T2, as well as M0 for estimation of fat fraction.
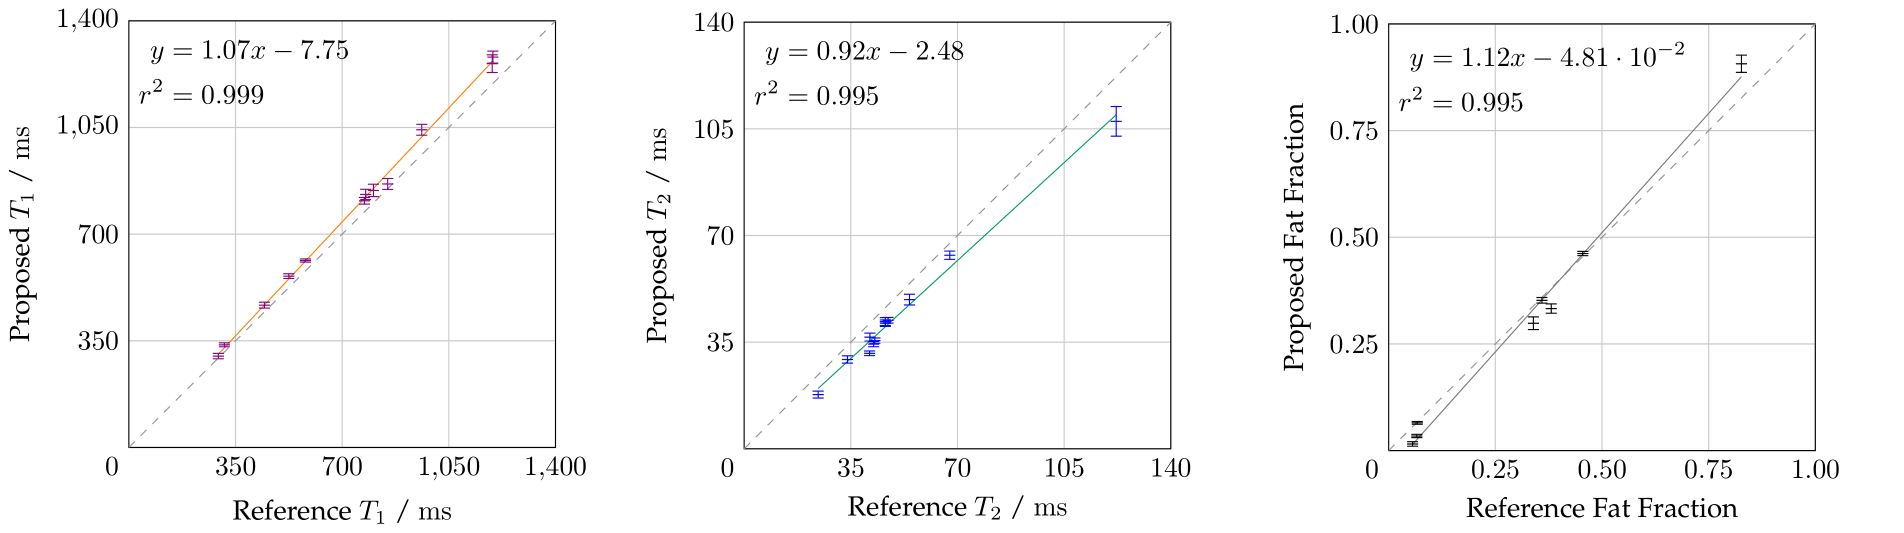
T1, T2, and fat-fraction measurements from the proposed sequence in a range of phantoms, against corresponding reference measurements. Vials with T1 or T2 values outside the design limits of the sequence were omitted. All parameters show good agreement, with biases of +41.9 ms in T1, -6.64 ms in T2, and -0.01 in fat-fraction.
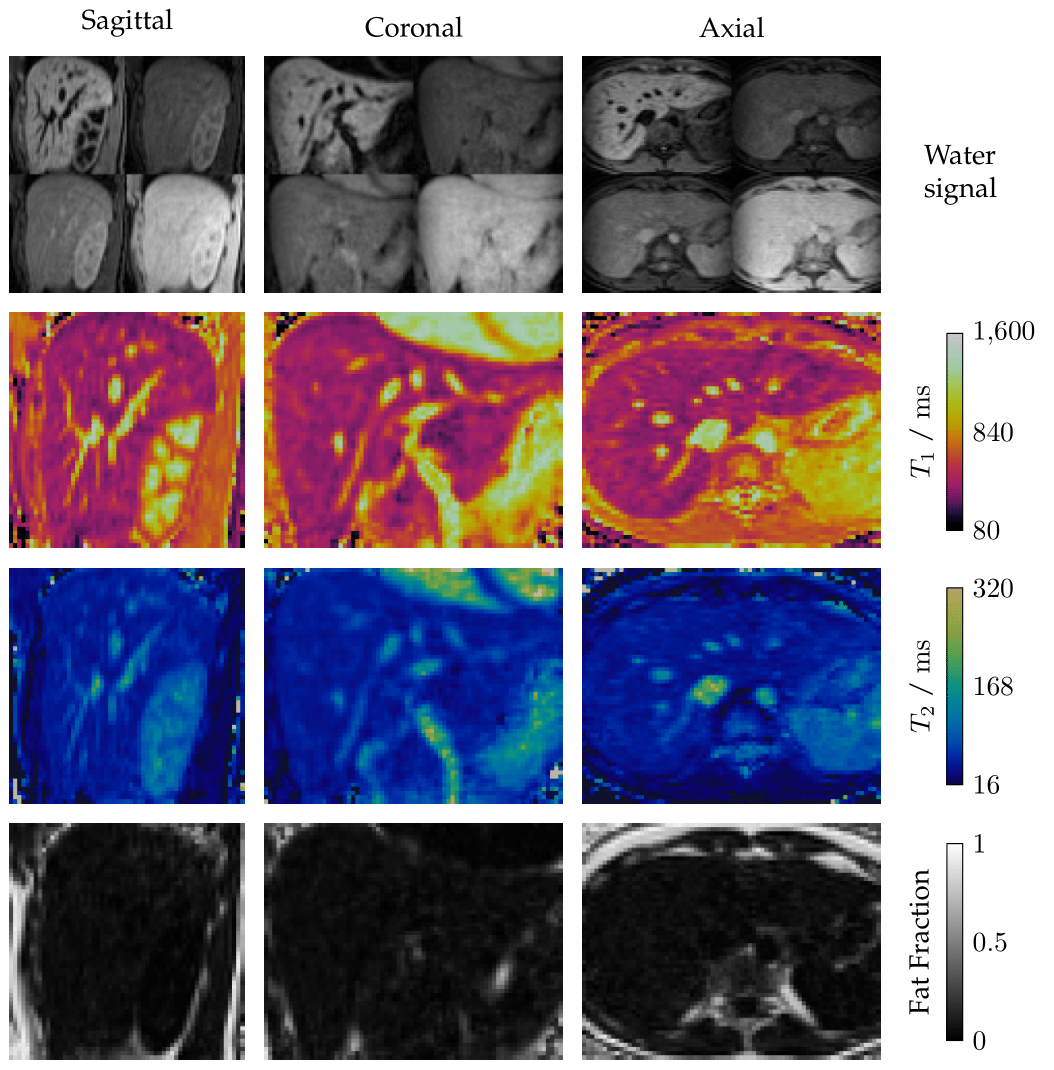
Sagittal, coronal, and axial reformats of four 3D water images acquired with the proposed sequence in one healthy subject, with the corresponding 3D parameter maps obtained through dictionary matching. Total coverage of the liver is achieved with an isotropic 3 mm resolution, and the maps are inherently co-registered.
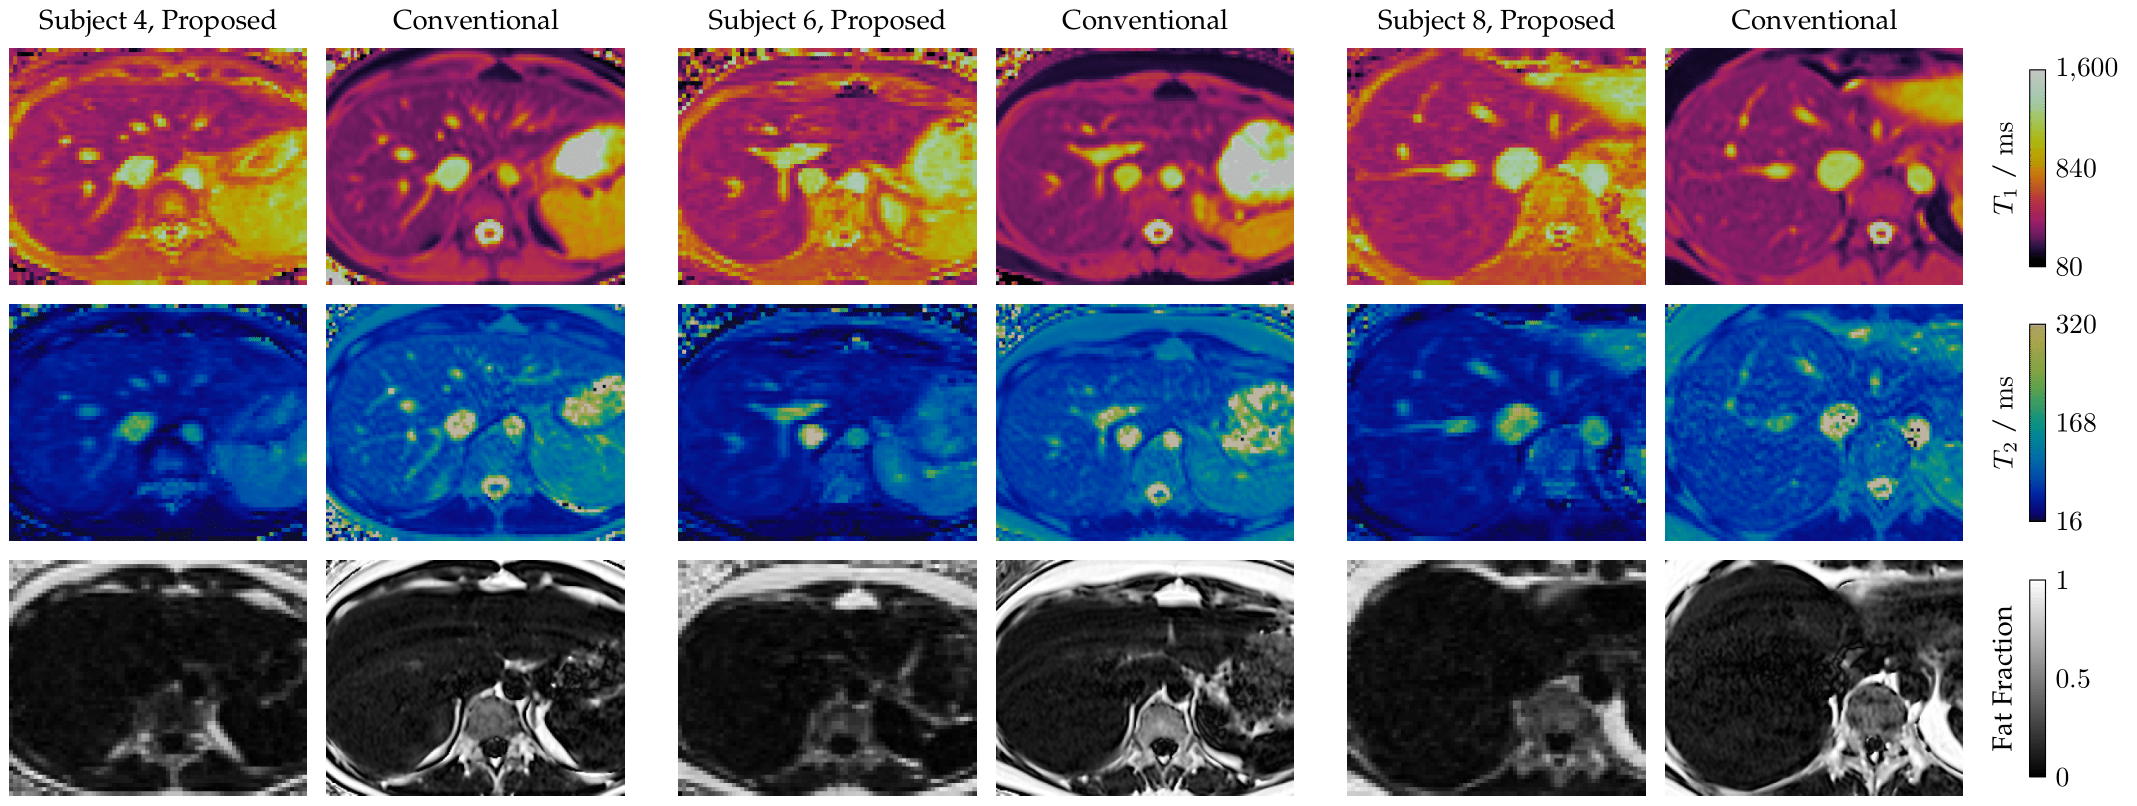
T1, T2, and fat-fraction maps from the proposed sequence compared to conventional cardiac T1 MOLLI, T2-prepared T2 mapping, and Dixon sequences, acquired in three healthy subjects. All cases show strong visual agreement when allowing for bias. For fairer comparison with the 10 mm slices of the conventional sequences, T1 and T2 values of the proposed sequence were averaged over three 3 mm slices.
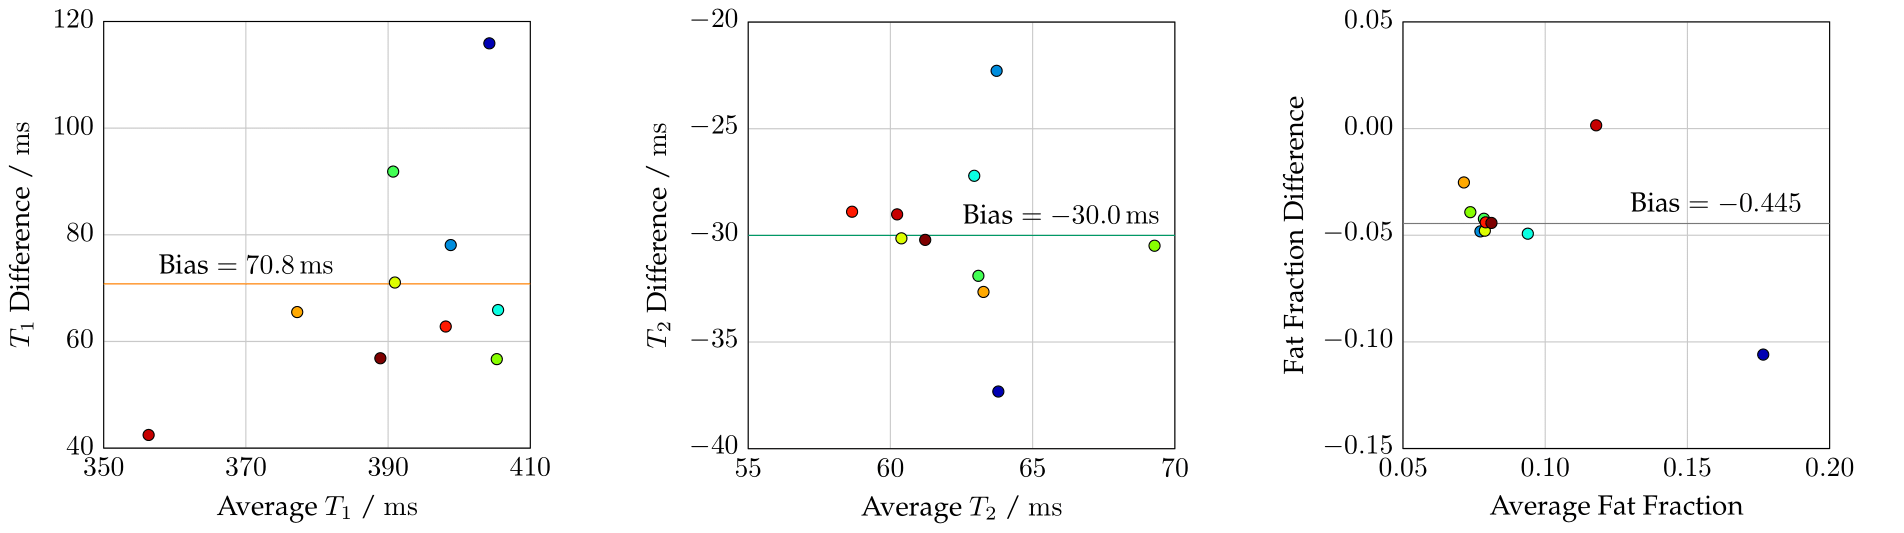
Mean T1, T2, and fat-fraction measurements from the proposed sequence compared through Bland-Altman plots to those of corresponding conventional sequences in all healthy subjects. All values were obtained by taking the lesser mean of a two-component Gaussian-mixture fit on an ROI covering the whole liver, to reduce the influence of blood. T1 and T2 exhibit biases of +70.8 ms and -30.0 ms respectively.