0619
Cardiac–hepatic magnetic resonance findings in children with Kawasaki disease1Department of Radiology, Sichuan Academy of Medical Sciences and Sichuan Provincial People's Hospital, University of Electronic Science and Technology of China, Chengdu, China, 2Sichuan University West China Second University Hospital, Chengdu, China, 3MR Research Collaboration, Siemens Healthineers, Chengdu, China
Synopsis
Keywords: Myocardium, Quantitative Imaging, Kawasaki disease
Motivation: Kawasaki Disease (KD) is recognized for cardiac and coronary arterial impact, however its influence on the liver remains underexplored, especially in pediatric patients.
Goal(s): Use T1 mapping to quantitatively evaluate cardiac-hepatic involvement and myocardial fibrosis in KD patients.
Approach: Using a 3T MR scanner, T1 mapping was conducted on the heart and liver of 115 KD patients and 40 controls, with myocardial fibrosis being diagnosed through LGE.
Results: KD patients displayed elevated cardiac and hepatic T1 values in both acute and chronic phases compared to controls. These values, in combined with sodium levels, were effective in identifying myocardial fibrosis in KD patients.
Impact: This study demonstrated T1 mapping was a noninvasive tool for the comprehensive assessment of cardiac-hepatic involvement and myocardial fibrosis in KD patients.
Introduction
Kawasaki disease (KD) is primarily known for its impact on the coronary arteries, but it can affect many systems in the body, including the liver1. A case reports indicate that hepatic involvement in KD occurs mainly in adolescents and adult patients2, and an autopsy hepatic histopathological examination and hepatic biopsy of the KD patients showed inflammatory cell infiltration, edema, and expansion in the portal vein area. So, we can't ignore the hepatic involvement in pediatric KD patients, as neglecting monitoring and treatment may lead to liver damage. Given the proximity of the liver to the heart, T1 mapping of the liver is feasible on Cardiac magnetic resonance (CMR)3. T1 mapping in the heart provides quantitative information about myocardial tissue characteristics, enabling the detection of fibrosis, edema, and infiltration4. In the liver, T1 mapping can noninvasively assess hepatic fibrosis, cirrhosis severity and liver function5. This study aimed to utilize T1 mapping to quantitatively assess myocardial and hepatic involvement in KD patients.Methods
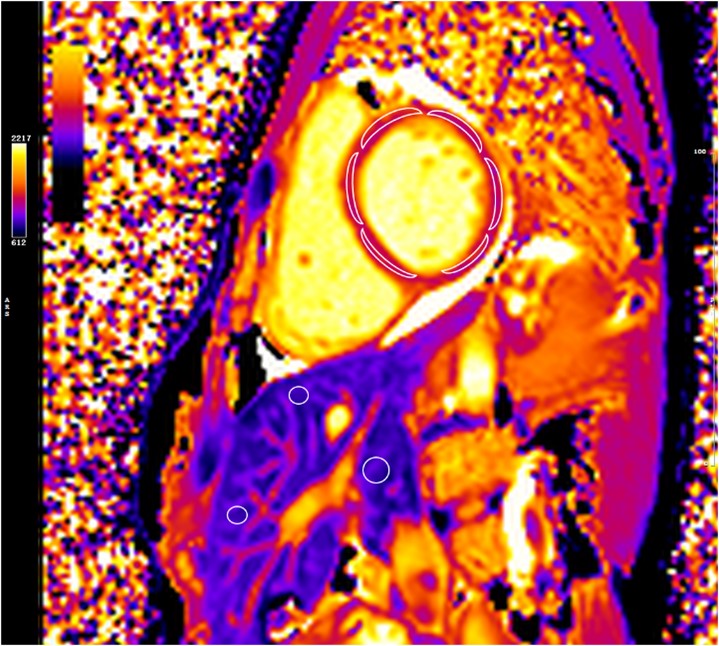
We prospectively recruited 115 KD patients (5.4 ± 2.7 years) and 40 matched controls (4.7 ± 2.3 years) using a clinical 3T MR scanner (MAGNETOM Skyra, Siemens Healthineers, Erlangen, Germany) equipped with an 18-channel coil. Patients within 40 days after onset were defined as the acute phase, whereas patients with an onset beyond 40 days were defined as the chronic phase. T1 mapping was obtained using a modified Look-Locker inversion recovery sequence for the left ventricular (LV) myocardium and liver3, with parameters of flip angle = 35°, repetition time (TR) = 3.90 ms, echo time (TE) = 1.74 ms, slice thickness = 6.0 mm, matrix = 139 × 192, and field of view (FOV) = 280 × 224 mm2. Late gadolinium enhancement (LGE) images were performed 10 min after the administration of gadopentetate dimenglumine, and the sequence parameters were described in the reference6.All CMR images were analyzed by the CVI software (v.4.2.2, Canada). As shown in Figure 1, this software is capable of autonomously delineating the region of interest (ROI) with manual adjustment of boundaries to accurately determine the global T1 values across the LV myocardium. For the liver, three distinct ROIs were drawn, carefully avoiding blood vessels, to calculate the hepatic T1 values. And we defined LGE+ and LGE– to represent the existence or non-existence of LGE.
Statistical analyses were conducted using Analysis of Variance (ANOVA), two-sample t-tests, multivariate logistic regression, and a receiver operating characteristic curve using IBM SPSS (version 26.0, IBM SPSS, NY) and Medcalc (v15.6.1, Ostend, Belgium).
Results
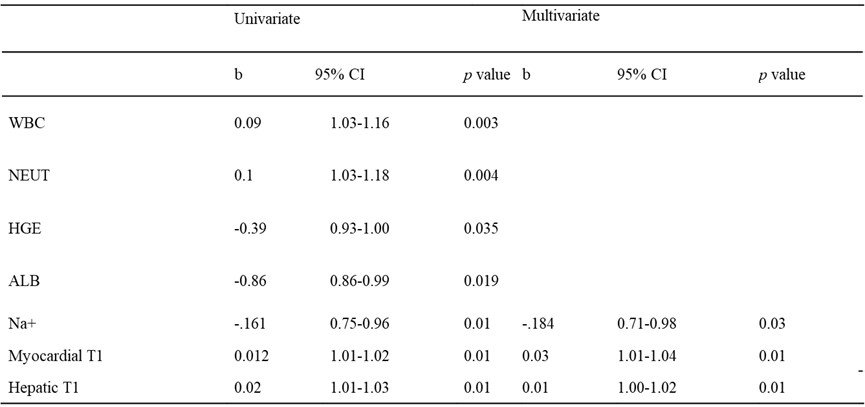
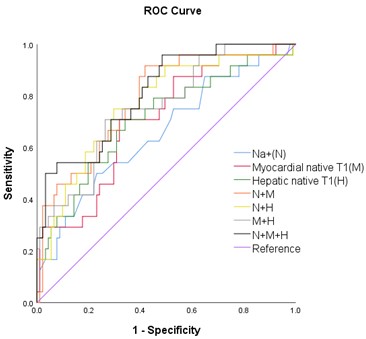
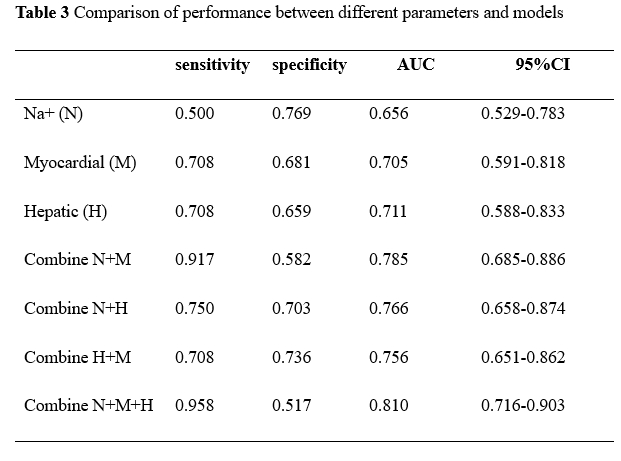
The myocardial T1 value of KD patients in the acute phase (n = 50) was the highest, followed by the chronic phase (n = 65), and the lowest in the controls (1393 ± 71 vs. 1345 ± 65 vs. 1303 ± 61 ms, respectively; p = 0.01))(Table 1). The hepatic T1 value of KD patients in the acute phase was the highest, followed by the chronic phase, and the lowest in controls (810 ± 36 vs. 794 ± 46 vs. 758 ± 38 ms, respectively; p = 0.01). LGE was present in 10 KD patients in the acute phase and 14 in the chronic phase. Myocardial T1 values were significantly longer in LGE+ patients than LGE− patients in both acute (1442 ± 66 vs. 1381 ± 67 ms; p < 0.001 )and chronic phases(1392 ± 91 vs. 1331 ± 50; p < 0.001). The hepatic native T1 values were the same as the myocardial (acute phases: 836 ± 47 vs 8803 ± 30; chronic phases: 820 ± 65 vs. 787 ± 36 ms; all p < 0.001). Multivariate logistic regression analysis showed that Na+, myocardial and hepatic T1 values were effective predictors for the diagnosis of LGE+ patients(Table 2). When the three indicators are combined, the AUC value of predicting LGE+ significantly improved to 0.82( Figure 2 and Table 3).Discussion and Conclusion
Elevated myocardial and hepatic T1 values in the acute and chronic phases were higher than those in the normal control, which indicates the persistence of inflammation in the heart and liver2. T1 mapping is effective in revealing myocardial and hepatic involvement in KD, and might be used as an image biomarker to determine the phase of the disease. Furthermore, multivariate logistic regression emphasized the diagnostic performance of Na+, myocardial, and hepatic T1 values in KD patients with LGE+. This combined model could identify myocardial fibrosis without the use of contrast agents, providing a significant benefit in the clinical management of KD.Acknowledgements
No acknowledgement found
References
1. Mccrindle B W, Rowley A H, Newburger J W, et al. Diagnosis, treatment, and long-term management of Kawasaki disease: A scientific statement for health professionals from the American Heart Association. Circulation. 2017;135(17):e927–e999.
2. Tomita Y, Fukaya T, Yamaura Y, et al. Implications of hepatic dysfunction in Kawasaki disease: Time-related changes in aspartate aminotransferase, alanine aminotransferase, total bilirubin, and C-reactive protein levels. Pediatr Investig. 2019;3(1):19–26.
3. Noval Rivas M, Arditi M. Kawasaki disease: Pathophysiology and insights from mouse models. Nat Rev Rheumatol. 2020;16(7):391-405.
4.Messroghli DR, Moon JC, Ferreira VM, et al. Clinical recommendations for cardiovascular magnetic resonance mapping of T1, T2, T2* and extracellular volume: A consensus statement by the Society for Cardiovascular Magnetic Resonance (SCMR) endorsed by the European Association for Cardiovascular Imaging (EACVI). J Cardiovasc Magn Reson. 2017;19(1):75.
5. Banerjee R, Pavlides M, Tunnicliffe EM, et al. Multiparametric magnetic resonance for the non-invasive diagnosis of liver disease. J Hepatol. 2014;60(1):69-77.6. Yao, Q, Hu X, He l. Evaluation of comprehensive myocardial contractility in children with Kawasaki disease by cardiac magnetic resonance in a large single center. Quant Imaging Med Surg. 2022;12(1): 481–492.
Figures