0615
A deep learning framework for assessing remodelling and functional changes in infarcted left ventricles with reduced ejection fraction1Institute for Biomedical Engineering, ETH Zurich and University of Zurich, Zurich, Switzerland, 2Diagnostic and Interventional Raidology, University of Zurich, Zurich, Switzerland, 3Department of Cardiology, University of Zurich, Zurich, Switzerland
Synopsis
Keywords: Myocardium, Cardiovascular, ischemia, deep-learning, strains, remodelling, function
Motivation: To perform a retrospective analysis of the anatomical and functional remodelling of left ventricles 4 and 12 months after the ischemic event.
Goal(s): To assess differences in remodelling between patients with recovered function and those without.
Approach: A deep-learning framework was developed to fit a statistical shape model to all cardiac phases of each patient and compute strains, valve motion and morphological descriptors.
Results: Peak strain values and valve displacements at 4 and 12 months show different trends between patients with recovered function and those without. Peak-systolic shapes of patients with positive remodelling show a lower sphericity with respect to the others.
Impact: A deep learning framework reveals that relative changes in peak systolic anatomical shapes, radial and circumferential strains and valve motion after 4 months could provide a discriminator for predicting positive remodelling and restoration of functionality in patient with heart failure.
Introduction
Anatomical and functional remodelling in heart-failure patients is triggered by the reduced contractility and, failure to reach a physiological homeostasis, can lead to anatomical dilation and complete loss in contractility in large portions of the myocardium1. The prediction of the outcome of such remodelling is challenging. While clinically it is based on repeated measurements over time of ejection fraction (EF) variations2 recent investigations show that local anatomical metrics, such as strains, could be earlier descriptors of anatomical remodelling3-5. Shape features and local motion have been investigated as potential biomarkers for heart remodelling6,7.In this work we have further developed a deep learning approach8 for the quantification of physiological strains, valve motion and anatomy sphericity to determine whether these values are correlated with positive remodelling after 12 months.
Methods
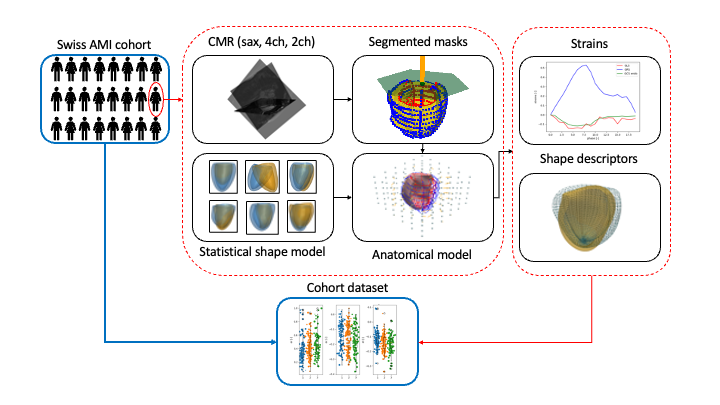
A total of 44 patients from a retrospective longitudinal study who underwent CMR examinations at the day of the ischemic event (T0) and 4 and 12 months later (T1 and T2, respectively) were processed9. Two groups were defined based on EF at T0 and T2: patients who did not improve (30 patients, group A) and patients with improved EF at T2 (14 patients, group B). The imaging protocol included cine images of short and long axis views.All cine images for each patient were segmented using the networks in8 and the resulting masks were the input to a fitting step where a statistical shape model was personalized to the anatomy of interest (Fig.1) . Specifically, first the weight of the modal contribution of the shape model were optimized to fit the masks, and finally local warping was used to adjust mesh point positions to match masks contours.
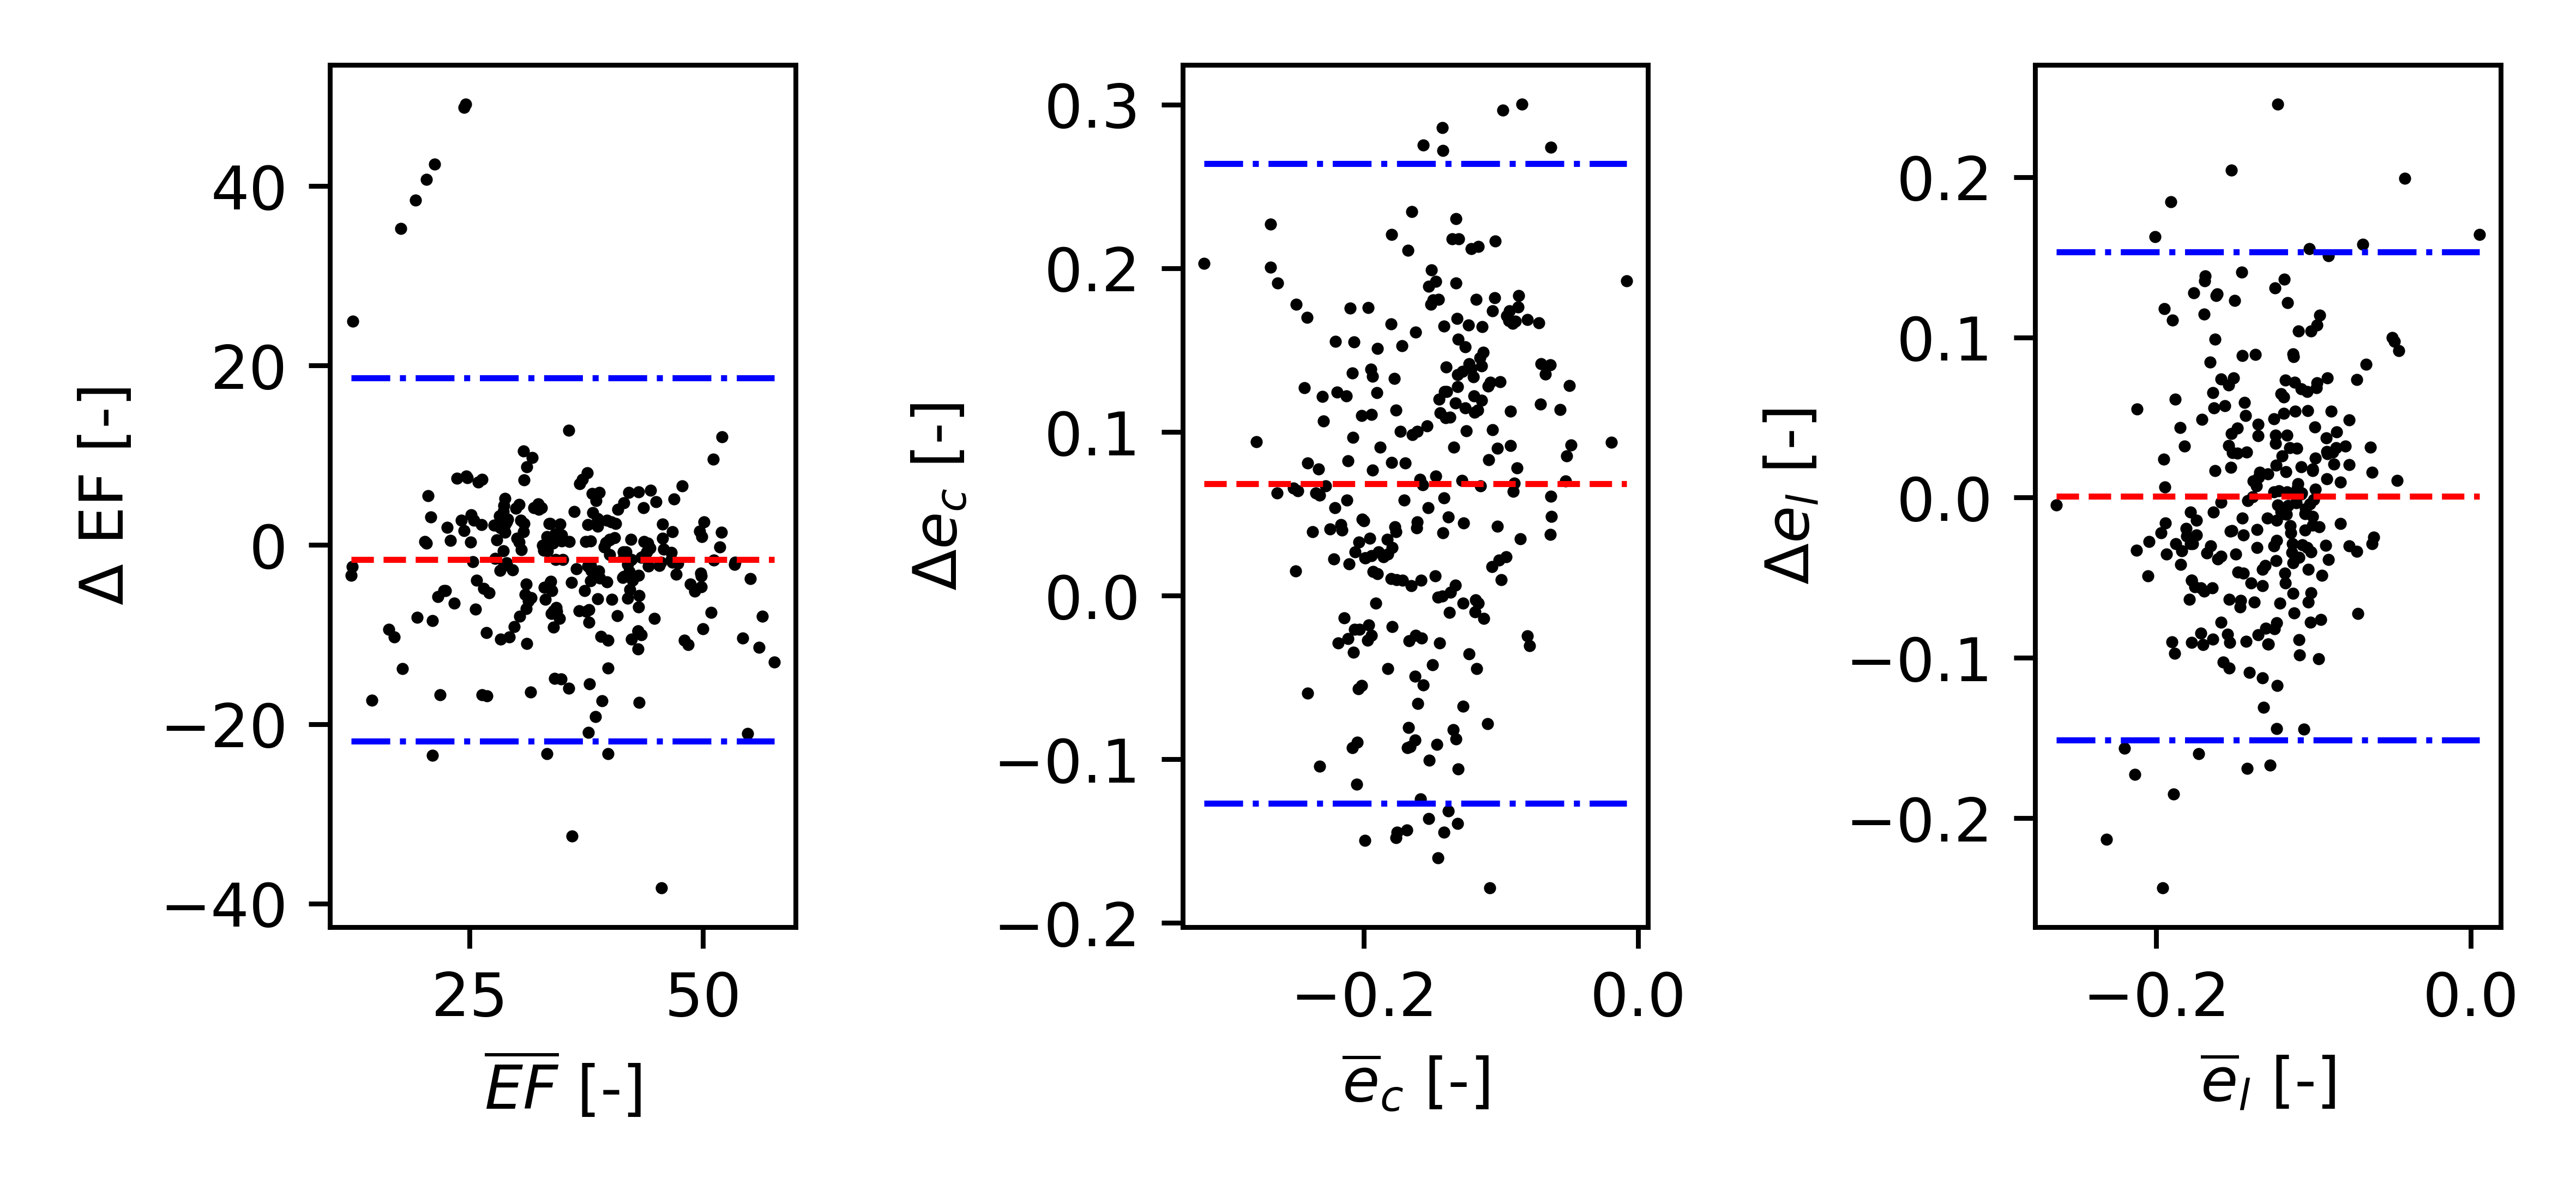
For each patient, peak systolic physiological strains were computed in the short and long axis planes of the cine images, and averaged for each cardiac phase8. Valve motion was computed as the displacement of the valve centre for each phase with respect to the end diastolic phase. Additionally, EF was computed from the blood pool volumes derived from the fitted meshes at peak systolic and end diastolic phases10. Circumferential and longitudinal strain values and EF were compared against the values derived from manual annotations performed by a clinician9.
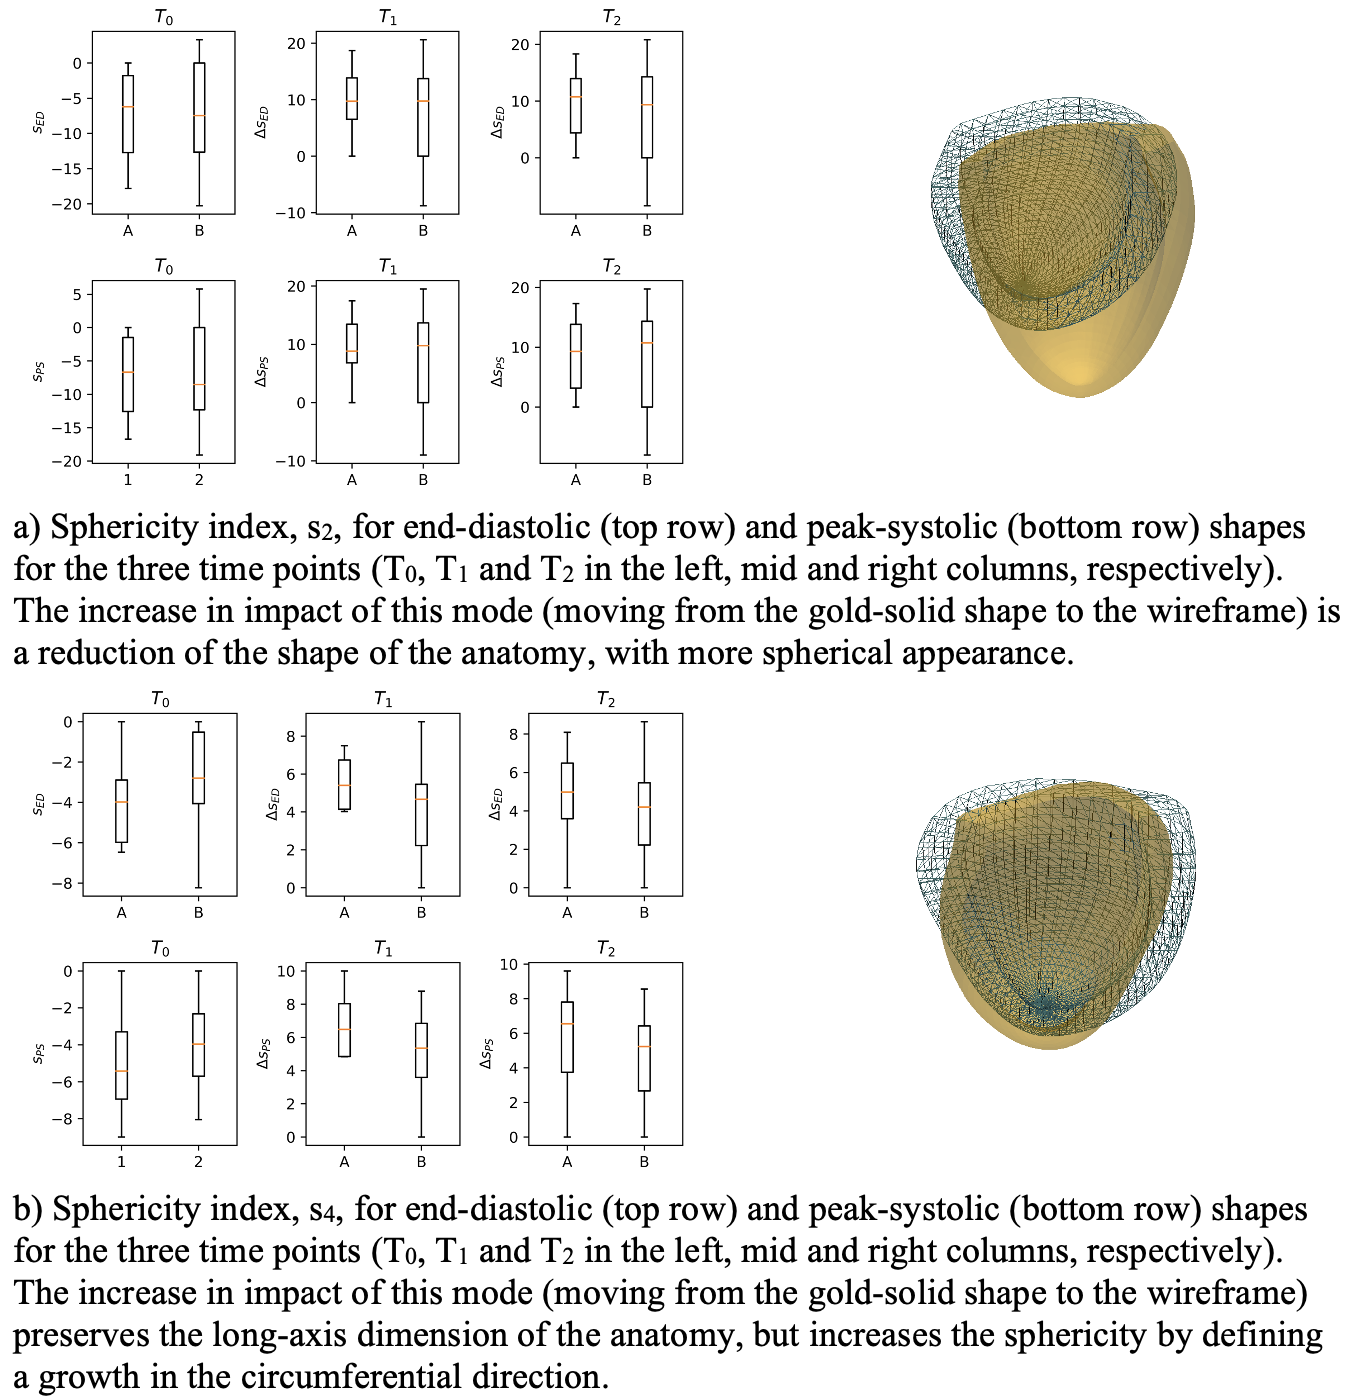
Peak-systolic and end-diastolic sphericity indices were computed by projecting the corresponding meshes onto a low-dimensional subspace generated by the shape model modes. As these modes encode well-defined features, it is possible to identify the relative mode that mostly contribute to the sphericity of the anatomy 10,11. In this case, two contributing modes were identified, mode 2 and 4 of the shape model in10 from which the sphericity indices s2 and s4 were calculated.
Functional and anatomical variations were normalized with respect to the initial value to compensate for different initial conditions and sizes of the heart. Statistical significance of results was computed with the Mann-Whitney U test.
Results
Figure 2 compares metrics extracted using our framework (ML) with those extracted from manual annotations (MA) for EF, circumferential and longitudinal peak systolic strains, ec and el, respectively. Figure 3 presents physiological strains and peak valve displacements at T0 for the two patient groups and their relative variation at T1 and T2 (values in Fig. 4).Figure 5 compares the low-dimensional parameters related to sphericity, s2 and s4 for the two groups over time and the relation between such parameters and shape morphology.Discussion
Our framework allows to quantify EF with negligible bias and good accuracy when compared with other model fitting methods presented in the literature12. Longitudinal strains in Figure 2, show no statistically significant differences. However, circumferential strains show larger errors and a bias.At T0 the two groups do not show significant difference in strain values. However, after 4 months, a substantial difference is observed as the group B has positive remodelled increasing contractility (improved radial and circumferential strains) with respect to group A (Table 1), and the positive recovery of cardiac function is observed also at T2. Group A worsens in both metrics during the first 12 months. Longitudinal strains and valve motion are instead partially recovered in group A, but with lower variations than in group B. The difference in remodelling is reflected in the values of the sphericity indices for T1 and T2, where lower values are observed for patients of group B.
The difference in these metrics between these two groups suggests that relative strain and shape variations after 4 months could be used as an indicator for the positive/adverse remodelling of patients with reduced ejection fraction following an ischemic event.
Acknowledgements
No acknowledgement found.References
[1] Martin G. St. John Sutton, Norman Sharpe (2000), ‘Left Ventricular Remodeling After Myocardial Infarction’,Circulation,101(25). 10.1161/01.CIR.101.25.2981
[2] RV Parikh et al (2023) ‘Developing Clinical Risk Prediction Models for Worsening Heart Failure Events and Death by Left Ventricular Ejection Fraction’, Journal of the American Heart Association, 21(19). 10.1161/JAHA.122.029736
[3] M Cikes and S Solomon (2016), ‘Beyond ejection fraction: an integrative approach for assessment of cardiac structure and function in heart failure’, European Heart
Journal, 37. 10.1093/eurheartj/ehv510.
[4] B Bijnens, et al. (2012), ‘Myocardial motion and deformation: What does it tell us and how does it relate to function’,Fetal Diagnosis and Therapy 32. doi:10.1159/000335649.
[5] B Bijnens, et al. (2012), ‘Velocity and deformation imaging for the assessment of myocardial dysfunction’, European Journal of Echocardiography 10. doi:doi.org/10.1093/ejechocard/jen323.
[6] JC Acero et. al (2022), ‘Understanding and Improving Risk Assessment After Myocardial Infarction Using Automated Left Ventricular Shape Analysis’, JACC: Cardiovascular Imaging, 15(9). 10.1016/j.jcmg.2021.11.027
[7] G Pizarro and B Ibáñez (2022), ‘Post-Myocardial Infarction Risk Prediction: Does Ventricular Shape Matter?’, JACC: Cardiovascular Imaging, 15(9). doi.org/10.1016/j.jcmg.2022.07.003.
[8] T. Joyce et al. (2022), ‘Rapid inference of personalised left-ventricular meshes by deformation-based differentiable mesh voxelization’, Medical Image Analysis, 79. doi.org/10.1016/j.media.2022.102445.
[9] M Gastl et. al, (2020) ‘Effect of intracoronary bone marrow-derived mononuclear cell injection early and late after myocardial infarction on CMR-derived myocardial strain’, International Journal of Cardiology, 310, 108-115.doi.org/10.1016/j.ijcard.2020.01.025
[10] S. Buoso, et al. (2021), ‘Personalising left-ventricular biophysical models of the heart using parametric physics-informed neural networks’, Medical Image Analysis, 71. doi.org/10.1016/j.media.2021.102066.
[11] S. Buoso et al. (2023), ’MRXCAT2.0: Synthesis of realistic numerical phantoms by combining left-ventricular shape learning, biophysical simulations and tissue texture generation’. Journal of Cardiovascular Magnetic Resonance 25(25). doi.org/10.1186/s12968-023-00934-z
[12] W.G. O'Dell (2019), ‘Accuracy of Left Ventricular Cavity Volume and Ejection Fraction for Conventional Estimation Methods and 3D Surface Fitting’, Journal of the American Heart Association, 8(6). doi:10.1161/JAHA.118.009124
Figures
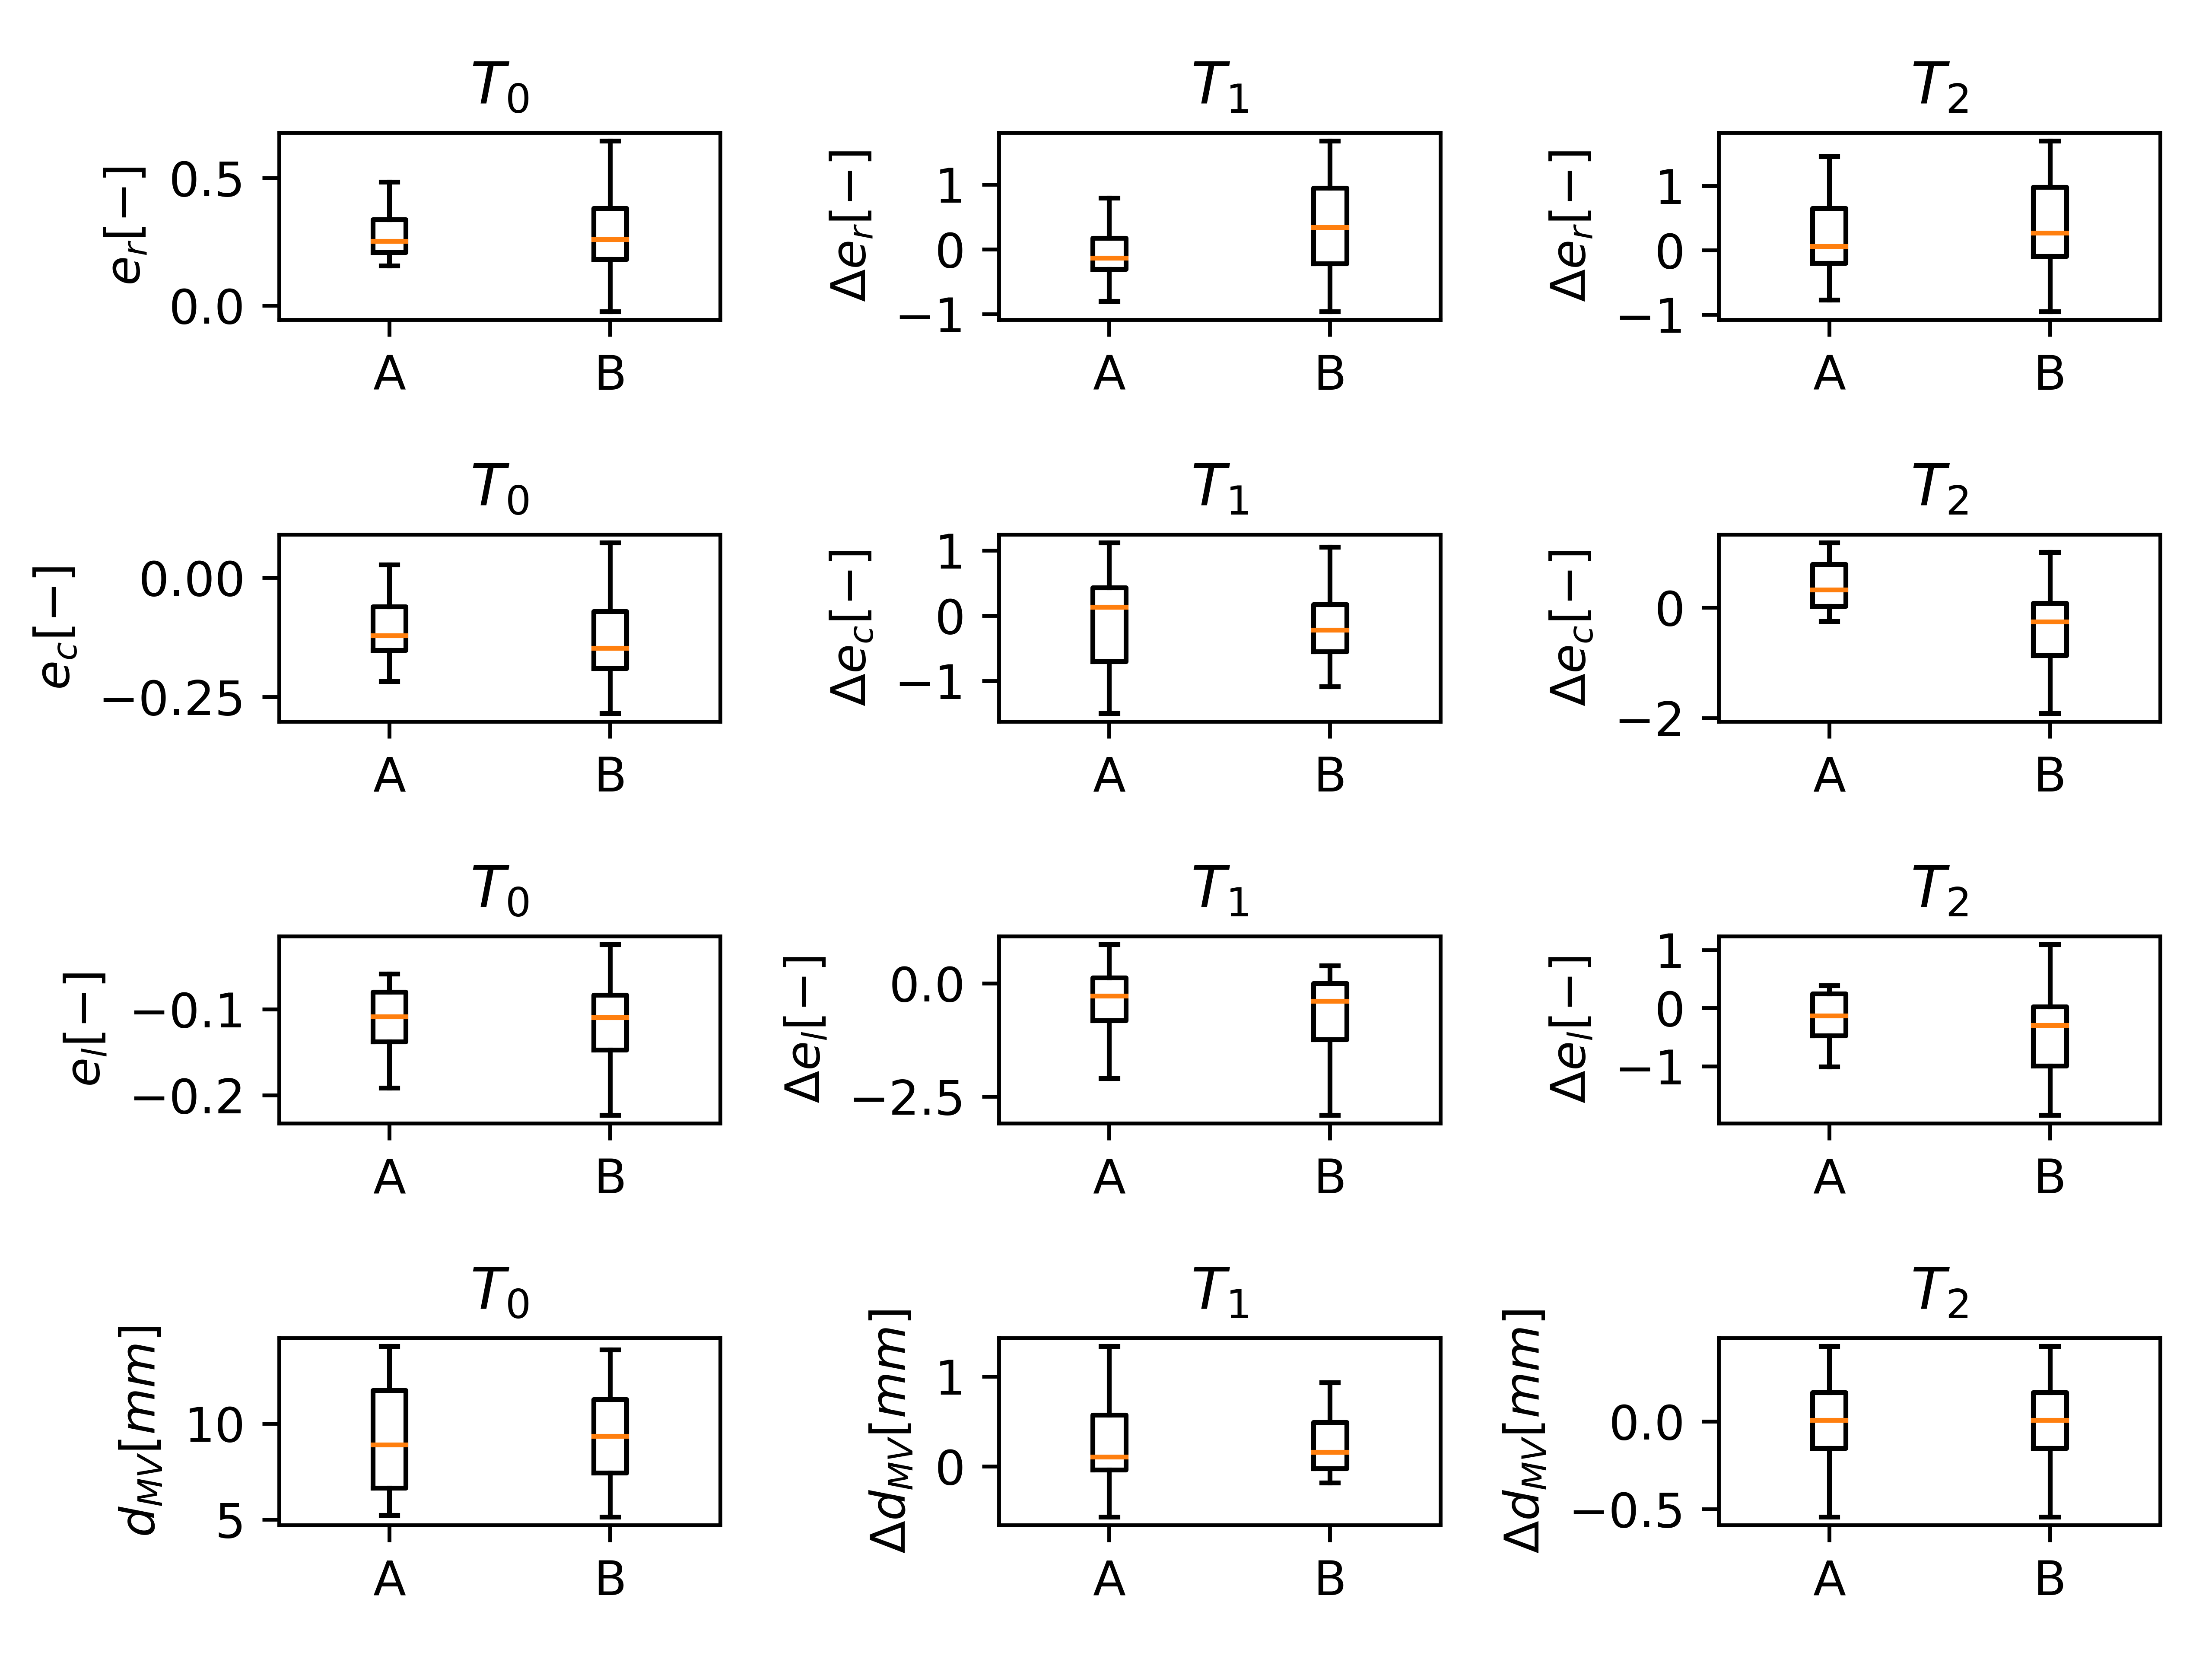
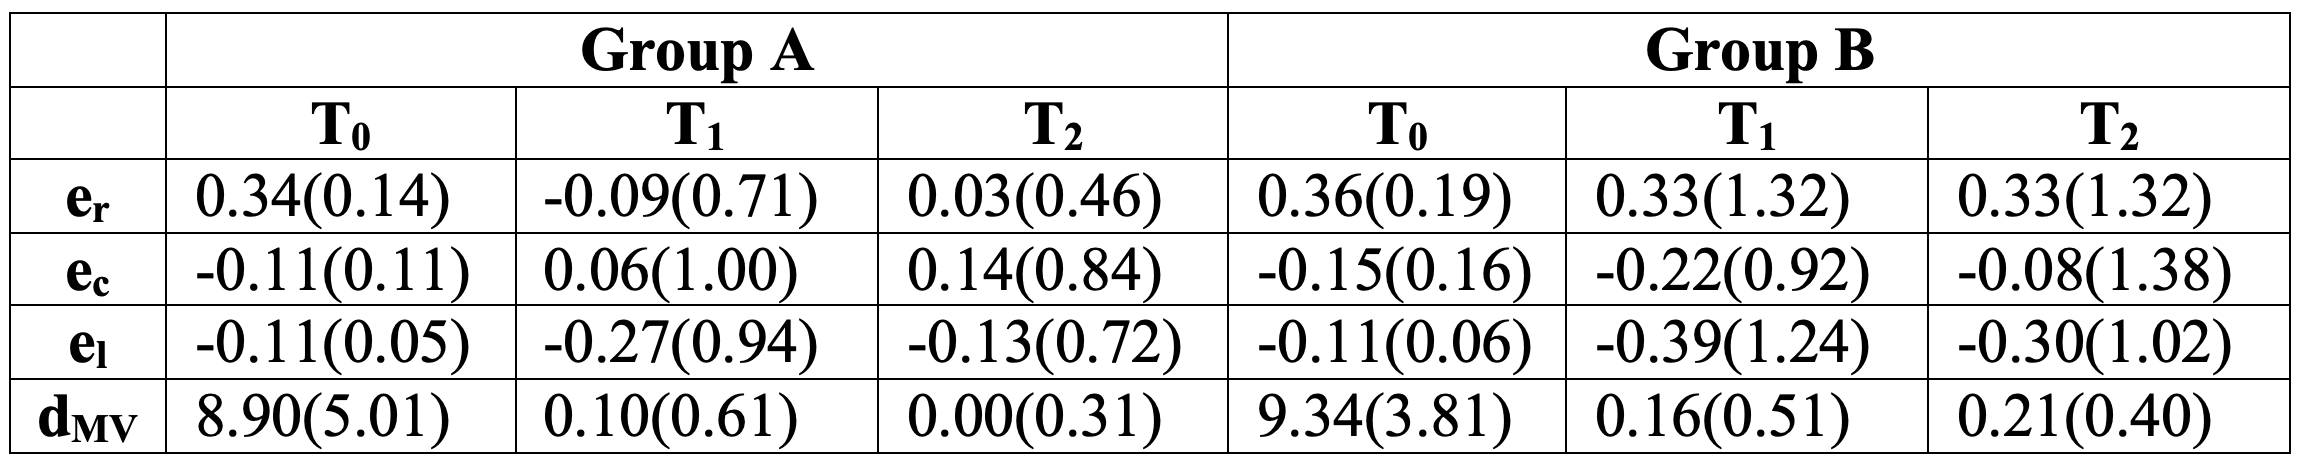
Median (interquartile range) strain values and valve displacements for groups A and B and the three different time points considered. At T0, the values are absolute, while for T1 and T2 the median and interquartile ranges are computed as the difference from the initial T0 values and normalized with the absolute values at T0.