0612
Snap, Crackle And Pop: Benefits of Serial Motion Compensation in Cardiac Diffusion Tensor Imaging1Leeds Institute of Cardiovascular and Metabolic Medicine, University of Leeds, Leeds, United Kingdom, 2Cardiff University Brain Research Imaging Centre (CUBRIC), School of Psychology, Cardiff University, Cardiff, United Kingdom, 3Medical Radiation Physics, Lund University, Lund, Sweden
Synopsis
Keywords: Myocardium, Myocardium, motion compensation, gradient moment nulling
Motivation: Cardiac diffusion tensor imaging (cDTI) based on spin-echo employs up to 2nd order (M2) motion compensated diffusion gradients. It is unclear whether higher order motion compensation would be beneficial.
Goal(s): To evaluate the impact of higher order motion compensation (i.e. velocity, acceleration, jerk, snap, crackle and pop) in cDTI.
Approach: Diffusion gradient waveforms with M1 to M6 motion compensation were designed and implemented in a prospective study of healthy volunteers. Mean diffusivity and fractional anisotropy maps were quantitatively evaluated.
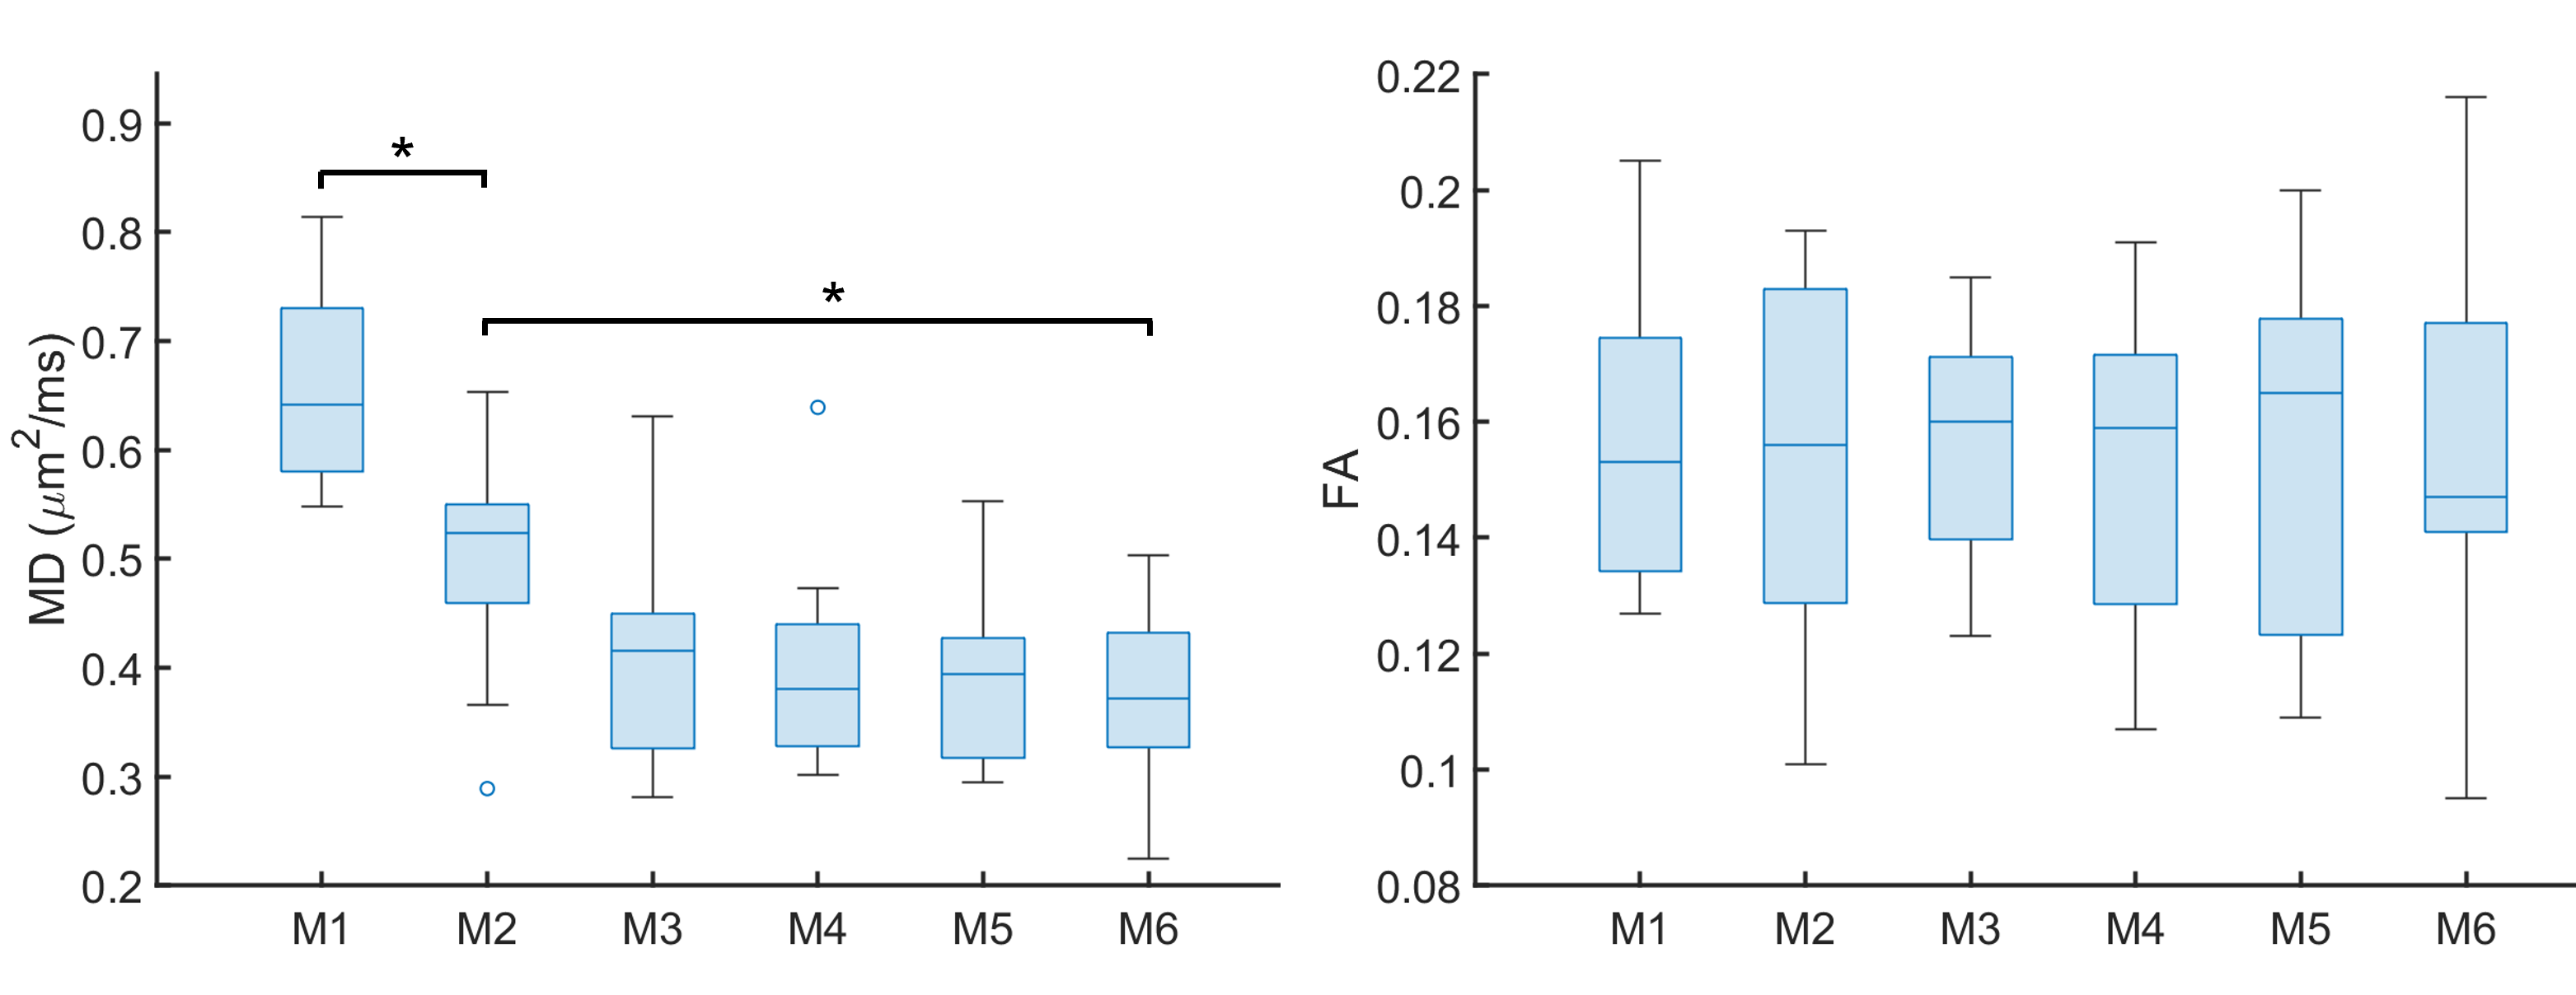
Results: Significant reductions in MD and MD heterogeneity were observed in the M6 relative to M2 compensated data.
Impact: We demonstrate the potential importance of compensating for higher orders of motion (>M2) in cardiac diffusion MRI. This work may inform gradient waveform design for more accurate and robust cardiac diffusion MRI.
Introduction
Cardiac diffusion tensor imaging (cDTI) is rapidly gaining traction as a method for contrast-agent free in vivo myocardial tissue characterisation. It is well-established that motion-compensation techniques are required in specific applications of cDTI. In particular, the use of up to 2nd order motion compensated diffusion gradient waveforms has become standard practice in both spin-echo echo planar imaging1 and balanced steady-state free precession2. This was corroborated in a study of rat heart with up to 3rd order motion compensation3, where it was found that 2nd order motion compensated waveforms were the best compromise in practice, after taking into account the lower signal-to-noise ratio (SNR) associated with the longer TE required for 3rd order motion compensation. More recently, we have demonstrated that up to 3rd order motion compensation can be achieved with reasonable TE, using the Connectom scanner4, and have applied up to 4th order motion compensation investigating the effects of time dependent diffusion5. The requirements for motion compensation in cDTI are however, not fully understood.In this study, we evaluate the effects of M1 to M6 motion compensated diffusion gradient waveforms (i.e. velocity, acceleration, jerk, snap, crackle and pop compensation) on cDTI parameters, and investigate whether cDTI may benefit from higher order motion compensation than is currently the norm.
Methods
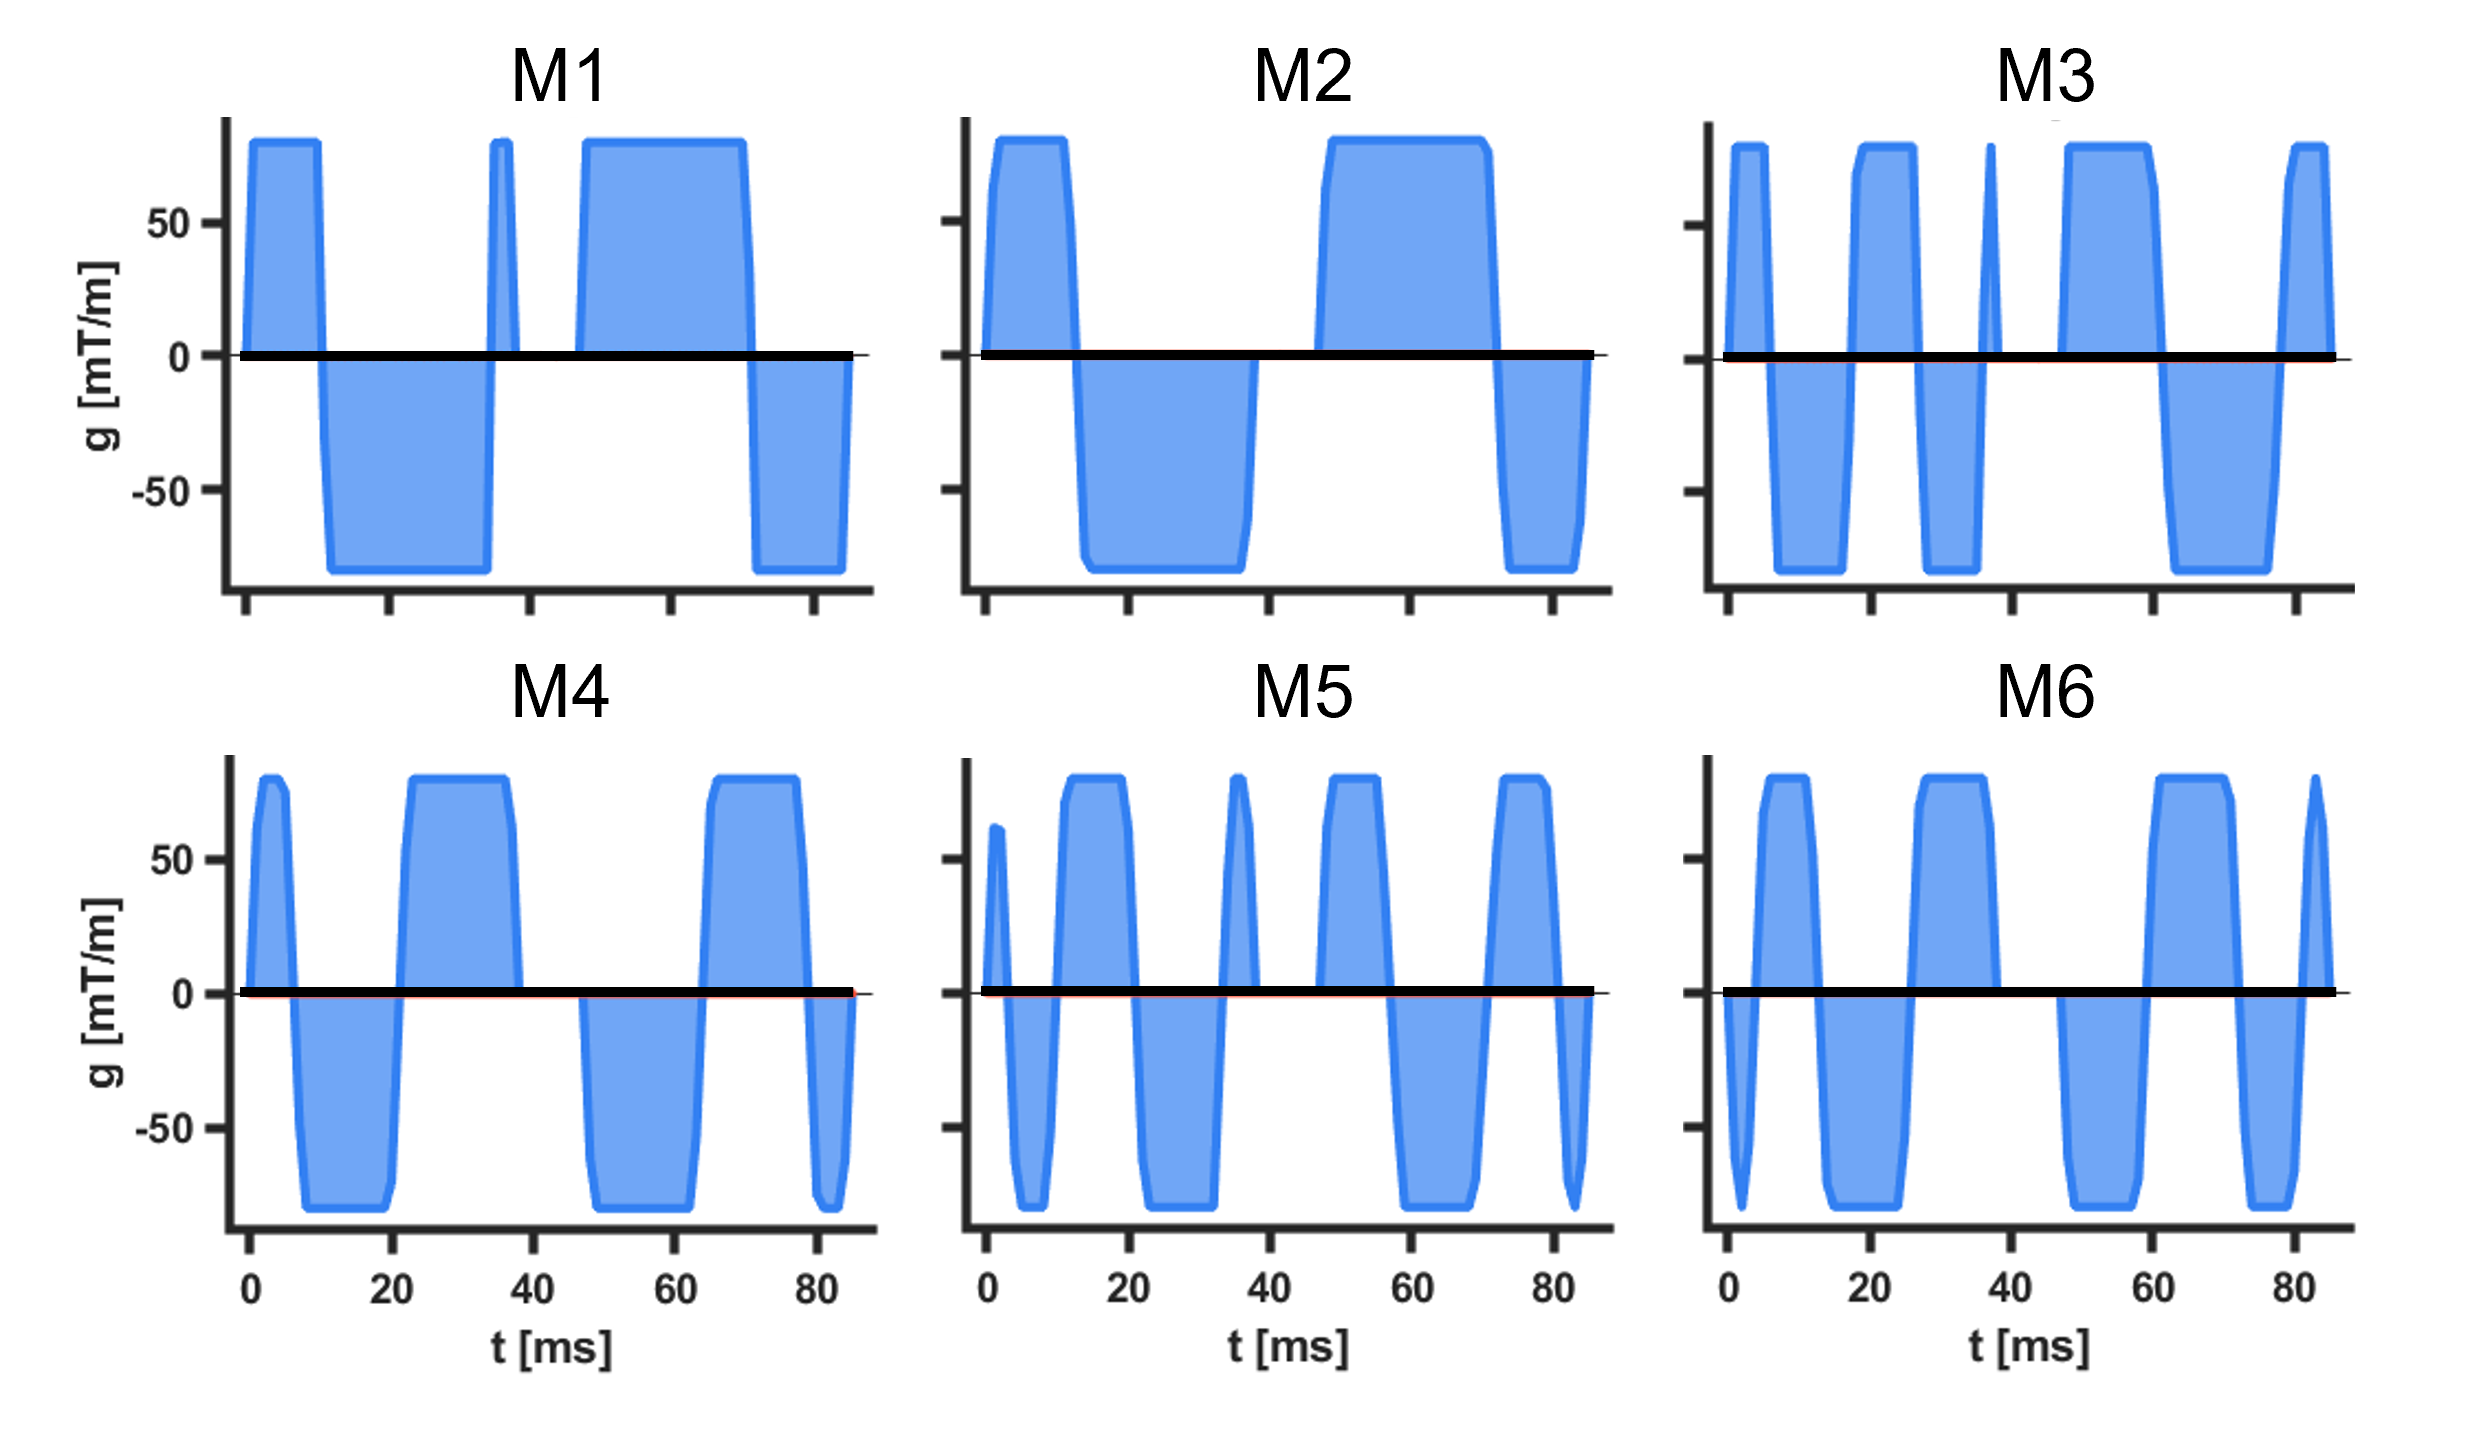
Data were acquired in healthy volunteers (N = 9) on a Prisma 3T MRI scanner (Siemens Healthineers, Erlangen, Germany). Volunteers provided written consent, and the study was performed under approved ethics. DTI data were acquired with a prototype single-shot spin-echo sequence with EPI-readout and Zoom-IT for reduced FOV imaging6. Subjects were scanned free-breathing and with cardiac-triggering. Parameters were TR = 3 RR-intervals, TE = 113 ms, resolution = 2.5 × 2.5 × 8 mm3, 3 slices, field-of-view = 320 × 111 mm2, blow = 0.05 ms/µm2 with 3 orthogonal directions, bhigh = 0.35 ms/µm2 with 18 non-colinear directions7, diffusion encoding directions were mirrored for full-sphere coverage, #repetitions = 2, acquisition time per waveform ~4.2 min based on 60 beats per minute. Data were acquired with M1 to M6 compensated diffusion gradient waveforms (Figure 1). The diffusion gradient waveforms were generated in the open-source optimisation framework (https://github.com/jsjol/NOW), with compensation for motion and concomitant gradients8. Mn compensation implies compensation of up to and including nth order motion. All images within-subject were rigidly registered to a common M6 reference image. Diffusion tensors were fitted using weighted least squares. Images were manually segmented and sub-divided into 16 AHA segments. The global average mean diffusivity (MD) are fractional anisotropy (FA) are reported, along with the standard deviation of MD and FA across all voxels as a measure of regional heterogeneity. Dunnett’s one-way ANOVA was used as a multiple comparisons test for differences with respect to M2 compensated control data, with significance level p < 0.05.Results
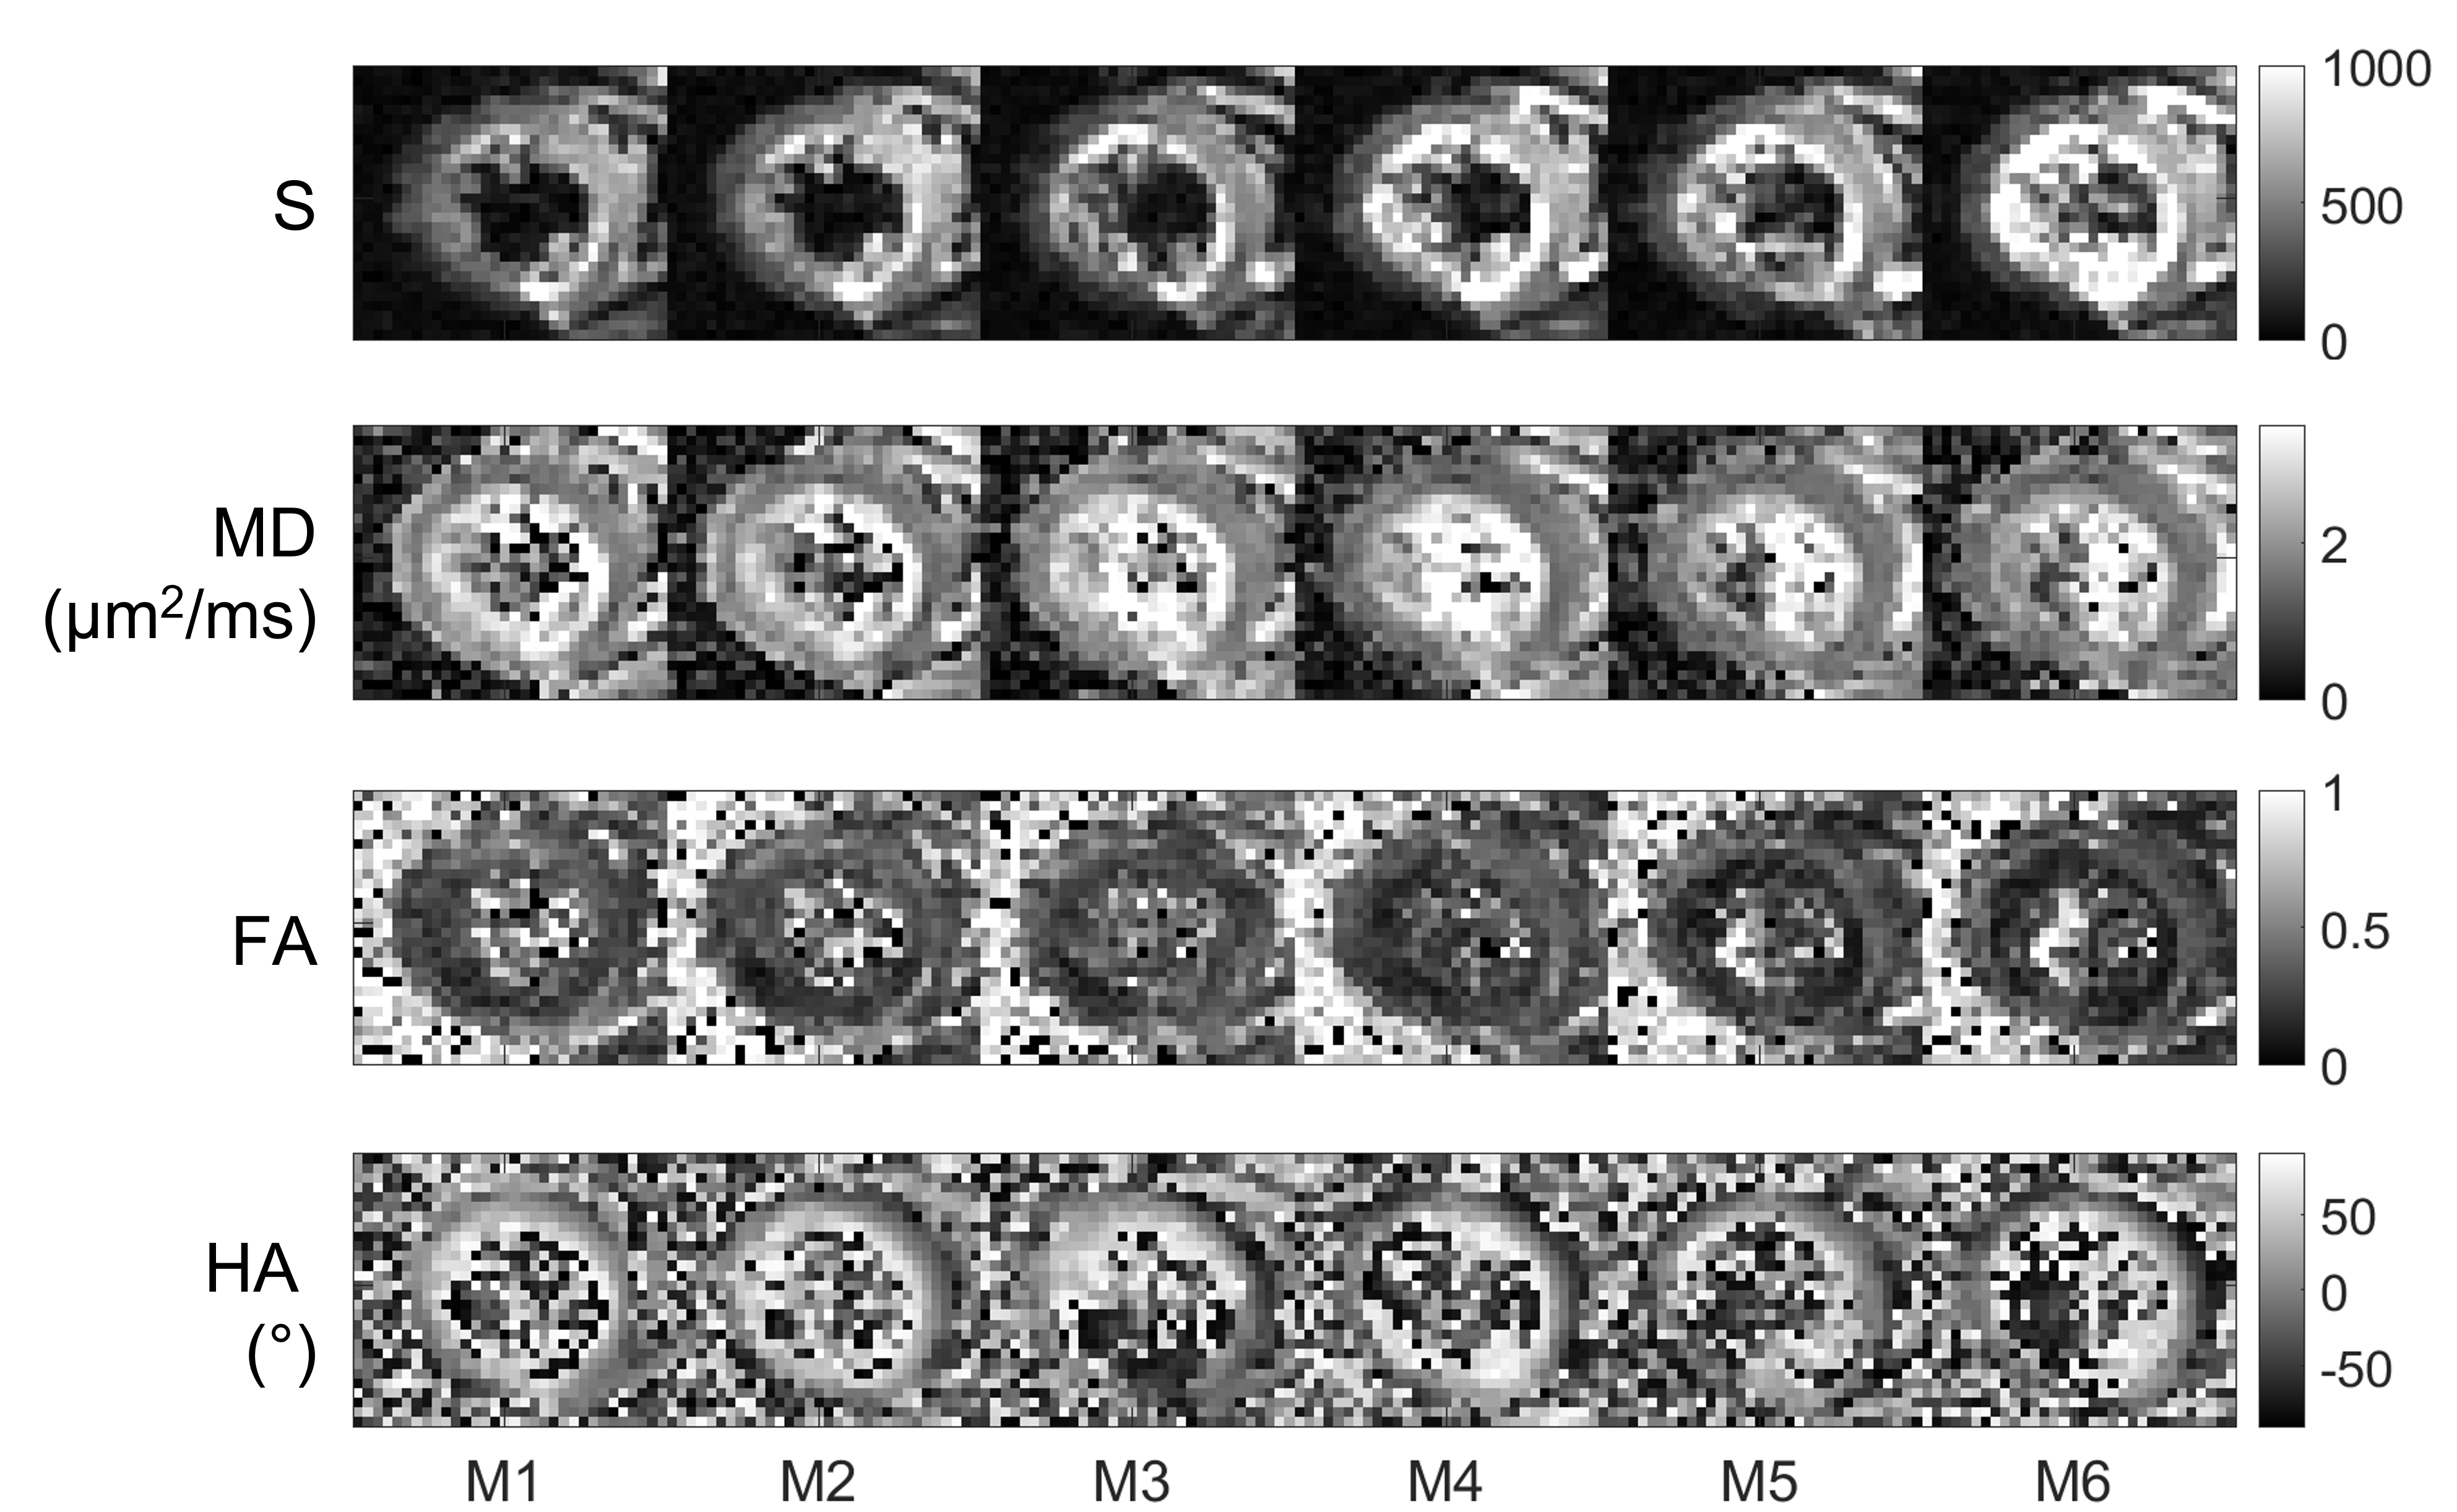
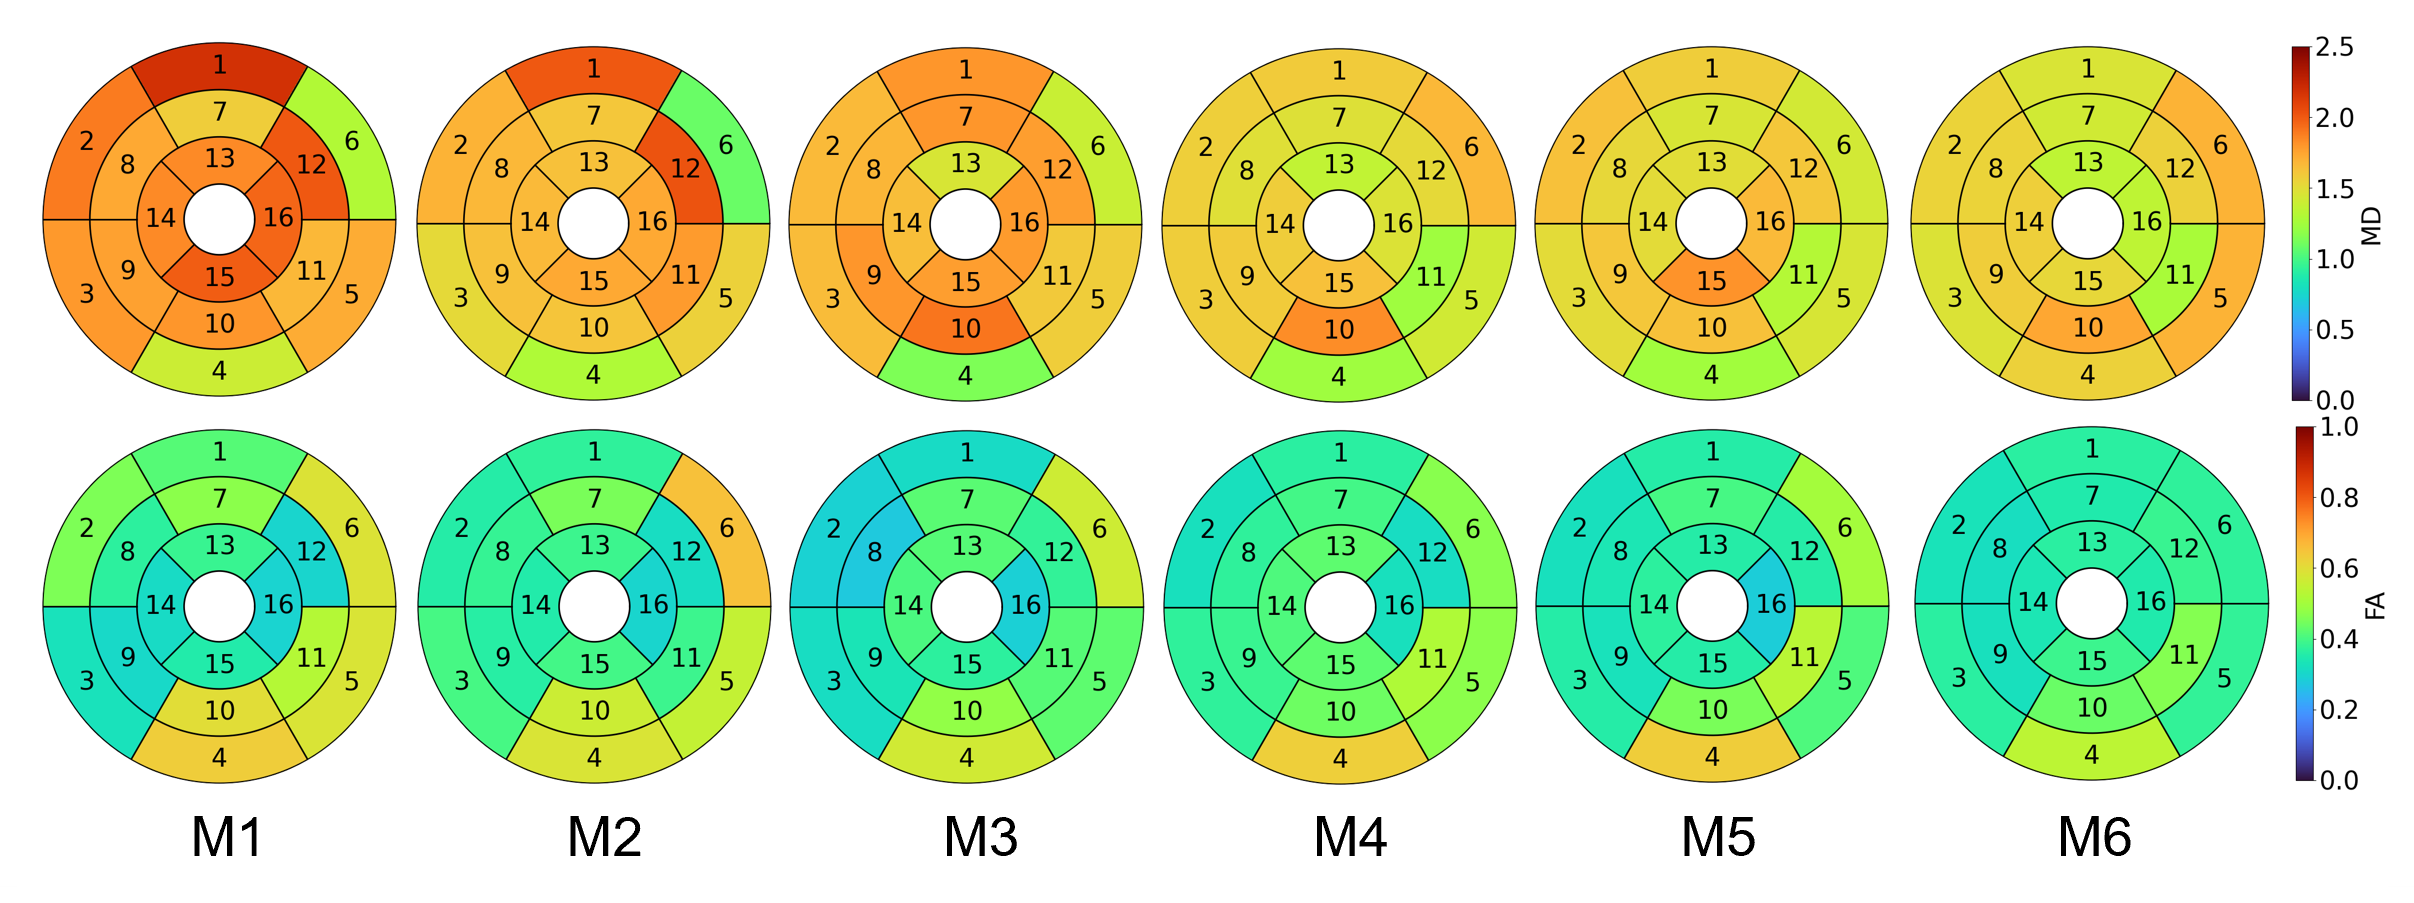
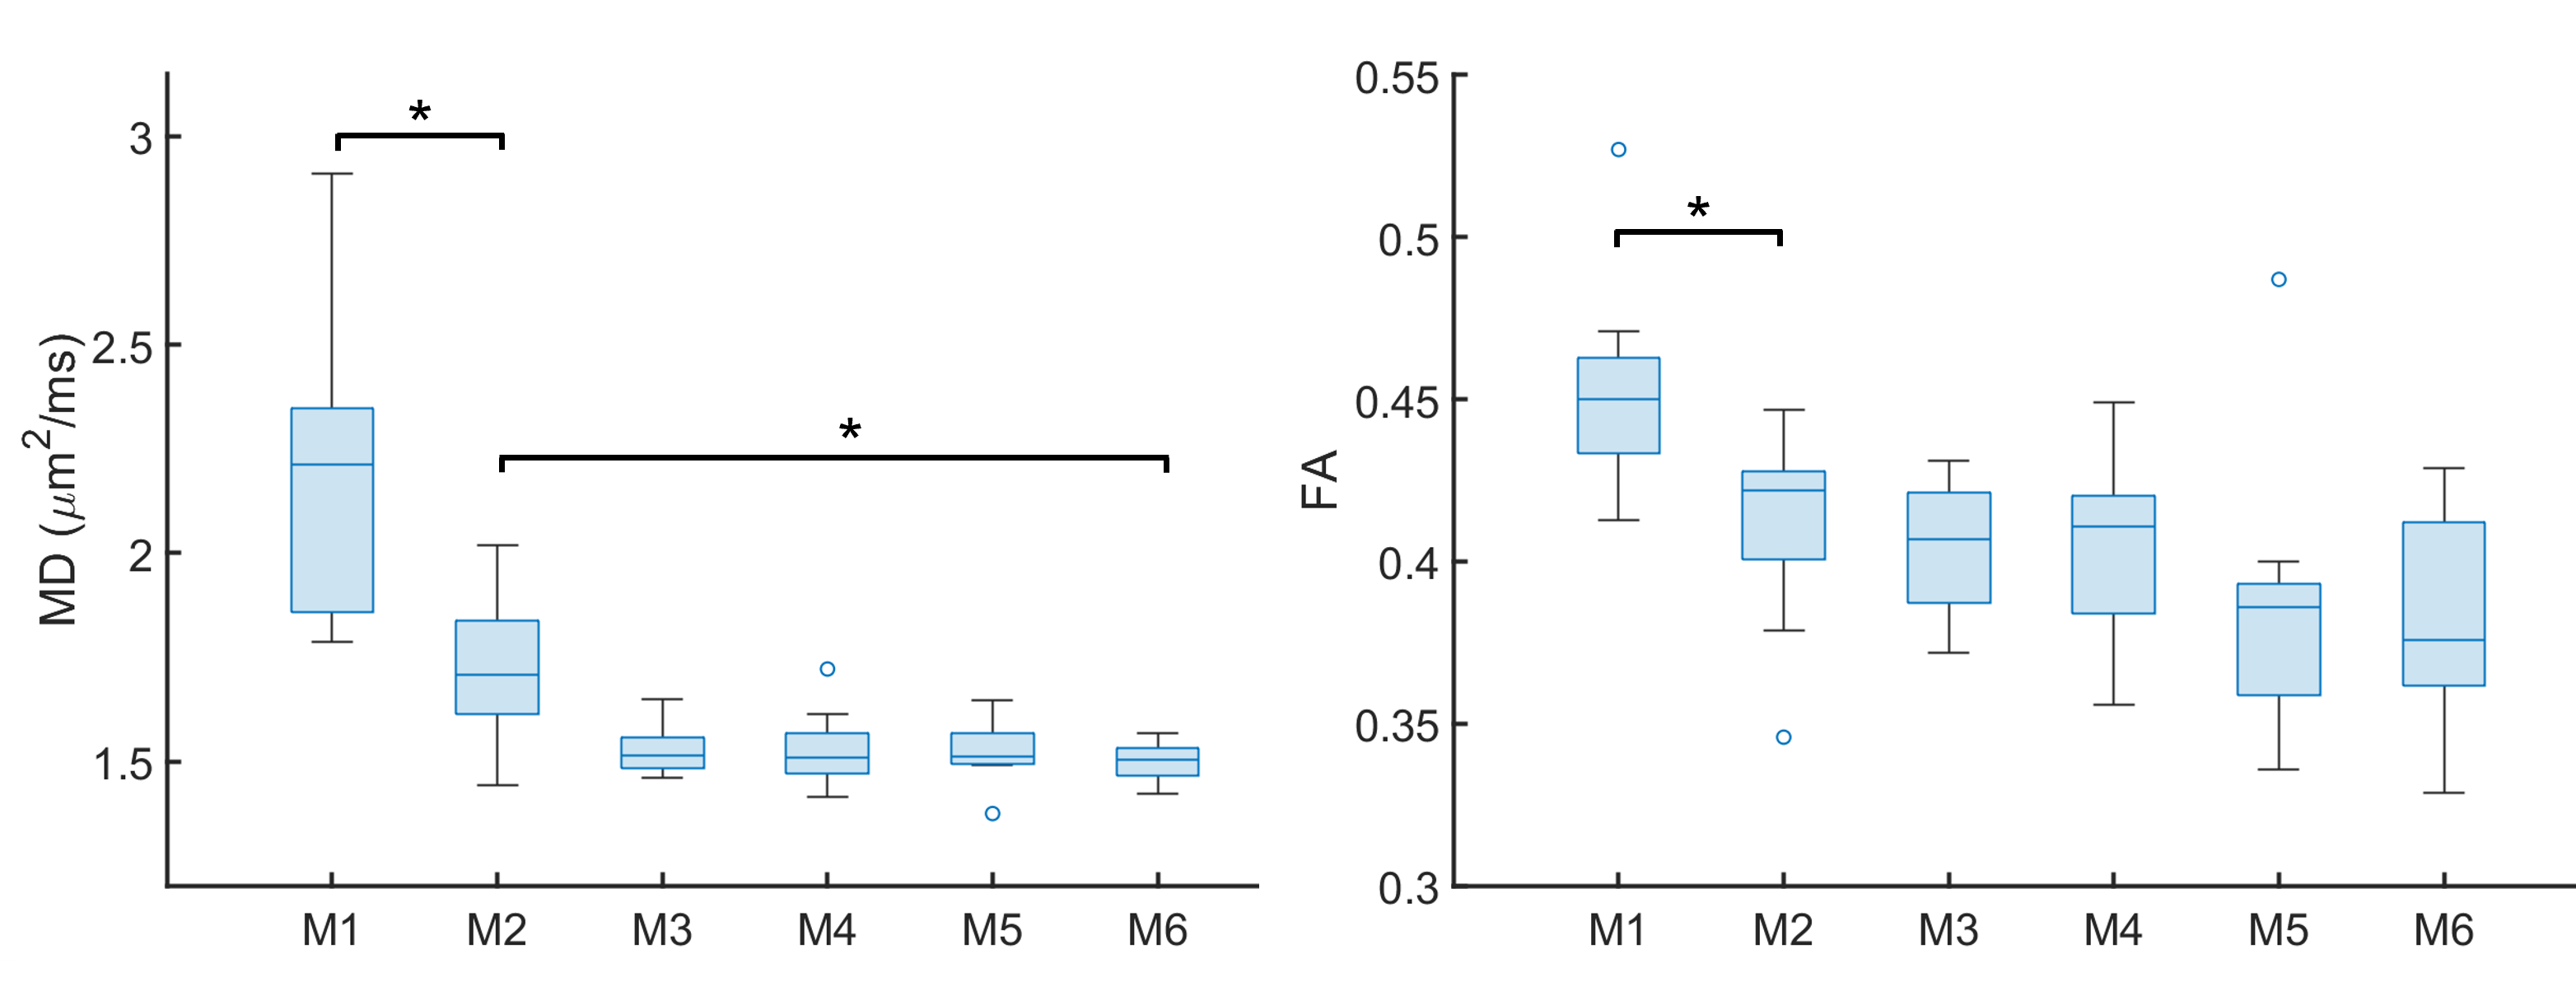
Representative diffusion-weighted images and DTI maps (Figure 2) illustrate increased recovery of signal in the left ventricular blood pool with higher orders of motion compensation. The quality of DTI maps was comparable. The AHA 16-segment plot shows a visual reduction in MD and FA with increasing orders of motion compensation (Figure 3). This reduction was found to be significant in MD (Figure 4) and heterogeneity of MD (Figure 5), considering M6 relative to M2.Discussion
The current standard of motion compensation in cardiac diffusion MRI is M2 compensation, which represents the best compromise between motion compensation and SNR. Uncompensated motion is known to lead to higher MD due to signal dropouts in the diffusion-weighted data (see M1 data). Similarly, low SNR can result in an upward bias in FA9. Here, we demonstrated changes in MD and FA that were consistent with improved motion compensation i.e. reduced MD and FA with higher order motion compensation. Given that diffusion-weighting generally becomes less efficient with higher order motion compensation necessitating longer TE, it may be that M4 offers a better balance of more robust motion compensation than M2, within a feasible TE.One limitation of >M2 motion compensated sequences is the longer TE compared to M2 compensated sequences, a consequence of limited gradient performance. With the advent of next-generation scanners with ultra-high performance gradient systems, it will be possible to achieve shorter TEs and sufficient SNR, whilst increasing the order of motion compensation for more robust and accurate cardiac diffusion MRI4.
Conclusion
Higher order (> M2) motion compensation yielded lower MD and MD heterogeneity compared to current methods with M2 motion compensation. This highlights the potential importance of higher order motion compensation in gradient waveform design for cardiac diffusion MRI.Acknowledgements
We thank Siemens Healthcare for the pulse sequence development environment. This work was supported by the British Heart Foundation, UK (PG/19/1/34076, CH/16/2/32089), and the Wellcome Trust (219536/Z/19/Z).References
1. Stoeck CT, von Deuster C, Genet M, Atkinson D, Kozerke S. Second-order motion-compensated spin echo diffusion tensor imaging of the human heart. Magnetic resonance in medicine : official journal of the Society of Magnetic Resonance in Medicine / Society of Magnetic Resonance in Medicine. 2016;75:1669-1676. doi: 10.1002/mrm.25784
2. Nguyen C, Fan Z, Xie Y, Pang J, Speier P, Bi X, Kobashigawa J, Li D. In vivo diffusion-tensor MRI of the human heart on a 3 tesla clinical scanner: An optimized second order (M2) motion compensated diffusion-preparation approach. Magnetic resonance in medicine : official journal of the Society of Magnetic Resonance in Medicine / Society of Magnetic Resonance in Medicine. 2016;76:1354-1363. doi: 10.1002/mrm.26380
3. Welsh CL, DiBella EV, Hsu EW. Higher-Order Motion-Compensation for In Vivo Cardiac Diffusion Tensor Imaging in Rats. IEEE transactions on medical imaging. 2015;34:1843-1853. doi: 10.1109/TMI.2015.2411571
4. Afzali M, Müller L, Coveney S, Fasanio F, Evans J, Engel M, Szczepankiewicz F, Teh I, Dall'Armellina E, Jones DK, et al. Cardiac diffusion MRI using Connectom scanner. Paper/Poster presented at: Proc Int Soc Magn Reson Med; 2023; Toronto.
5. Teh I, Coveney S, Foster RJ, Szczepankiewicz F, Lasic S, Lundell H, Shelley D, Müller L, Afzali M, Sharrack N, et al. Time-dependent diffusion in the human heart in vivo. Paper/Poster presented at: Proc Int Soc Magn Reson Med; 2023; Toronto.
6. Szczepankiewicz F, Sjolund J, Stahlberg F, Latt J, Nilsson M. Tensor-valued diffusion encoding for diffusional variance decomposition (DIVIDE): Technical feasibility in clinical MRI systems. PloS one. 2019;14:e0214238. doi: 10.1371/journal.pone.0214238
7. Cook PA, Symms M, Boulby PA, Alexander DC. Optimal acquisition orders of diffusion-weighted MRI measurements. Journal of Magnetic Resonance Imaging. 2007;25:1051-1058. doi: 10.1002/jmri.20905
8. Szczepankiewicz F, Sjolund J, Dall'Armellina E, Plein S, Schneider JE, Teh I, Westin CF. Motion-compensated gradient waveforms for tensor-valued diffusion encoding by constrained numerical optimization. Magnetic resonance in medicine : official journal of the Society of Magnetic Resonance in Medicine / Society of Magnetic Resonance in Medicine. 2021;85:2117-2126. doi: 10.1002/mrm.28551
9. Jones DK, Basser PJ. "Squashing peanuts and smashing pumpkins": how noise distorts diffusion-weighted MR data. Magnetic resonance in medicine : official journal of the Society of Magnetic Resonance in Medicine / Society of Magnetic Resonance in Medicine. 2004;52:979-993. doi: 10.1002/mrm.20283
Figures