0610
Phenotypic clustering using cardiovascular magnetic resonance for risk stratification in beta-thalassemia major1Fondazione G. Monasterio CNR-Regione Toscana, Pisa, Italy, 2Azienda Ospedaliera "Garibaldi" Presidio Ospedaliero Nesima, Catania, Italy, 3Ospedale del Delta, Lagosanto (FE), Italy, 4Gemelli Molise SpA, Fondazione di Ricerca e Cura "Giovanni Paolo II", Campobasso, Italy, 5Azienda Ospedaliero-Universitaria Ospedali Riuniti "Umberto I-Lancisi-Salesi", Ancona, Italy, 6Policlinico "Paolo Giaccone", Palermo, Italy, 7Presidio Ospedaliero “Giovanni Paolo II”, Lamezia Terme (CZ), Italy, 8Ospedale “SS. Annunziata” ASL Taranto, Taranto, Italy, 9Azienda Ospedaliero-Universitaria di Sassari, Sassari, Italy, 10Policlinico S. Orsola "L. e A. Seragnoli", Bologna, Italy
Synopsis
Keywords: Myocardium, Heart
Motivation: Machine learning algorithms provide a means to uncover hidden patterns within complex and heterogeneous datasets.
Goal(s): We aimed to identify phenogroups among patients with β-thalassemia major (TM) using an unsupervised clustering approach based on demographic, clinical, and CMR data.
Approach: We considered 356 β-TM patients who underwent MR for the assessment of iron overload, biventricular function and atrial, and replacement myocardial fibrosis.
Results: We identified three mutually exclusive phenogroups characterized by different biventricular function parameters and frequency of replacement myocardial fibrosis and by a different prospective risk of cardiovascular complications.
Impact: In TM, unsupervised clustering integrating routinely measured CMR parameters conveys the potential to significantly impact patient care and improve cardiovascular outcomes by enabling early detection of cardiac remodeling and damage, as well as improved risk stratification.
Introduction
Cardiovascular Magnetic Resonance (CMR) plays a key role in the management of beta-thalassemia major (β-TM) patients 1,2, characterized by a high heterogeneity in terms of cardiac involvement and responses to treatment. The interpretation and integration of CMR, demographic and clinical parameters can be complex and challenging, often requiring expert knowledge and experience. Machine learning algorithms provide a means to uncover hidden patterns within complex and heterogeneous datasets 3,4.Aims
This multicenter study aimed to identify phenogroups among patients with β-TM using an unsupervised clustering approach based on demographic, clinical, and CMR data and to determine the clinical and prognostic implications of the detected phenogroups.Methods
We considered 356 β-TM patients consecutively enrolled in the Myocardial Iron Overload in Thalassemia (MIOT) Network 5 who underwent MR for the quantification of hepatic and cardiac iron overload (T2* technique) 6,7, the assessment of biventricular size and function and atrial dimensions (cine images) 8, and the detection of replacement myocardial fibrosis (late gadolinium enhancement technique) 9.We included in the analysis 11 continuous variables (age, serum ferritin, liver iron concentration-LIC, global heart T2*, right and left end-diastolic volume indexes, right and left atrial area indexes, left ventricular mass, right and left ventricular ejection fraction), and 2 categorical variables (sex and replacement myocardial fibrosis). Phenogroups were defined using an unsupervised hierarchical clustering on principal components (HCPC) approach. A multiple-factor analysis (MFA), an extension of principal component analysis (PCA), was conducted to reduce the dimensionality of the dataset and the hierarchical clustering algorithm was applied to the principal component space.
Results
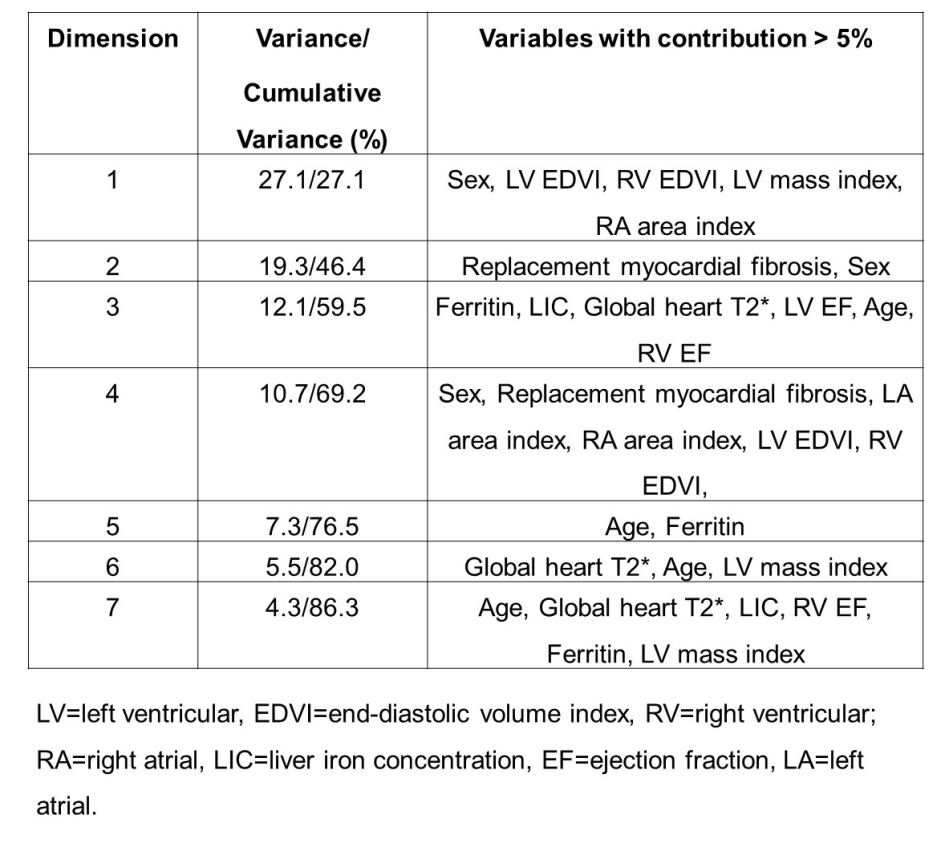
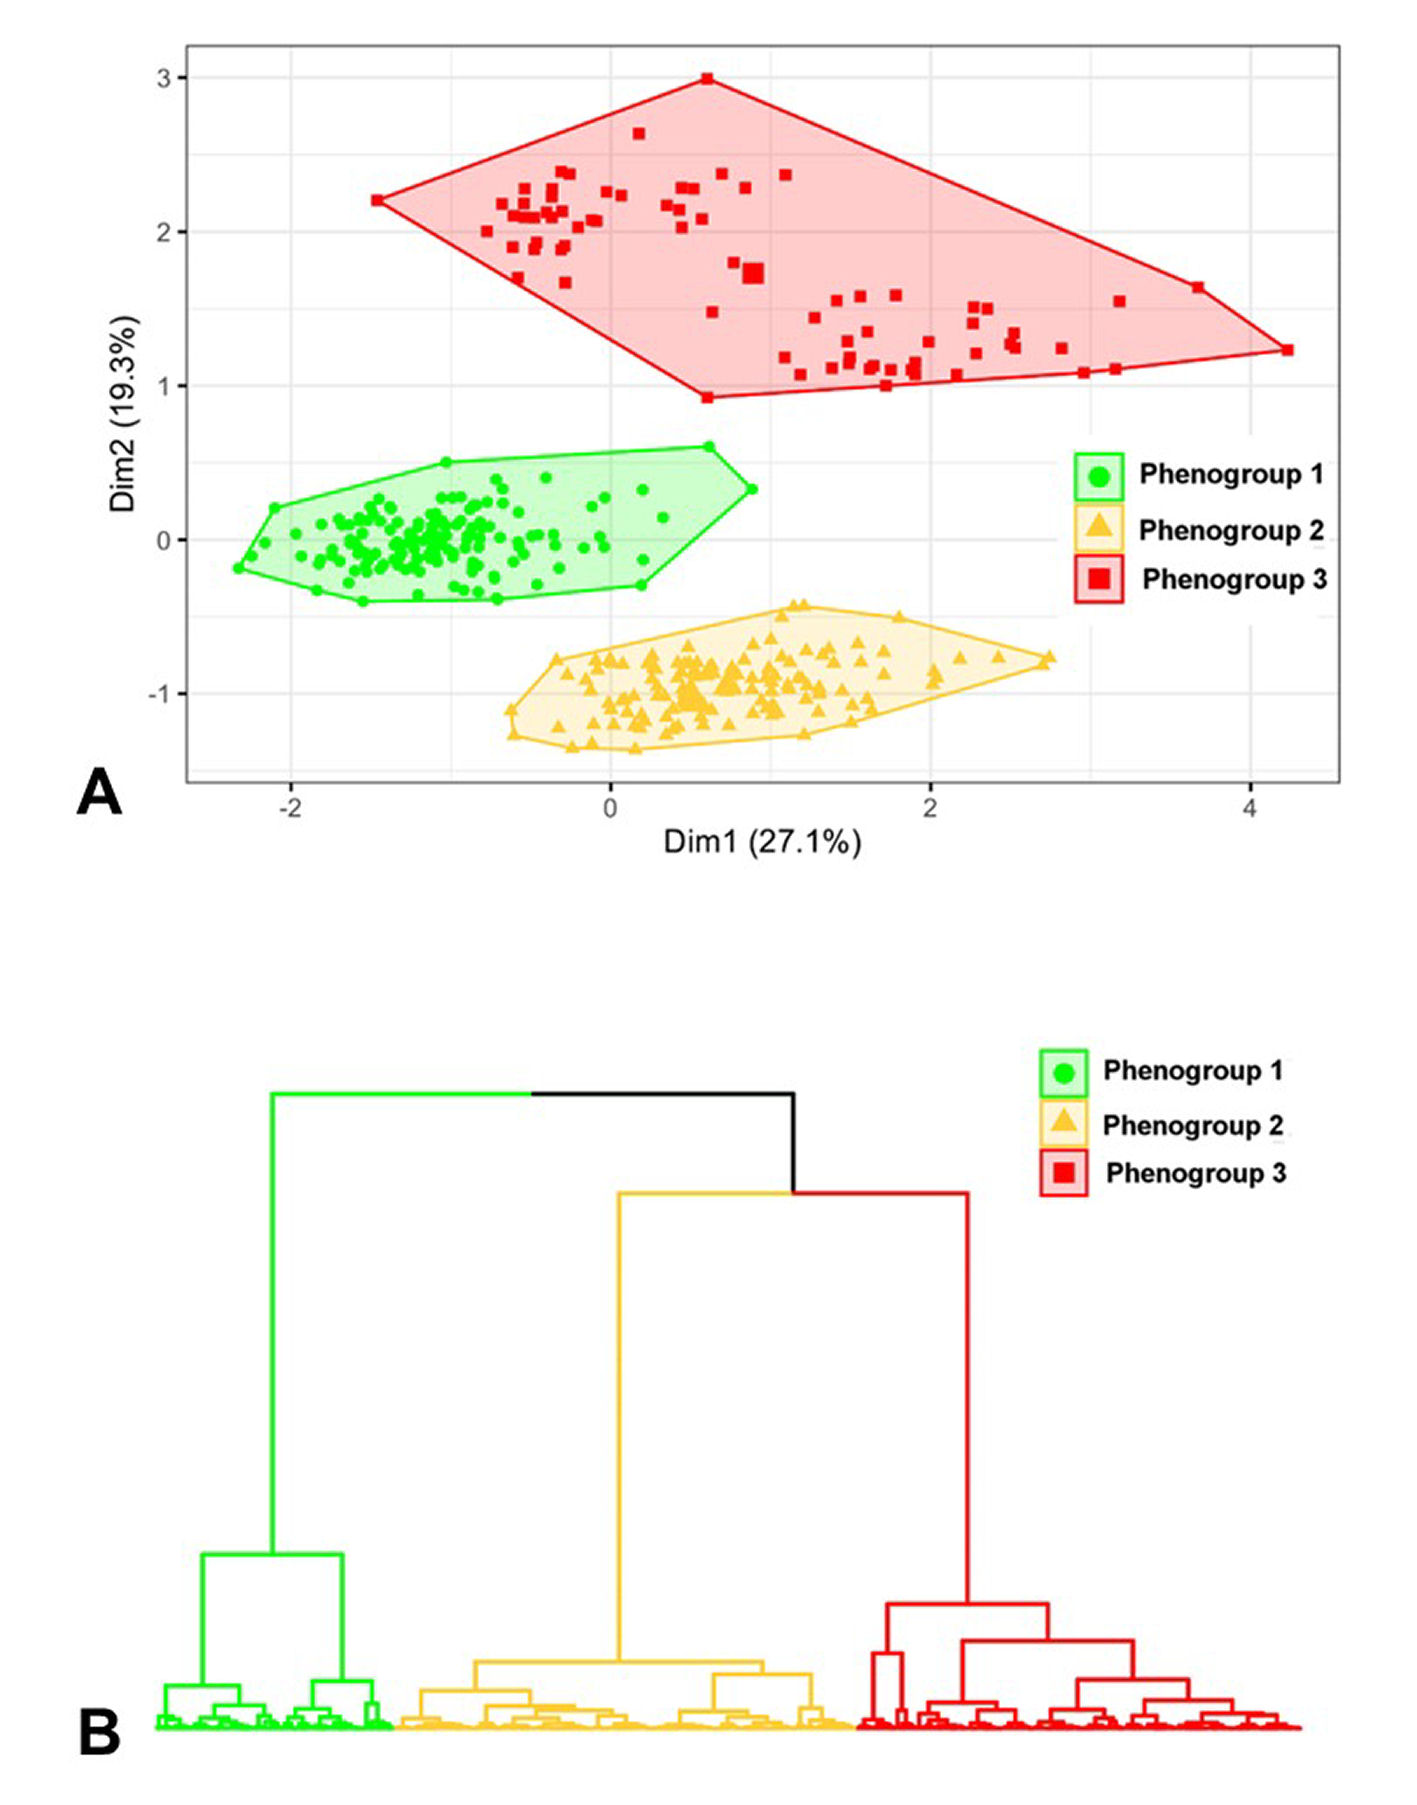
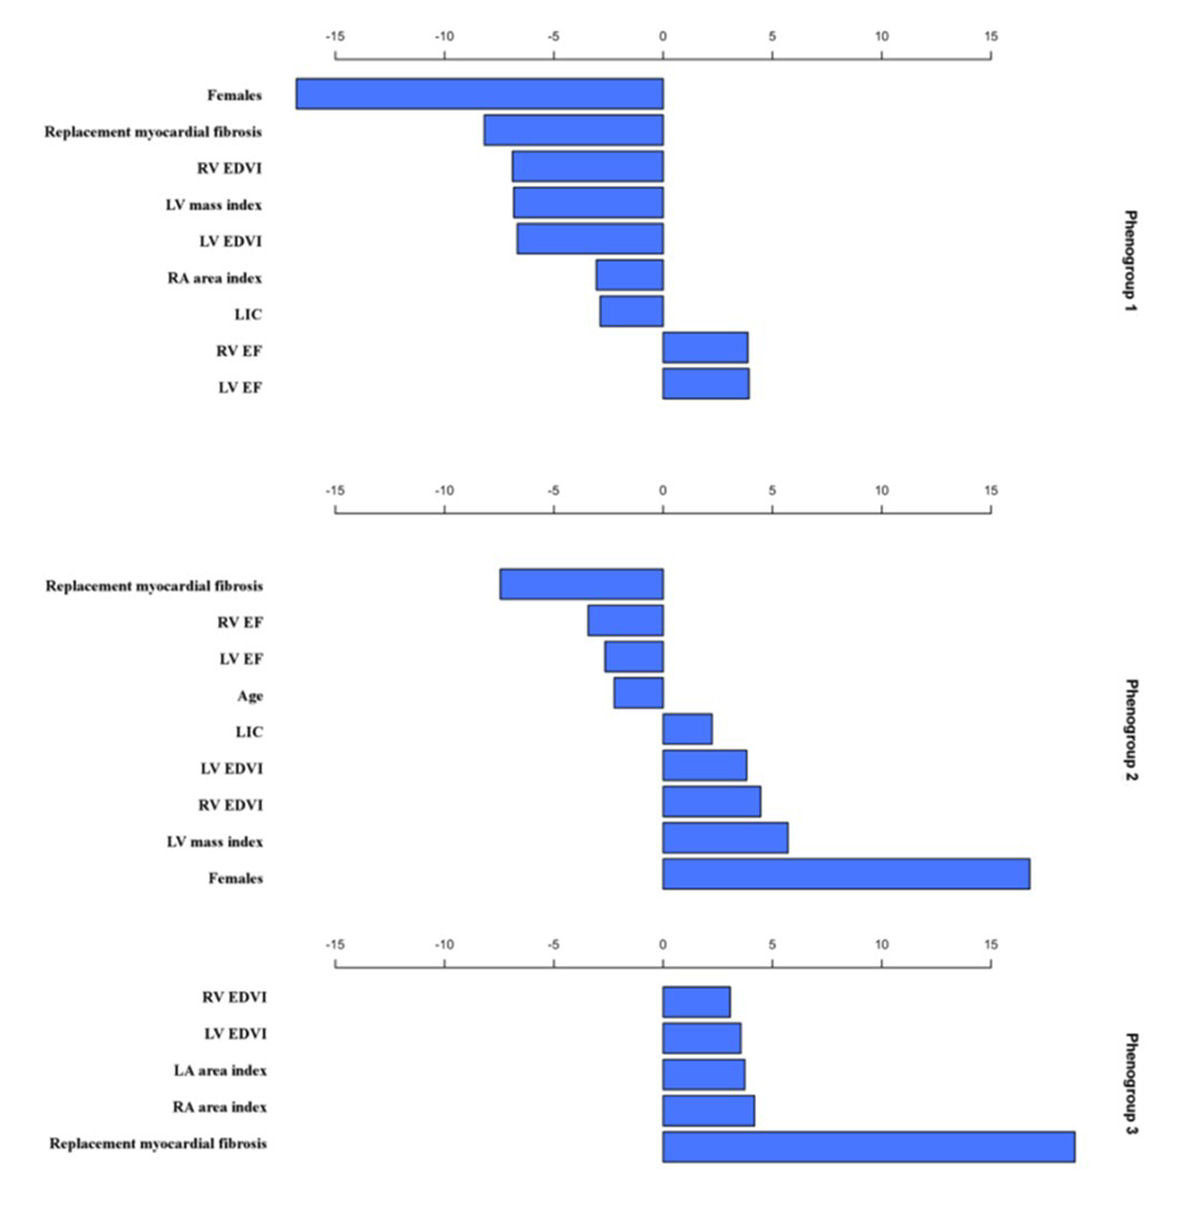
Seven PC (corresponding to 86% of explained variance) were chosen. Table 1 shows the percentage contributions of the variables to the seven dimensions.Three mutually exclusive phenogroups were identified. The three phenogroups are visible upon projection into a two-dimensional correspondence analysis biplot (Figure 1A). The dendrogram representation of the three phenogroups is presented in Figure 1B. Figure 2 shows the most representative clinical variables in each phenogroup.
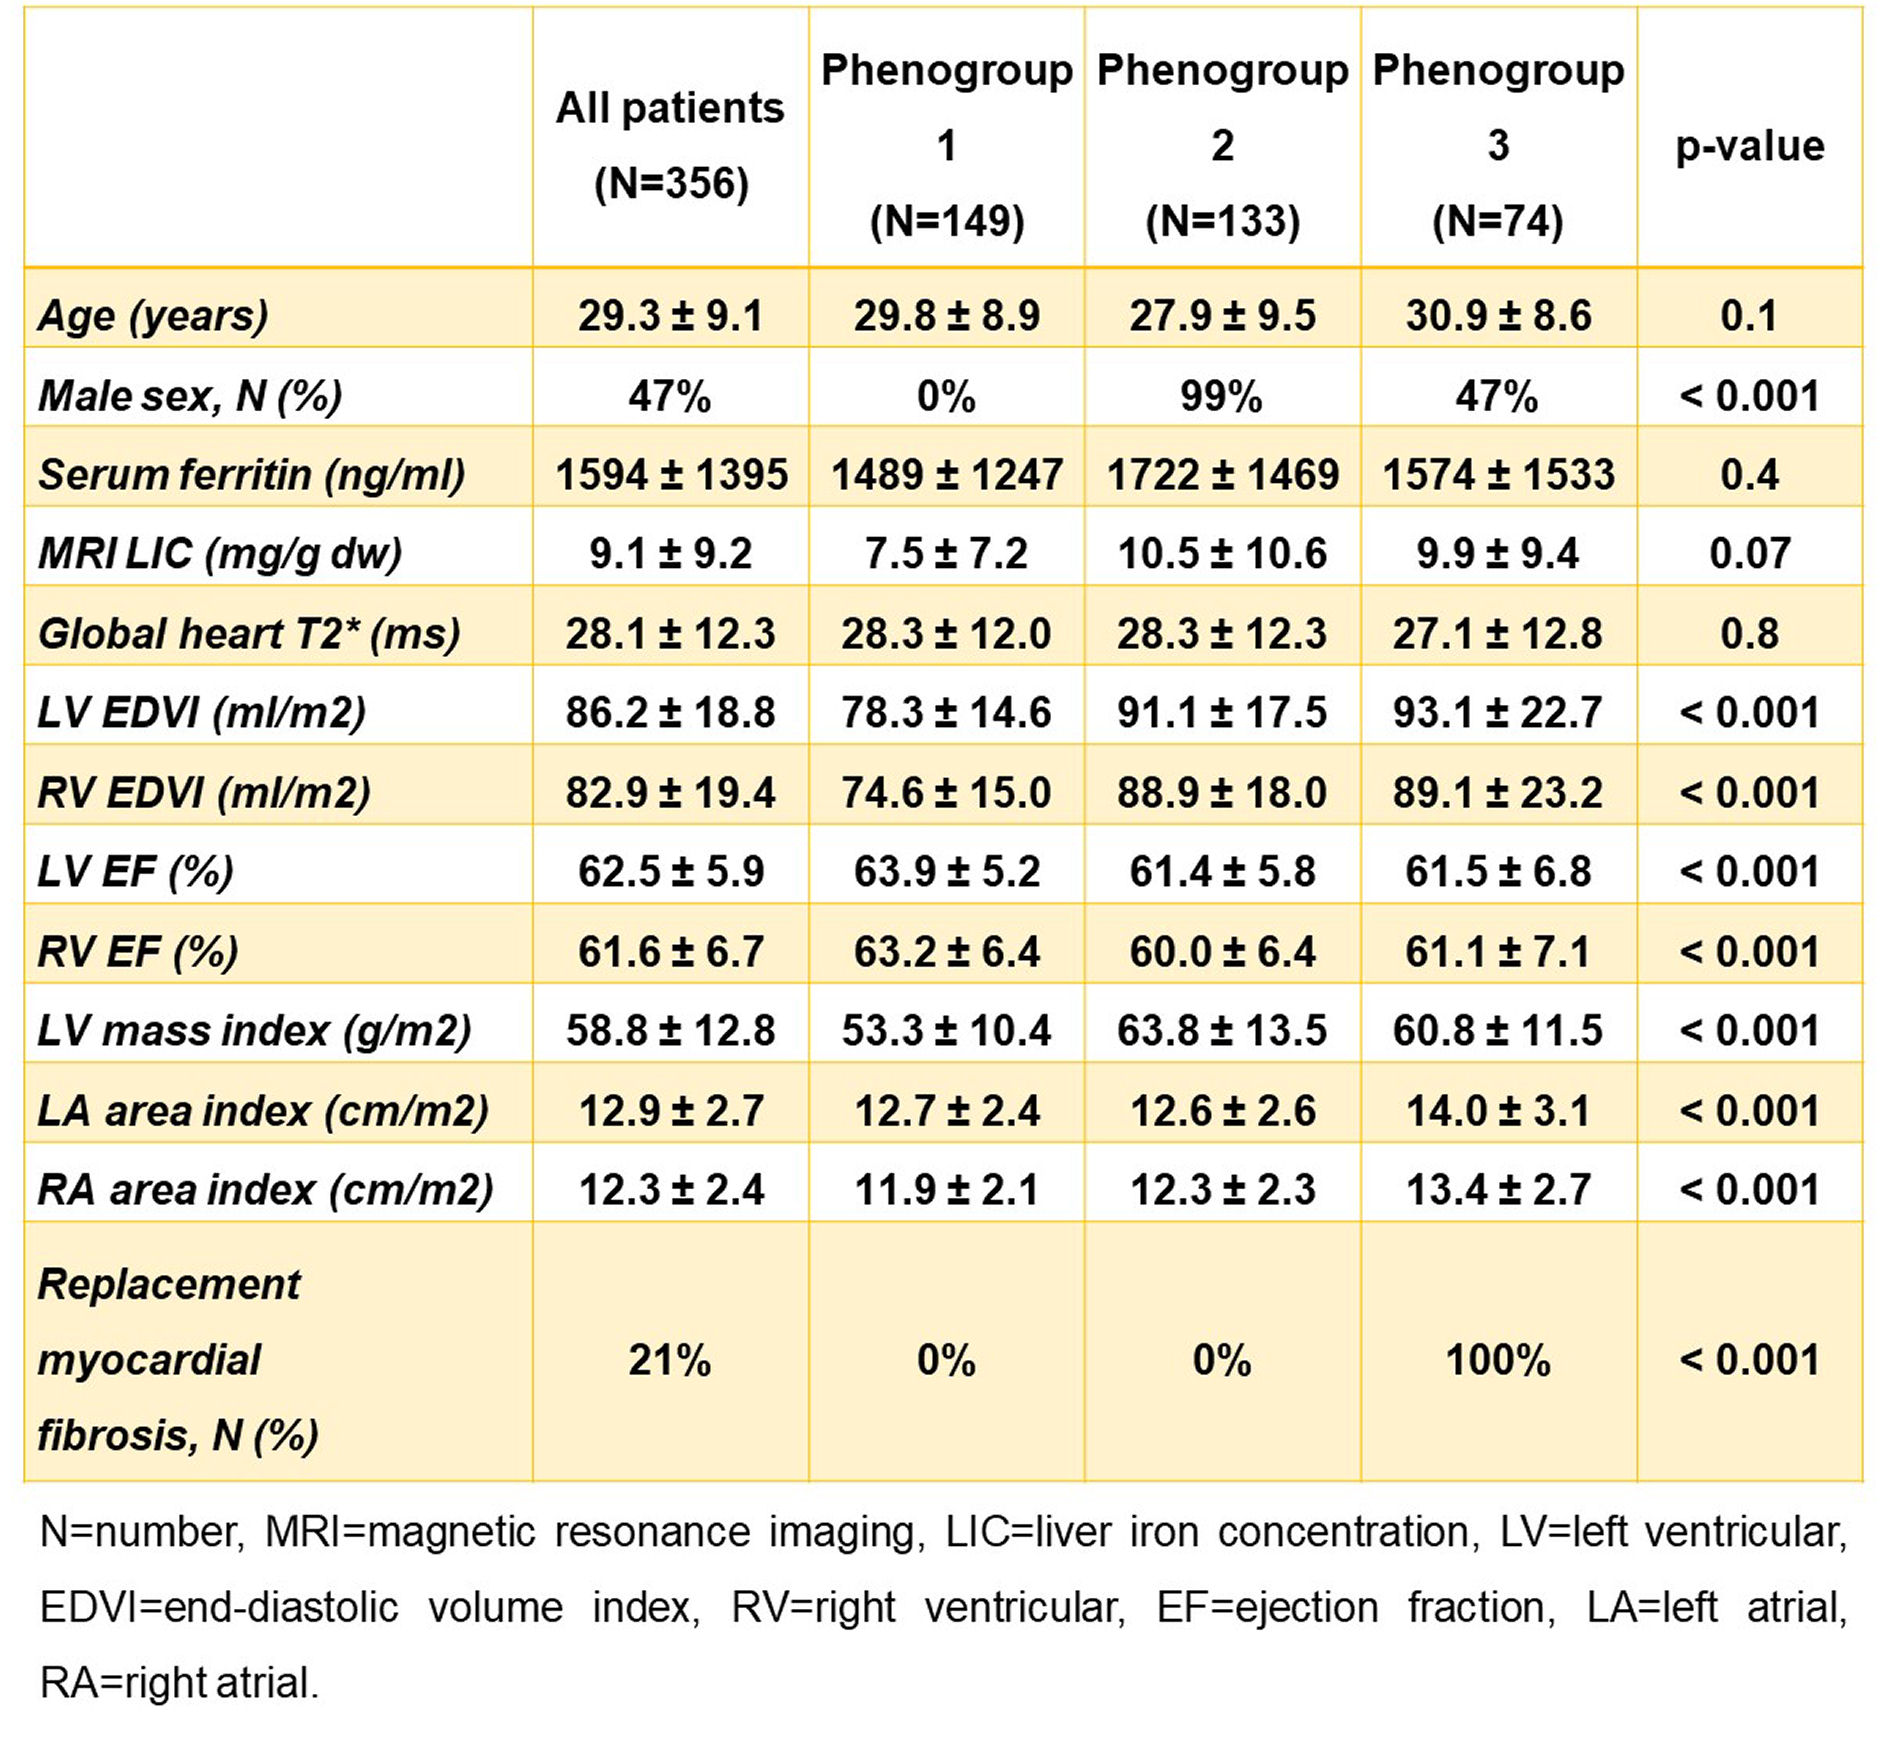
Table 2 shows the differences among the three phenogroups. Phenogroup 1 was constituted exclusively by women. It exhibited significantly lower biventricular end-diastolic volume indexes and LV mass index and significantly higher biventricular ejection fractions compared to both phenogroups 2 and 3 and significantly higher bi-atrial area indexes compared to phenogroup 3. No patient in this group had replacement myocardial fibrosis. Phenogroup 2 was constituted almost exclusively by men and was characterized by the absence of replacement myocardial fibrosis. Phenogroup 3 was well balanced between sexes and included all patients with replacement myocardial fibrosis.
During a mean follow-up time was 57.56±19.58 months, cardiac events were recorded in 29 (8.1%) patients: 13 heart failure, 14 arrhythmias (all supraventricular), and 2 pulmonary hypertension. The prevalence of cardiovascular events was significantly higher in phenogroup 3 than in both phenogroup 1 (21.6% vs. 2.0%; p<0.0001) and phenogroup 2 (21.6% vs. 7.5%; p=0.009). Phenogroup 3 was associated with a significantly increased risk of cardiovascular complications compared to phenogroup 1 (HR=11.95, 95%CI=3.48-41.00; p<0.0001) as well as to phenogroup 2 (HR=2.98, 95%CI=1.35-6.57; p=0.021). In the Kaplan–Meier curve, the log-rank test revealed significant differences in the occurrence of cardiovascular complications across phenogroups (p<0.0001).
Conclusions
In TM, unsupervised clustering integrating routinely measured CMR parameters led to the identification of three phenogroups with distinct clinical and prognostic characteristics. Unsupervised phenogrouping conveys the potential to significantly impact patient care and improve cardiovascular outcomes by enabling early detection of cardiac remodeling and damage, as well as improved risk stratification.Acknowledgements
We would like to thank all the colleagues involved in the MIOT project and all patients for their cooperation.References
1. Pennell DJ, Udelson JE, Arai AE, et al. Cardiovascular function and treatment in beta-thalassemia major: a consensus statement from the American Heart Association. Circulation. 2013;128(3):281-308.
2. Pepe A, Pistoia L, Gamberini MR, et al. National networking in rare diseases and reduction of cardiac burden in thalassemia major. Eur Heart J. 2022;43(26):2482-2492.
3. Mahesh B. Machine learning algorithms-a review. International Journal of Science and Research (IJSR)[Internet]. 2020;9(1):381-386.
4. Pugliese R, Regondi S, Marini R. Machine learning-based approach: global trends, research directions, and regulatory standpoints. Data Science and Management. 2021;4:19-29.
5. Meloni A, Ramazzotti A, Positano V, et al. Evaluation of a web-based network for reproducible T2* MRI assessment of iron overload in thalassemia. Int J Med Inform. 2009;78(8):503-512.
6. Positano V, Salani B, Pepe A, et al. Improved T2* assessment in liver iron overload by magnetic resonance imaging. Magn Reson Imaging. 2009;27(2):188-197.
7. Meloni A, Positano V, Pepe A, et al. Preferential patterns of myocardial iron overload by multislice multiecho T*2 CMR in thalassemia major patients. Magn Reson Med. 2010;64(1):211-219.
8. Meloni A, Righi R, Missere M, et al. Biventricular Reference Values by Body Surface Area, Age, and Gender in a Large Cohort of Well-Treated Thalassemia Major Patients Without Heart Damage Using a Multiparametric CMR Approach. J Magn Reson Imaging. 2021;53(1):61-70.
9. Pepe A, Positano V, Capra M, et al. Myocardial scarring by delayed enhancement cardiovascular magnetic resonance in thalassaemia major. Heart. 2009;95:1688-1693.
Figures