0605
Novel Robust Threshold-Free Probabilistic 3D LGE Fibrosis Signature Technique for Left Atrial Fibrosis Quantification1Radiology, Northwestern University, Chicago, IL, United States, 2Biomedical Engineering, Northwestern university, Chicago, IL, United States, 3Johns Hopkins University, Baltimore, MD, United States, 4Northwestern University, Chicago, IL, United States, 5Electrical and Computer Engineering, Northwestern university, Chicago, IL, United States, 6Computer Science, Northwestern university, Chicago, IL, United States
Synopsis
Keywords: Arrhythmia, Arrhythmia, atrial fibrillation, 3D LGE, fibrosis, signature
Motivation: Left atrial fibrosis assessment from 3D LGE-MRI is pivotal for predicting atrial myopathy and AF recurrence. However, current methods are clinically ineffective and sensitive to data uncertainties such as noise and inter-observer variability of thin LA wall segmentation
Goal(s): Hence, we propose a novel, robust, and standardized probabilistic 3D LGE fibrosis signature technique for quantifying fibrosis burden.
Approach: Our threshold-free signature technique probabilistically encodes multi-billion LGE intensity comparisons from the entire LA volume (not just LA wall).
Results: We evaluated feasibility of our threshold-free method in quantifying LA fibrosis burden, and its stability against Rician noise and interobserver variability of LA volume segmentation.
Impact: Our signature technique as an index of fibrosis burden is highly robust to inherent scan uncertainties including high power Rician noise and inter-observer LA segmentation variability. As a result, our method increases potential clinical utility of 3D LGE MRI
Purpose
Left atrial fibrosis evaluation from cardiac 3D LGE-MRI can prognosticate atrial myopathy in atrial fibrillation (AF) and predicts AF recurrence [1]. However, limitations of existing methods impedes clinical utility of 3D LGE MRI: 1) Lack of standardized fibrosis definition due to different thresholds[2], [3], 2) Sensitivity to data uncertainties a) noise, b) inter-observer variability of thin (~2mm) LA wall segmentation. To address these limitations, we propose a novel threshold-free, robust, and standardized technique for quantifying fibrosis burden by deriving a comprehensive probabilistic signature from 3D LGE data[10]. The signature probabilistically encodes multi-billion LGE intensity co-disparities(comparisons) per patient from the entire LA volume. Our threshold-free technique is evaluated against two widely used threshold-based quantification methods in terms of: 1) feasibility for quantifying LA fibrosis burden, 2) stability and reproducibility in presence of uncertainties a) noise, b) inter-observer variabilities of LA volume segmentations.Methods
Sixty 3D LGE-MRI of pre-ablation AF patients (67±10 yrs; 48% female) were analyzed from a public Utah CARMA database including LA wall and blood pool segmentations [4]. Our proposed probabilistic 3D LGE fibrosis signature technique are summarized and illustrated in Fig. 1, 2:LA boundary localization: The input to our method is roughly localized 3D outer LA boundary from 3D LGE MRI enclosing LA fibrosis.
Co-disparity function: We define a co-disparity function, Ψ, designed to maximize pairwise comparisons between fibrotic and non-fibrotic LEG intensities in ROI (e.g., LA).
Define Pairwise LGE intensity vectors with billions of elements: To facilitate efficient analysis of multi-billion pair-wise co-disparity computation of LGE voxel intensities, we use vectorized-based definitions and analysis, Fig.2 (Eqn.1-4).
Stage I, Compute Uncertainty-Calibrating blood Pool Co-disparity values: Blood pool contains blood without fibrosis resembling scan-specific non-fibrotic LA tissue intensity (Fig. 1). Therefore, we derive blood pool co-disparity values as an auto-calibrator encoding scan-specific data uncertainty (Eqn.7). Stage II, Compute LA signature co-disparity values: To encode the composition of LA fibrosis, LA co-disparity values are computed (Eqn.10). Higher co-disparity values have a higher probability to be fibrosis.
Stage III. Construction of LA signature (SLA), and Calibrating pool signature (SPool). Standardized LA and Pool signature profiles are computed as the unique co-disparity distribution by probability density function (pdf) of normalized and multi-billion co-disparities, respectively (Eqn.9,10).
Stage IV. Compute Fibrosis Signature Index (FSI). For threshold-free standardized fibrosis burden quantification, we introduce a novel FSI index as the probability distribution difference between the LA Signature profile from calibrating pool’s signatur using earth mover’s distance (EMD)[5]. FSI as a standardized and threshold-free index quantifies fibrosis burden per patient (Eqn.16) with higher FSI values indicating a higher fibrosis burden.
Comparison to existing Methods: We assessed the correlation and robustness of our threshold-free FSI to two threshold-based methods:1) Histology-based with >μ+2.3σ threshold (μ and σ are mean and standard deviation of LA pool [6]); 2) EAM-based Image Intensity Ratio, IIR>1.2 [7].
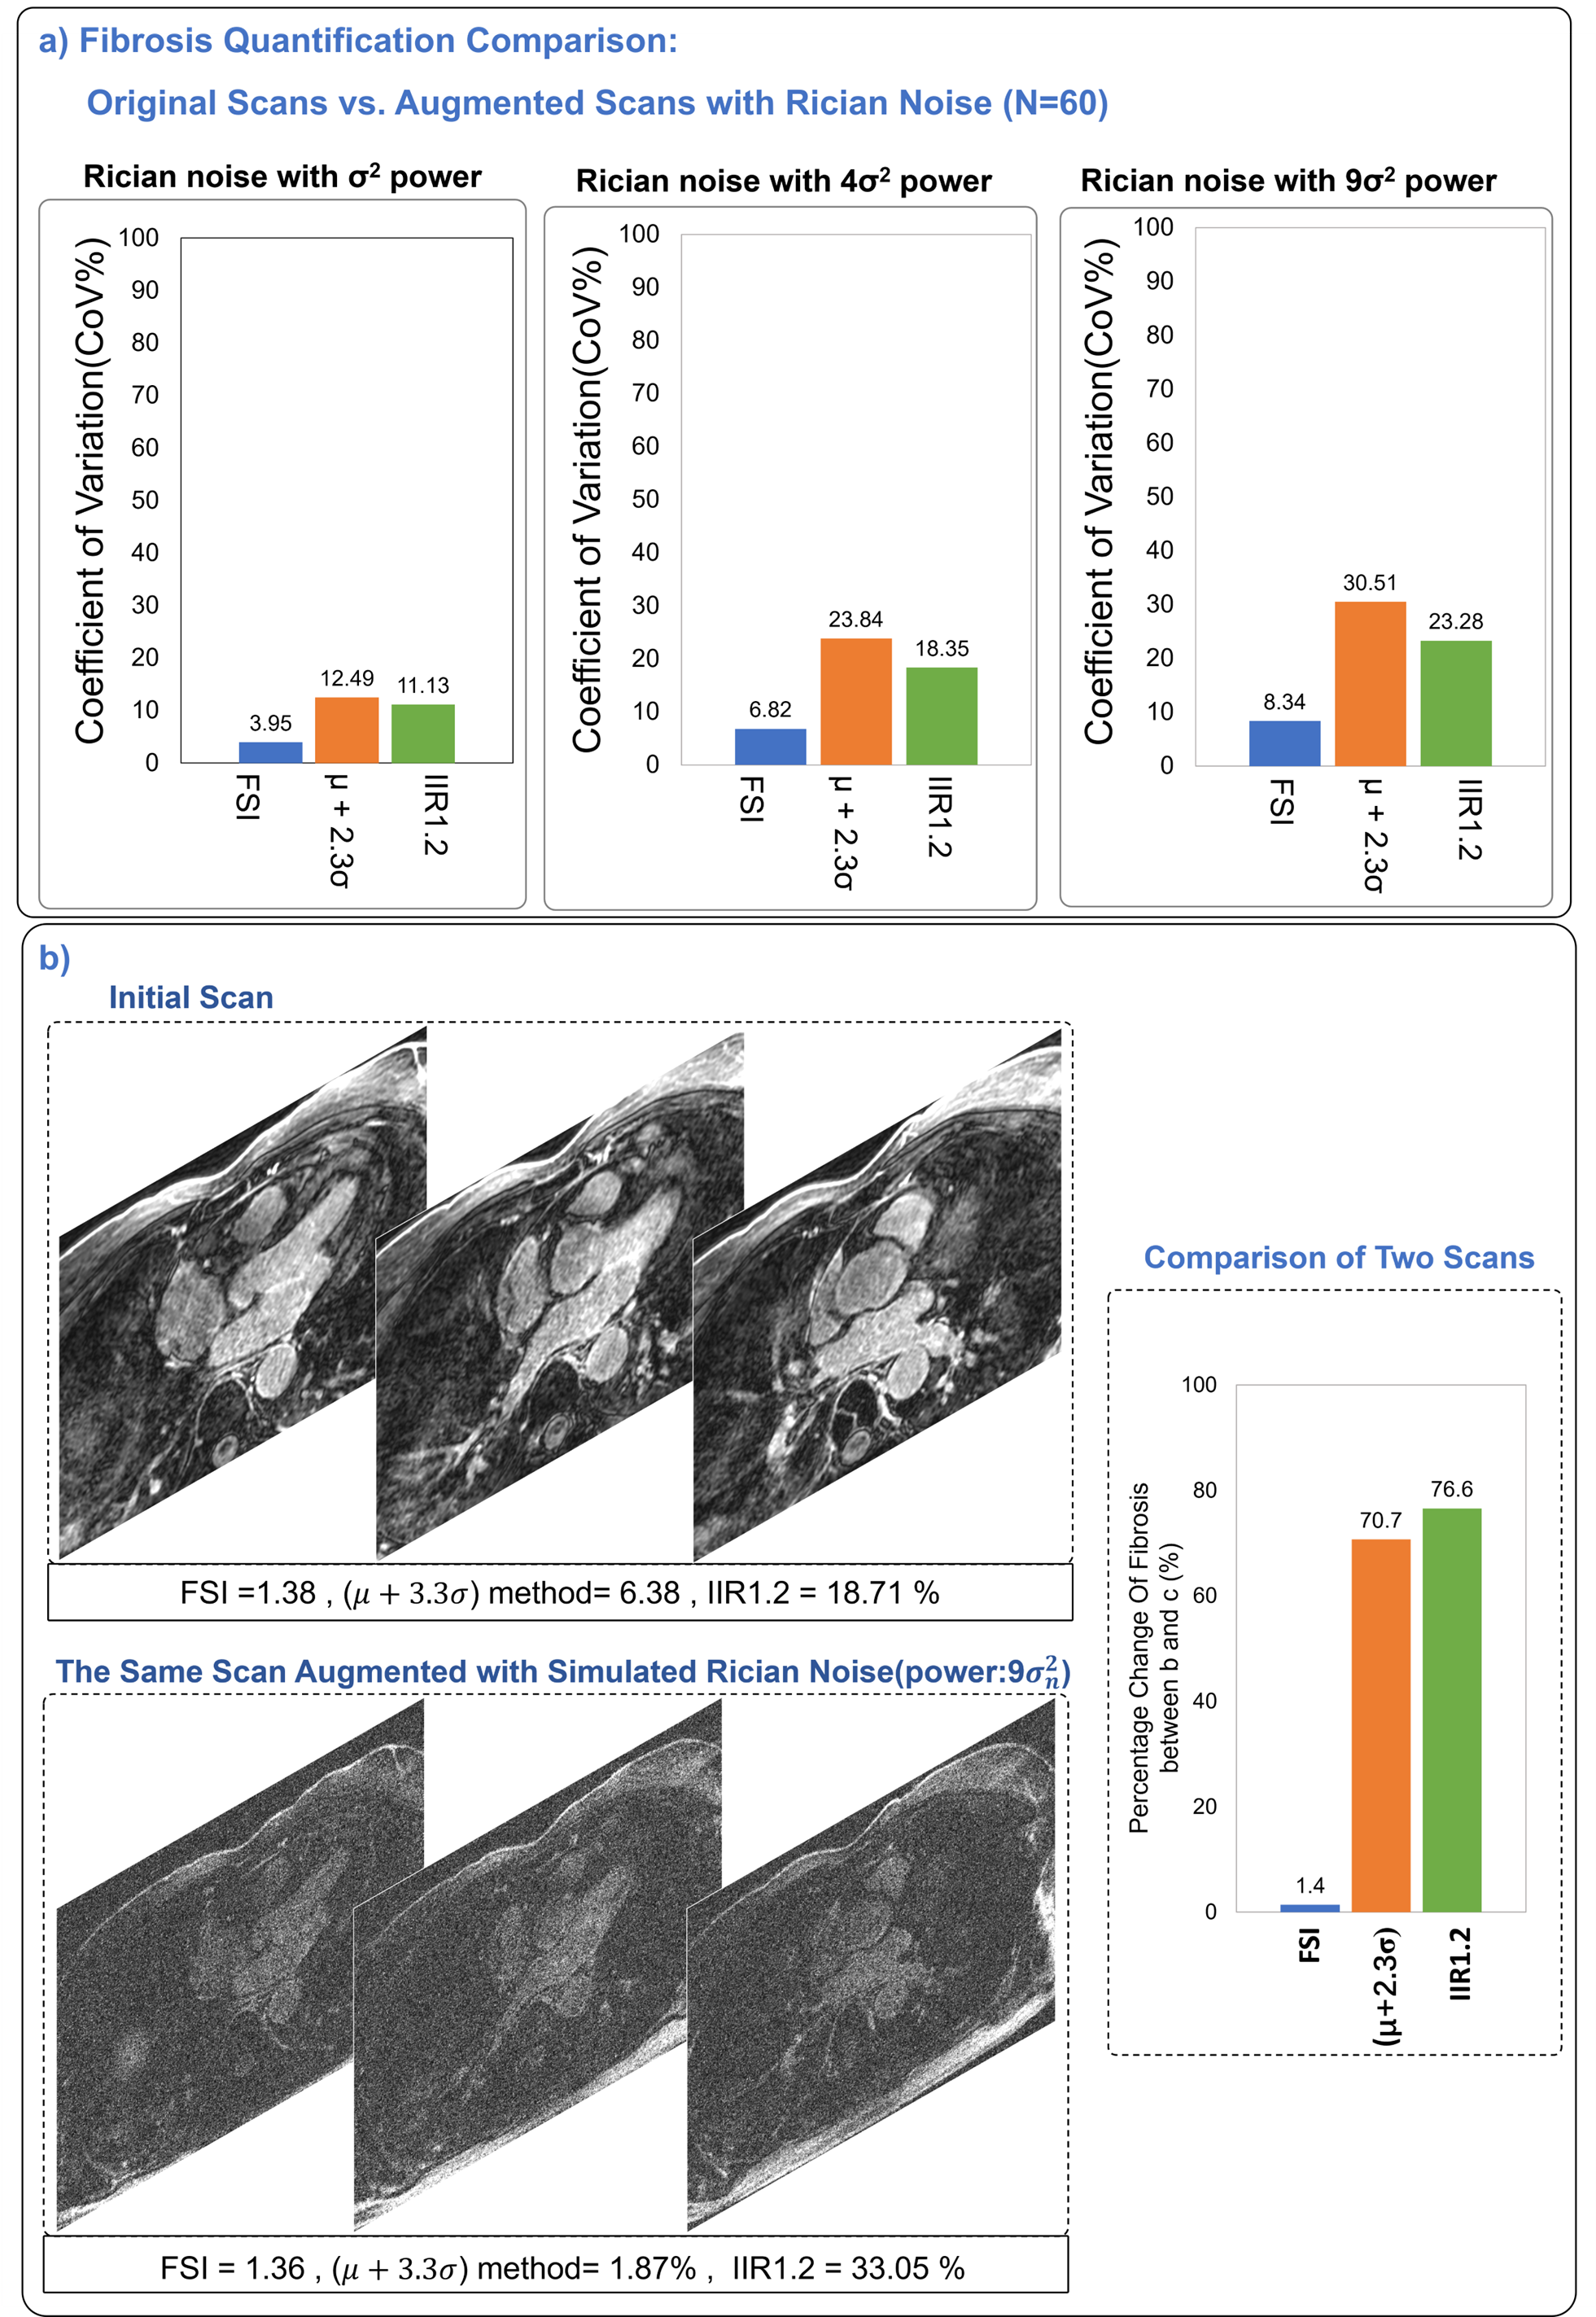
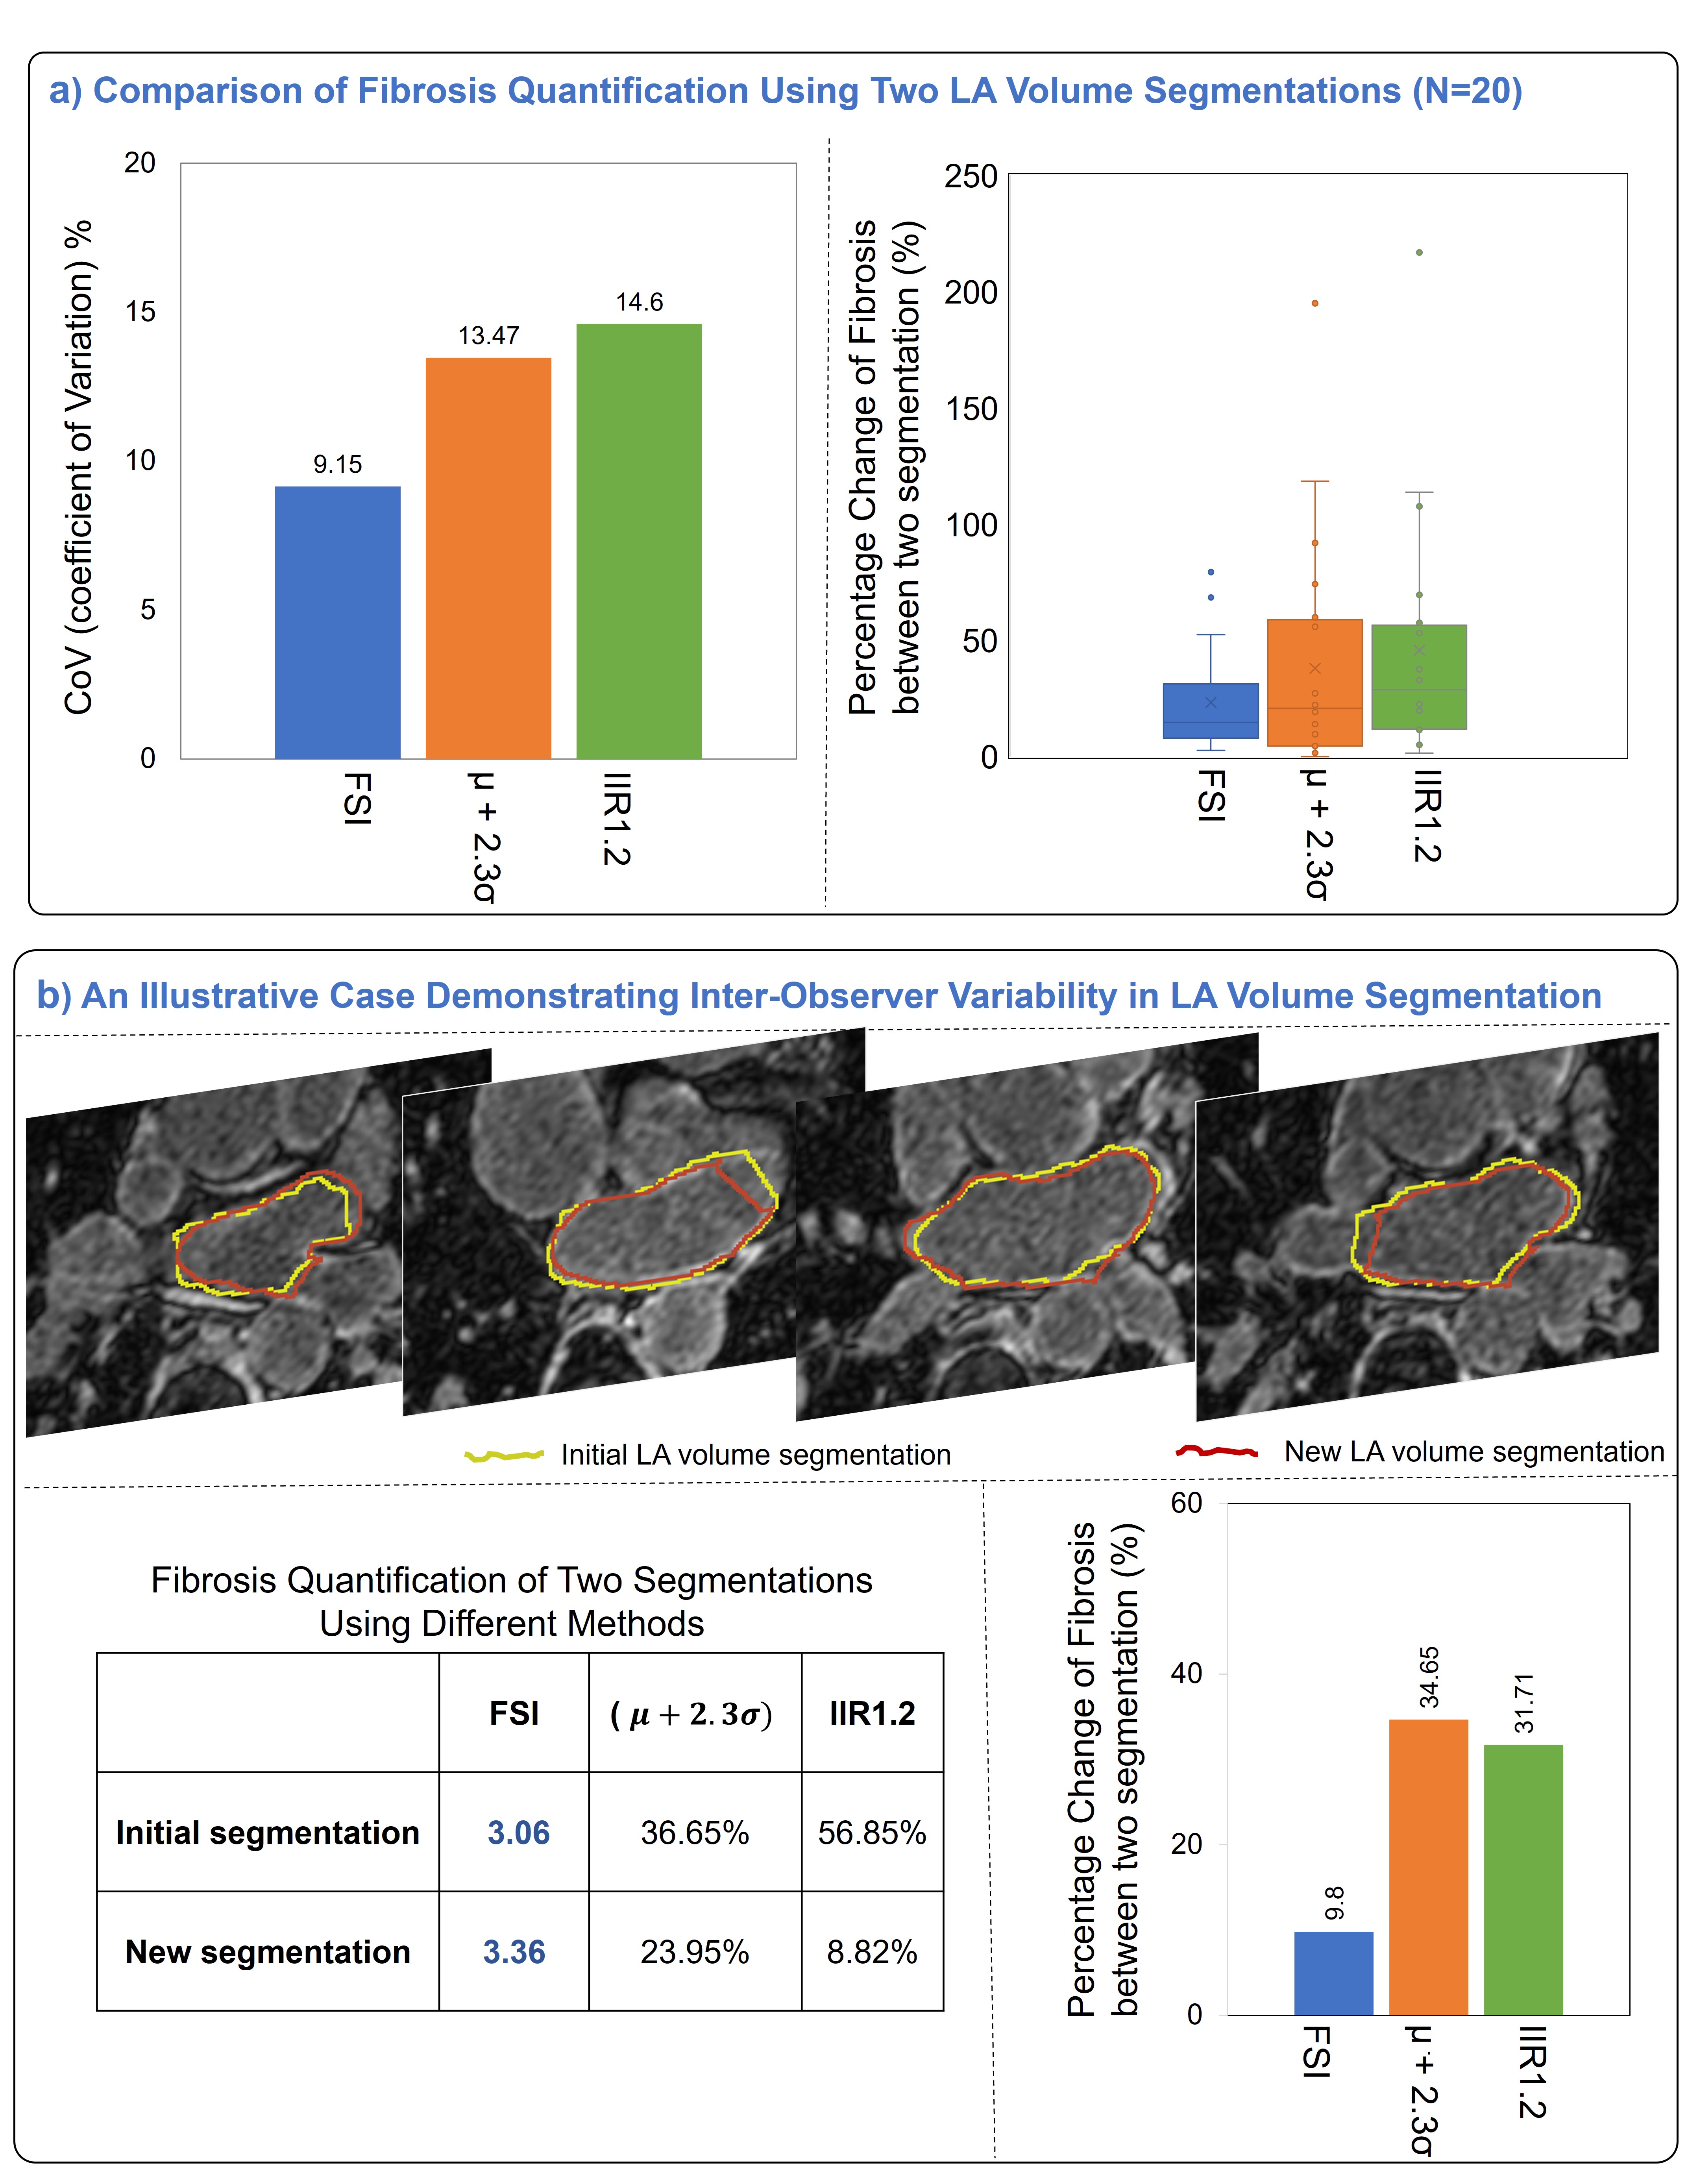
Robustness to data uncertainty: we assessed sensitivity to 1) simulated Rician noise by augmenting 3D LGE images with different Rician noise powers ( [8], 2) inter-observer variability of LA volume segmentation in randomly selected 20 AF patients where LA volumes were segmented by a second observer. Coefficient of variation (CoV) is used for comparisons.
Results
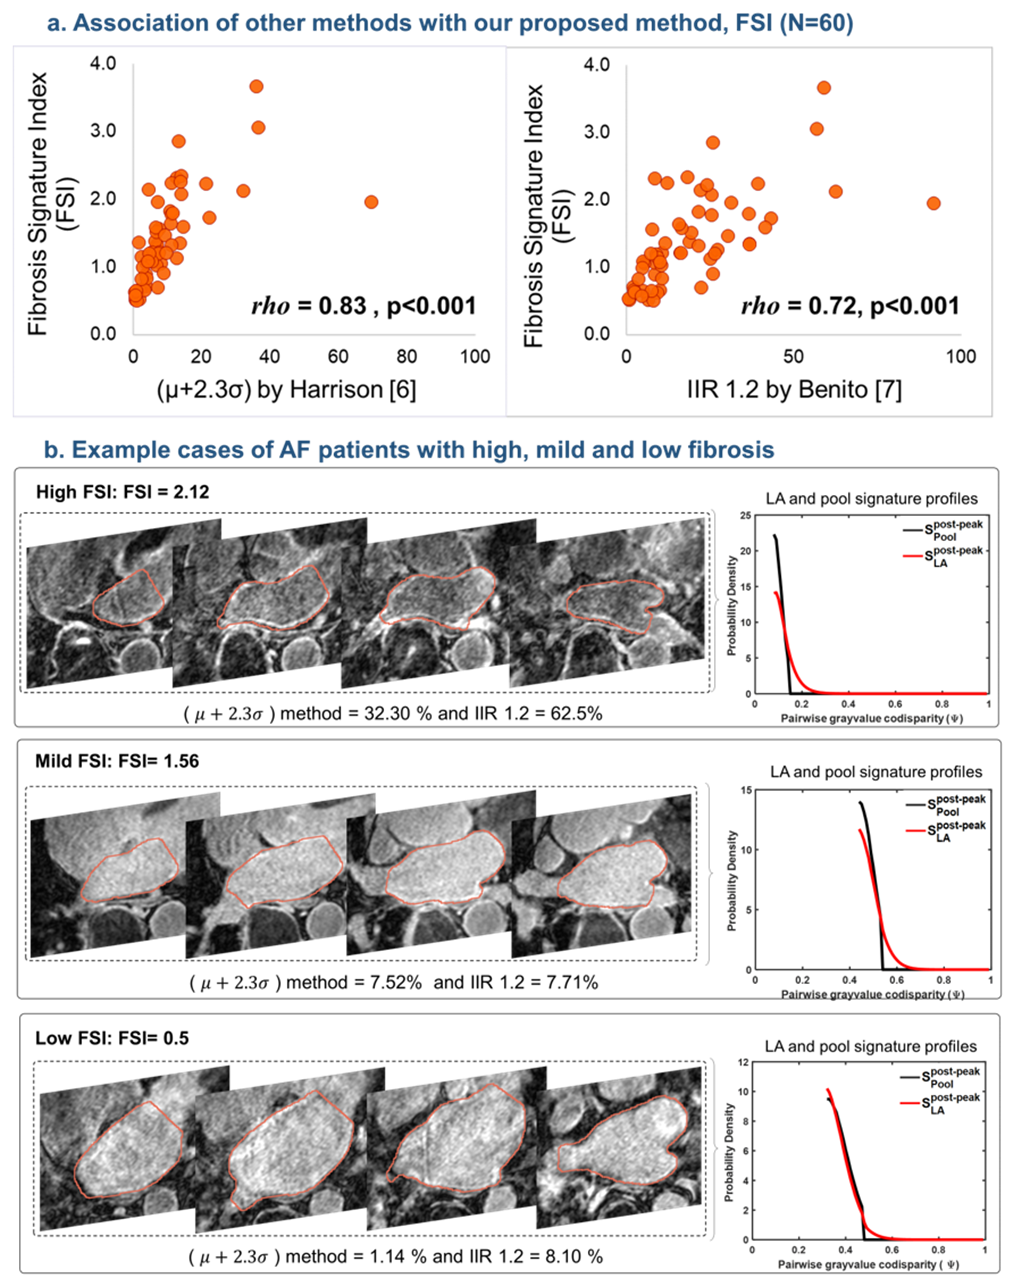
LA fibrosis signature construction was successful in all patients by encoding 9.1±7.1 billion co-disparities per patient. Fig.2-a shows a significant correlation of our threshold-free FSI with fibrosis percentages from threshold-based methods (rhoμ+2.3σ=0.83, rhoIIR1.2=0.72). Example LGE scans with high and low FSI index burden are shown in Fig.2-b. Noise sensitivity analysis showed our FSI index had 3-fold lower variability (CoVFSI = 3.95%) than threshold-base methods (CoVμ+2.3σ=12.49%, CoVIIR1.2=11.13%), see Fig. 4. With regard to inter-observer LA segmentation variability, our FSI showed ~ 40% lower variability (CoVFSI=9.15%) than two threshold-based methods (CoVμ+2.3σ=13.47%, CoVIIR1.2=14.60%), see Fig.5.Discussion and conclusion
This study demonstrated the feasibility of our novel threshold-free self-calibrating probabilistic fibrosis signature technique for quantifying fibrosis burden in AF patients from 3D LGE-MRI. Our novel threshold-free FSI index of fibrosis burden showed a high correlation with existing threshold-based methods confirming its ability to quantify fibrosis. The comprehensive signature definition based on encoding multi-billion co-disparities per patient into a pdf makes FSI intrinsically standardized and inherently normalized to the enclosed LA volume, allowing for standardized FSI comparison among patients. This was demonstrated by the high robustness of our FSI index to inherent 3D LGE data uncertainties with 3-fold higher robustness to increasing Rician noise and ~40% less sensitivity to inter-observer LA segmentation variability than threshold-based methods. These results demonstrate the potential of FSI in facilitating a more robust and standardized quantification of fibrosis burden from 3D LGE warranting further larger studies.Acknowledgements
No acknowledgement found.References
[1] N. F. Marrouche, D. Wilber, G. Hindricks, P. Jais, N. Akoum, F. Marchlinski, E. Kholmovski, N. Burgon, N. Hu, L. Mont, T. Deneke, M. Duytschaever, T. Neumann, M. Mansour, C. Mahnkopf, B. Herweg, E. Daoud, E. Wissner, P. Bansmann, and J. Brachmann, “Association of Atrial Tissue Fibrosis Identified by Delayed Enhancement MRI and Atrial Fibrillation Catheter Ablation: The DECAAF Study,” JAMA, vol. 311, no. 5, p. 498, Feb. 2014.
[2] M. Eichenlaub, B. Mueller-Edenborn, J. Minners, R. M. Figueras i Ventura, B. R. Forcada, A. V. Colomer, M. Hein, P. Ruile, H. Lehrmann, S. Schoechlin, J. Allgeier, M. Bohnen, D. Trenk, F. J. Neumann, T. Arentz, and A. Jadidi, “Comparison of Various Late Gadolinium Enhancement Magnetic Resonance Imaging Methods with High-Definition Voltage and Activation Mapping for Detection of Atrial Cardiomyopathy,” EP Europace, vol. 24, no. 7, pp. 1102–1111, Jul. 2022.
[3] L. H. G. A. Hopman, I. M. Frenaij, J. A. Solís-Lemus, S. El Mathari, S. A. Niederer, C. P. Allaart, and M. J. W. Götte, “Quantification of left atrial appendage fibrosis by cardiac magnetic resonance: an accurate surrogate for left atrial fibrosis in atrial fibrillation patients?,” Europace, vol. 25, no. 5, p. euad084, May 2023.
[4] “http://insight-journal.org/midas/collection/view/190.” . [5] Y. Rubner, C. Tomasi, and L. J. Guibas, “The Earth Mover’s Distance as a Metric for Image Retrieval.”
[6] J. L. Harrison, H. K. Jensen, S. A. Peel, A. Chiribiri, A. K. Grøndal, L. Ø. Bloch, S. F. Pedersen, J. F. Bentzon, C. Kolbitsch, R. Karim, S. E. Williams, N. W. Linton, K. S. Rhode, J. Gill, M. Cooklin, C. A. Rinaldi, M. Wright, W. Y. Kim, T. Schaeffter, R. S. Razavi, and M. D. O’Neill, “Cardiac magnetic resonance and electroanatomical mapping of acute and chronic atrial ablation injury: a histological validation study,” Eur Heart J, vol. 35, no. 22, pp. 1486–1495, Jun. 2014.
[7] E. M. Benito, A. Carlosena-Remirez, E. Guasch, S. Prat-González, R. J. Perea, R. Figueras, R. Borràs, D. Andreu, E. Arbelo, J. M. Tolosana, F. Bisbal, J. Brugada, A. Berruezo, and L. Mont, “Left atrial fibrosis quantification by late gadolinium-enhanced magnetic resonance: a new method to standardize the thresholds for reproducibility,” EP Europace, vol. 19, no. 8, pp. 1272–1279, Aug. 2017.
[8] Y. Han, D. C. Peters, B. Dokhan, and W. J. Manning, “Shorter difference between myocardium and blood optimal inversion time suggests diffuse fibrosis in dilated cardiomyopathy,” J. Magn. Reson. Imaging, vol. 30, no. 5, pp. 967–972, Nov. 2009.
[9] R. A. Horn and C. R. Johnson, Matrix analysis, Second edition, Corrected reprint. New York, NY: Cambridge University Press, 2017.
[10] Mehrnia M, Kholmovski E, Passman R, Katsaggelos A, Nazarian S, Kim D, and Mohammed Elbaz, “Stochastic Fibrosis Signatures from 3D LGE: Novel Threshold-Free quantification of left atrial Fibrosis”, ISMRM 2022.
Figures
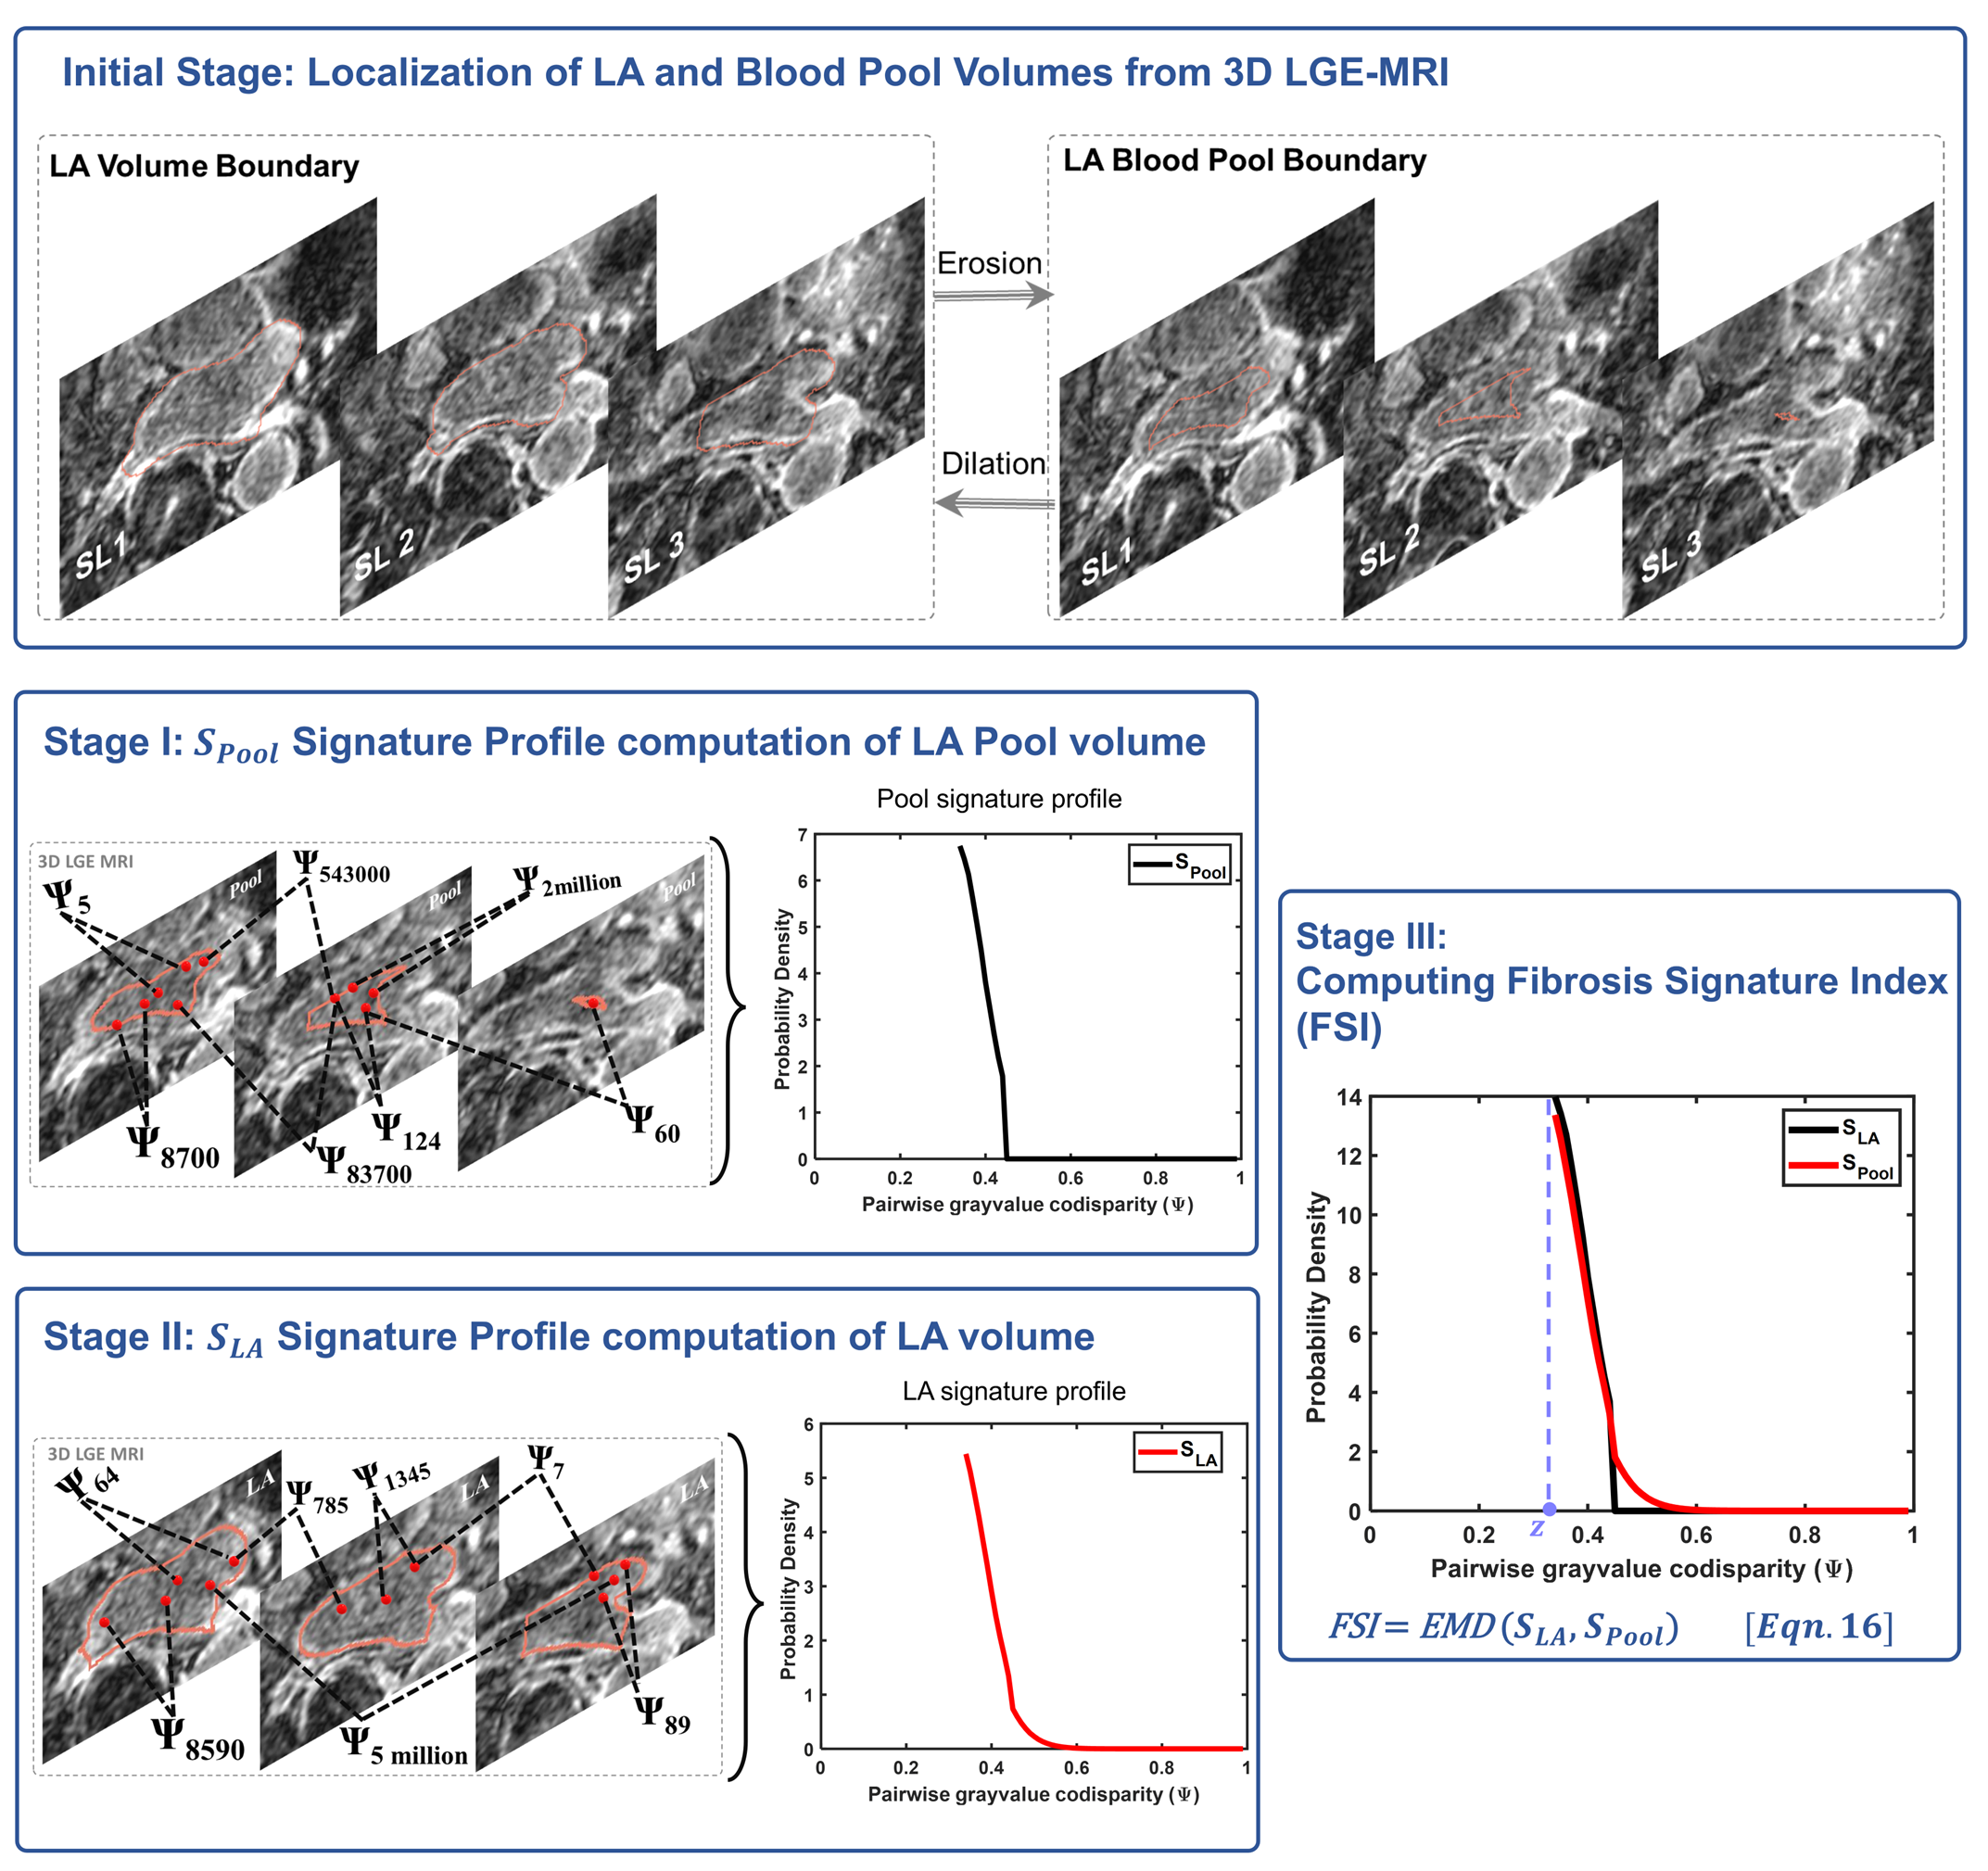
Figure 1. Illustration of our proposed method, FSI: Stage I calibrates the method to scan-specific uncertainties (e.g., noise or intensity inhomogeneity) using LA blood pool signature, SPool. Here pool is defined by automated erosion of the localized LA boundary. Stage II computes a unique profile of comparisons of LGE-MRI intensities throughout the LA volume (not LA wall only), LA signature profile, SLA. Stage III computes fibrosis signature index (FSI) based on distribution distance of LA signature from its calibrator, Pool signature from Stages I and II.