0599
Sensitivity of quantitative MRI to demyelination and axonal loss: validation against myelinated and unmyelinated axons from histology1Bernard and Irene Schwartz Center for Biomedical Imaging, Department of Radiology, New York University Grossman School of Medicine, New York, NY, United States, 2Center for Advanced Imaging Innovation and Research, New York University Grossman School of Medicine, New York, NY, United States
Synopsis
Keywords: Microstructure, White Matter, Standard Modeling, Axon, Myelin, Unmyelinated axons, Diffusion, Validation, Axon loss, Segmentation, Electron microscopy
Motivation: Attaining microstructural specificity to myelinated/unmyelinated axons from macroscopic in vivo quantitative MRI.
Goal(s): Quantifying changes of myelinated and unmyelinated axons using dMRI.
Approach: We apply compartmental diffusion models of white matter, White Matter Tract Integrity (WMTI) and Standard Model Imaging (SMI) to the dMRI signal. We also measure Magnetic Transfer Resonance and R2. We develop automated techniques to segment 2d transmission electron microscopy (TEM) images of white matter into their constituent microstructure and apply volumetric analysis.
Results: We measured axonal water fraction (AWF) using WMTI and SMI. AWF correlated strongly with our EM volumetric analysis of myelinated and unmyelinated axons.
Impact: Demyelination and axonal loss occur in neurodegenerative pathologies. This validation study reveals specificity of R2 to myelin volume, while AWF from dMRI detects both unmyelinated and unmyelinated axons. Combining both modalities has the potential to differentiate demyelination from axonal loss.
INTRODUCTION
Demyelination followed by axonal loss occurs in neurodegenerative pathologies1-3. The axonal water fraction (AWF) is a potential marker of axonal loss that can be quantified using diffusion MRI (dMRI) beyond diffusion tensor imaging and biophysical modeling. Assuming axons are impermeable to water diffusion at the time scale of the dMRI measurement allows us to model them as “sticks” with effectively zero radius4-6. We evaluate here whether this assumption holds for unmyelinated axons, which become more prevalent in demyelination preceding axonal loss. In addition, we measure the specificity of magnetic transfer resonance (MTR) and R2 to changes in myelin, unmyelinated, and total axon volume in vivo in the cuprizone mouse model. We validate our findings using high-resolution transmission electron microscopy (TEM), where for the segmentation and volumetry of all axons, we developed novel neural networks (NN) based techniques.METHODS
Animal model: An 18-week longitudinal study included 36 female C57BL/6 mice, all 8 weeks old at baseline. Mice were separated into three diet groups of 12: the Ctl group received standard chow; Cpz6 and Cpz12 groups received cuprizone-supplemented chow for 6 and 12 weeks, respectively, followed by 6 weeks of recovery on standard chow.In vivo MRI was performed at baseline, 6, 12, and 18 weeks. Diffusion MRI data was acquired along with T2 and MTR. One 0.8-mm thick mid-sagittal slice was imaged with 112-μm in-plane resolution with b-values of 1000 and 2000 s/mm2 and 30 directions each, in addition to 6 b = 0 images (TR=800 ms; TE=49 ms; echo train length=4; Δ=16ms; δ=2 ms). T2-weighted images were acquired using a multi-echo spin-echo sequence with eight echoes and echo-time increment=7.1 ms (TR=2 s; NA=2). For MTR, two FLASH images (TR=47 ms; TE=5.5 ms; flip angle=8°; NA=40) were acquired with and without MT saturation pulse (Gaussian shape; frequency offset = 1.5 kHz; duration = 12 ms; peak power = 4.7 μT).
Histopathological analyses were performed on subsets of animals from each diet group at 6-, 12-, and 18-weeks using TEM: 708 from the splenium and 709 from the genu of the corpus callosum with a field of view of approximately 6 × 9 μm2 at 2.36 nm2 spatial resolution.
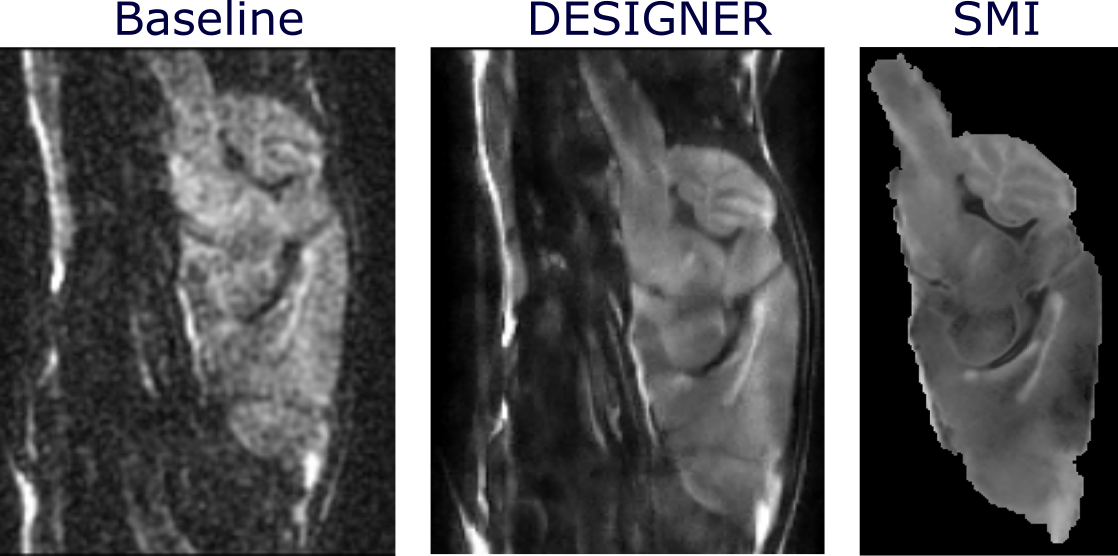
dMRI processing of enhancing the estimated WMTI and SMI maps included the DESIGNER pipeline7.
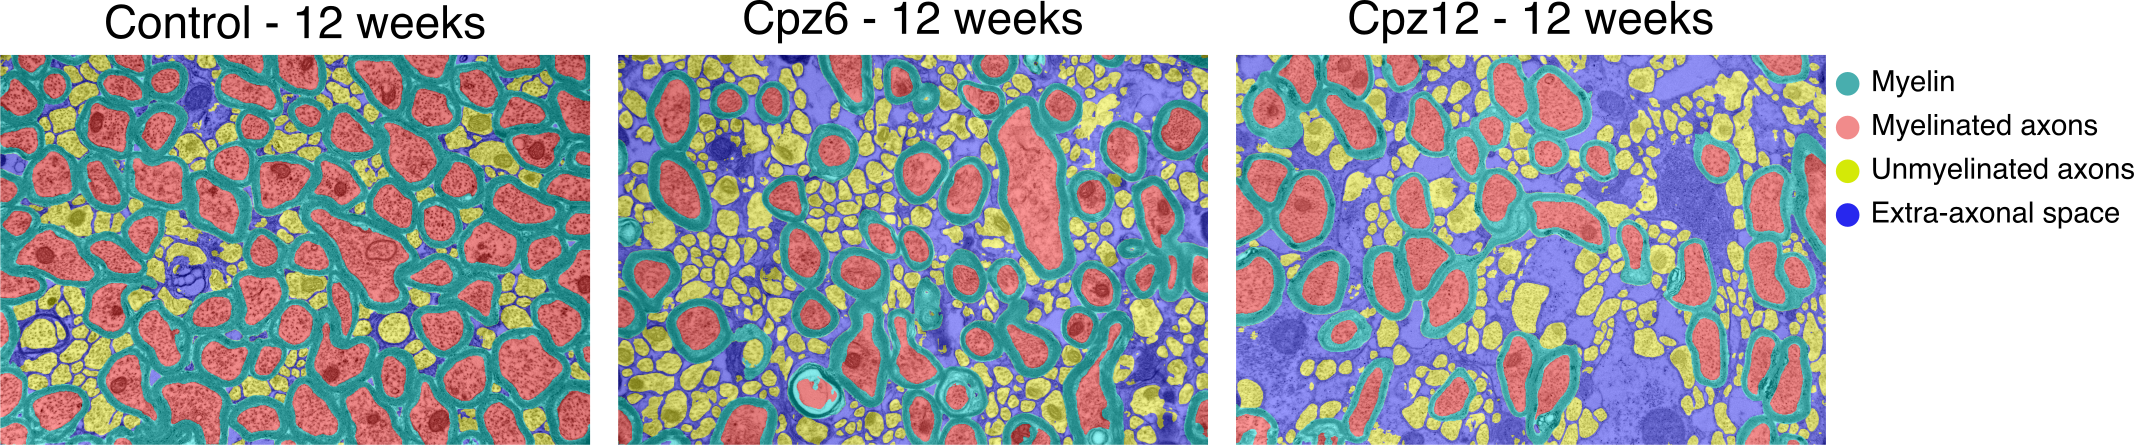
EM segmentation was accomplished by applying a DeepACSON-based technique8. We trained a UNet on a small training set, by sequentially enhancing the performance of the NN by giving feedbacks as manual corrections to the network predictions. We also augmented the training set using randomized histogram distortions to become invariant against varying contrast and brightness gradients. In addition, half of the training set underwent image warping consisting of affine and random perspective transformations.
RESULTS
The DESIGNER pipeline denoised the diffusion-weighted images, removed the Gibbs-ringing, and corrected motion artifacts (Fig.1).We trained NNs for semantic segmentation of myelin, myelinated and unmyelinated axons, and extra-axonal spaces (Fig. 2) in all EM images. This enabled us to automatically differentiate between myelinated and unmyelinated axons for the first time, measure their volume individually, and track their changes.
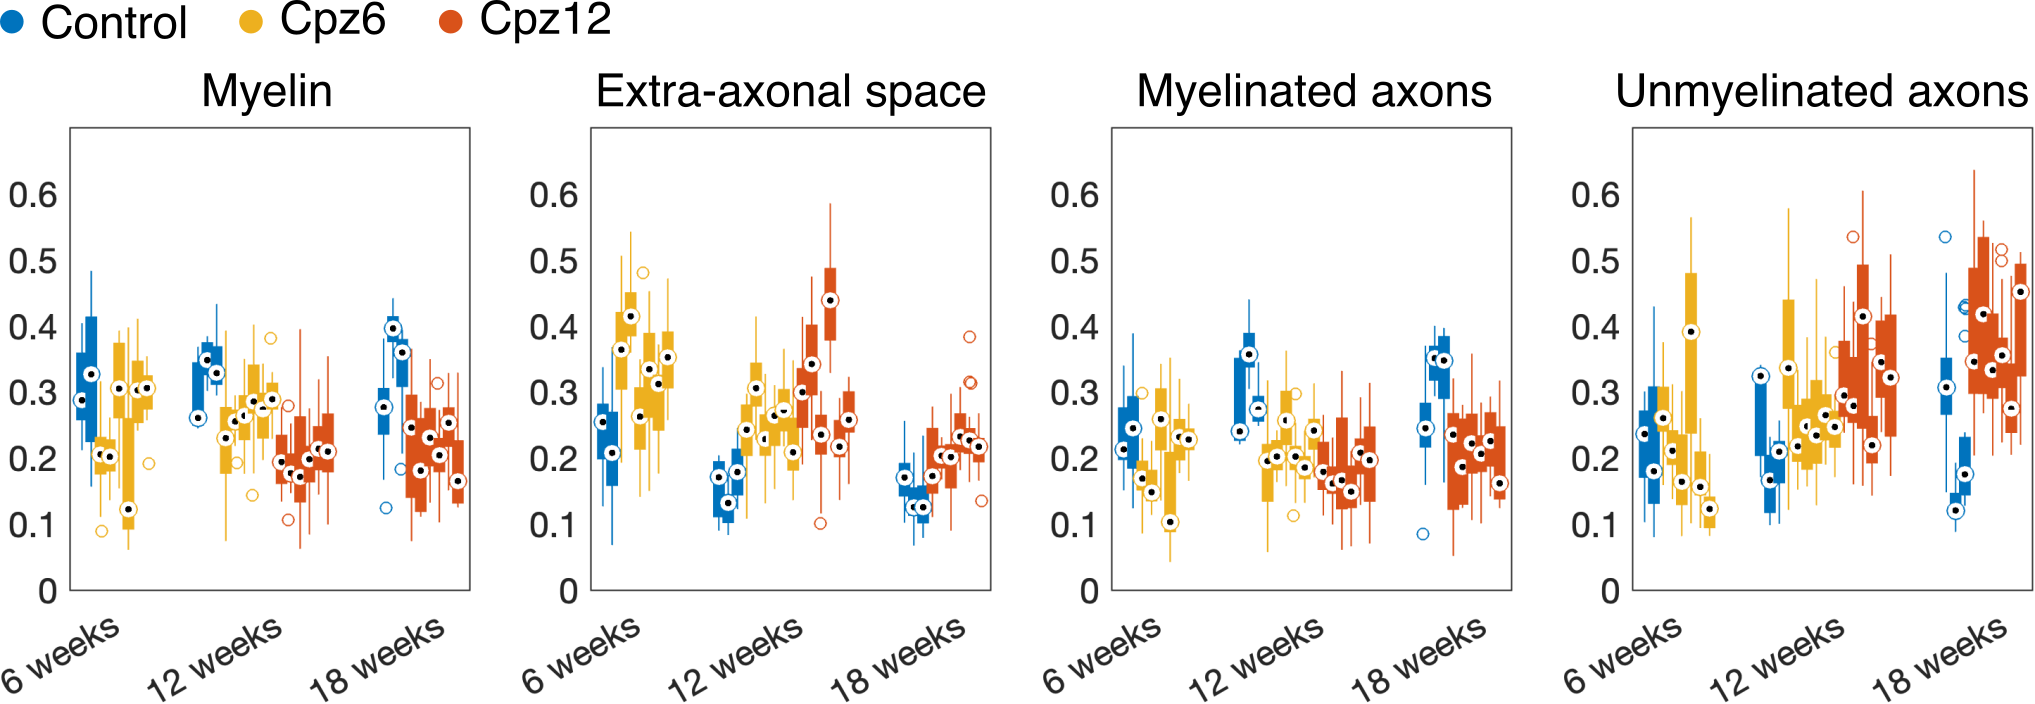
Results of quantitative analysis of EM images in splenium are shown in Fig.3: myelin content decreases after 6 and 12 weeks of cuprizone. Extra-axonal space increases after 6 and 12 weeks of cuprizone. Intra-axonal space of myelinated axons decreased after 6 weeks of cuprizone and then remained unchanged after 12 weeks of cuprizone. Intra-axonal space of unmyelinated axons decreases after 6 weeks of cuprizone and then remained unchanged after 12 weeks of cuprizone.
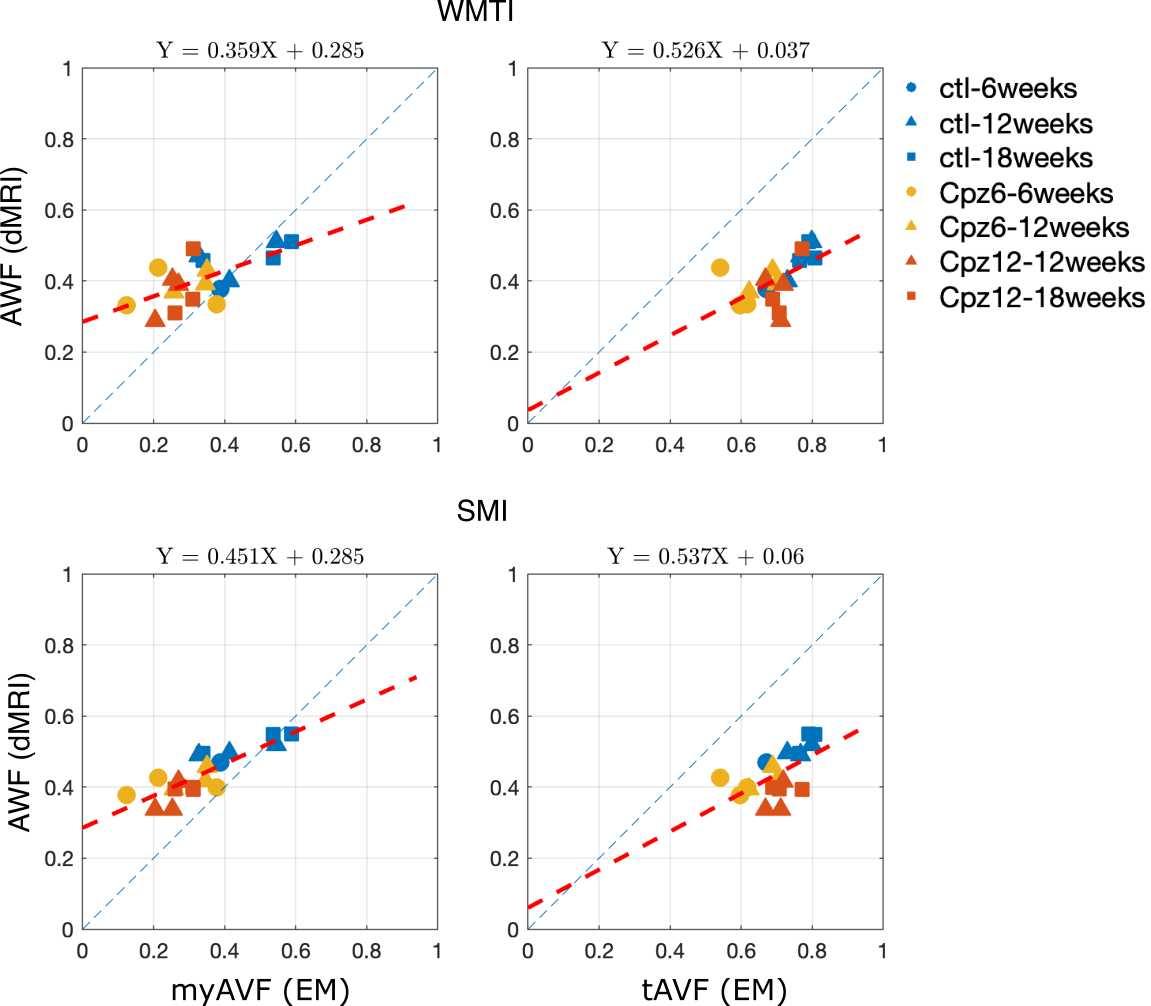
Remarkably, in Fig.4, we show that AWF measured by dMRI and tAVF (total axonal volume fraction) measured from EM correlated very strongly and their relationship was well fit by a linear model with negligible intercept, both for WMTI and SMI. The slope, however, was not unity, indicative of a scaling effect between the two modalities. It is also shown that the AWF is sensitive to both myelinated and unmyelinated axons, as the non-zero intercepts imply when only using the volume fraction of myelinated axons (myAVF).
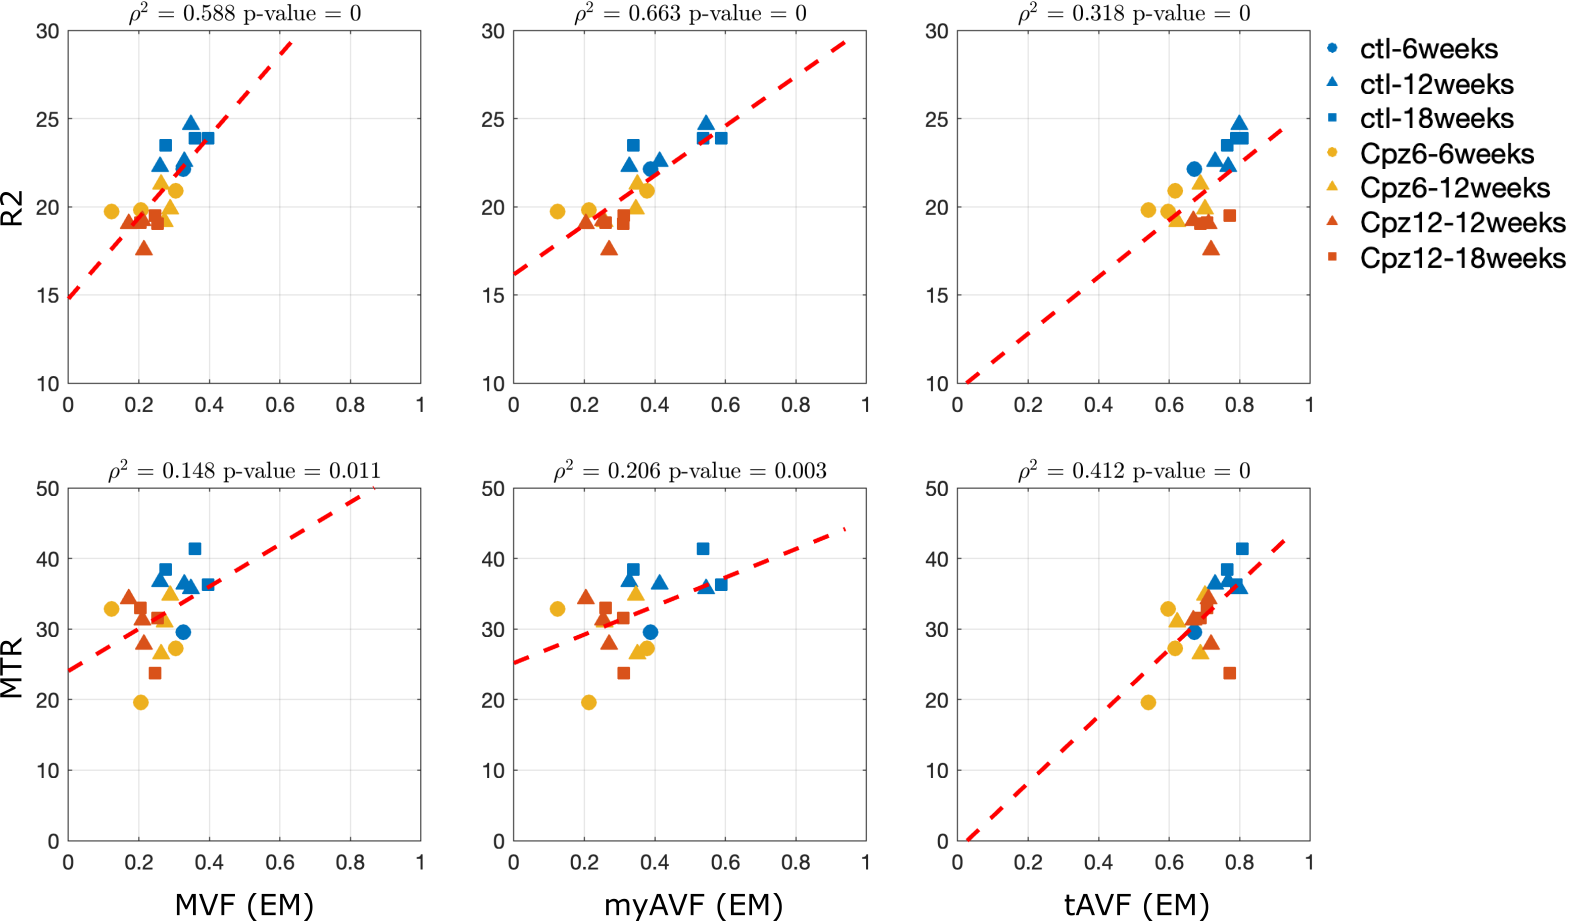
In Fig.5, we measure the correlation between MVF (myelin volume fraction), myAVF, and tAVF against MTR and R2 measures. All our comparisons show significant correlations. MTR shows the highest correlation with tAVF, sensitive to both myelinated and unmyelinated axons. R2 shows the highest correlation to myAVF and also similarly to MVF, a good measure for myelin integrity.
CONCLUSION
This validation study reveals the specificity of R2 to myelin volume, while AWF from dMRI detects both unmyelinated and unmyelinated axons. Combining both modalities has the potential to differentiate demyelination from axonal loss.Acknowledgements
This research was supported by the NIH under awards R01 NS088040 and R21NS081230, and was performed under the rubric of the Center for Advanced Imaging Innovation and Research (CAI2R, www.cai2r.net), an NIBIB National Center for Biomedical Imaging and Bioengineering (NIH P41 EB017183).References
[1] Brun A et al., Ann. Neurol. 19 (1986); [2] Grossman RI et al., Neuroradiol. 19 (1998); [3] Kinnunen KM et al., Brain 134 (2011); [4] Fieremans E et al, NeuroImage 58; [5] Jelescu IO et al., NeuroImage 132 (2016); [6] Coelho S et al., Neuroimage 257 (2022); [7] Ades-Aron B et al., Neuroimage 183 (2018). [8] Abdollahzadeh A et al., Comm. Bio. 4 (2021).Figures