0596
High-Resolution MR Microscopy of Mouse Spinal Cord at 15.2 T1Department of Physics, Vanderbilt University, Nashville, TN, United States, 2Vanderbilt University Institute of Imaging Science (VUIIS), Vanderbilt University Medical Center, Nashville, TN, United States, 3Department of Biomedical Engineering, Vanderbilt University, Nashville, TN, United States, 4Department of Radiology and Radiological Sciences, Vanderbilt University, Nashville, TN, United States
Synopsis
Keywords: Microstructure, Microstructure, MR microscopy, Diffusion MR microscopy, Micro-solenoid RF coils, Ultra-high field strength, Mouse spinal cord
Motivation: The research aims to overcome the challenges of performing microscopy to assess the microstructure of mouse spinal cords at high spatial resolution.
Goal(s): Our goal is to develop a micro-solenoid radiofrequency circuit, which combined with ultra-high field strength and fast imaging sequences, including diffusion MRI, can achieve microscopic-resolution images.
Approach: The study involves the development of a micro-solenoid transceiver coil, and imaging at 15.2 T using fast diffusion imaging sequences to achieve images of excised specimens at microscopic resolution.
Results: The micro-solenoid radiofrequency circuit significantly improved SNR, enabling high-resolution imaging and accurate data sets for implementing diffusion models at micron-scale resolution.
Impact: High-resolution diffusion imaging may provide estimates of diffusion parameters at a scale more commensurate with the microstructure of the spinal cord than in vivo acquisitions. This will be useful for validating models of water diffusion in complex environments neuronal tissue.
Introduction
MR microscopy typically requires long scan times due to the low signal-to-noise ratio at very high spatial resolution. Past studies1,2,3,4 have shown that it is possible to significantly reduce the scan time using miniaturized micro-solenoid/surface coils. However, most of the past MRM1,3 studies focused on acquiring conventional T1- and T2-weighted images. Diffusion MR microscopy (dMRM) is known to be sensitive to the internal structure of tissue as it affects the Brownian motion of water in tissue compartments. However, the scan time for dMRM is also long, and thus very few dMRM4–7 studies have been carried out in the past at spatial resolutions ≤ 20 𝜇𝑚.We developed a micro-solenoid RF circuit and used it with an ultra-high field strength of 15.2 T, and fast diffusion imaging pulse sequences. This allowed us to achieve high-resolution anatomical images of ex vivo mouse spinal cord with a spatial resolution of 9.93×9.67×70.21 𝜇𝑚3 and diffusion-weighted images (acquired using pulsed and oscillating gradients) with resolution 17×17×500 𝜇𝑚3. These preliminary results lay the foundation for diffusion microscopy at high resolution within reasonable scan times for better estimation of microstructural properties with high accuracy.Methods
Sample preparationA 1.5 mm glass capillary was filled with 17mM CuSO4 for SNR comparison between different coils. For tissue imaging, perfusion-fixed mouse spinal cords were extracted and immersed in a fixative made up of 0.5 % paraformaldehyde, 4% glutaraldehyde, and 1mM Gadolinium in phosphate buffer and refrigerated for one week. The spinal cords were washed using phosphate buffer and 1mM Gadolinium mixture three days before imaging. Spinal cords were immersed in Fomblin media for scanning.
Development of micro-solenoid transceiver coil
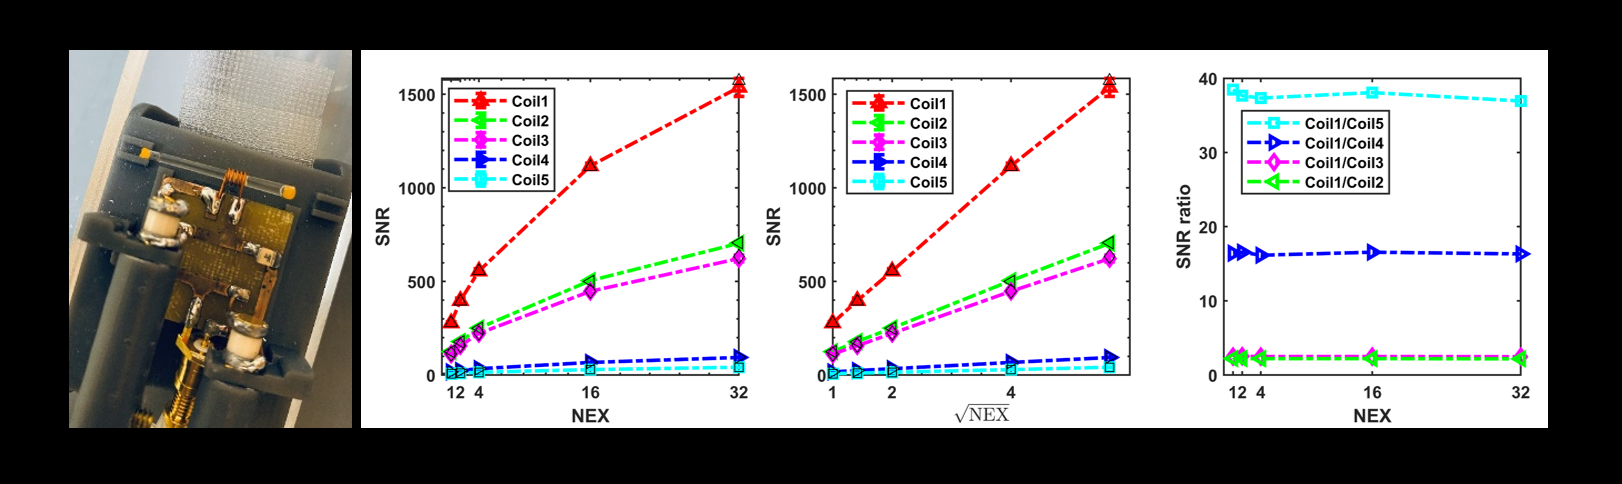
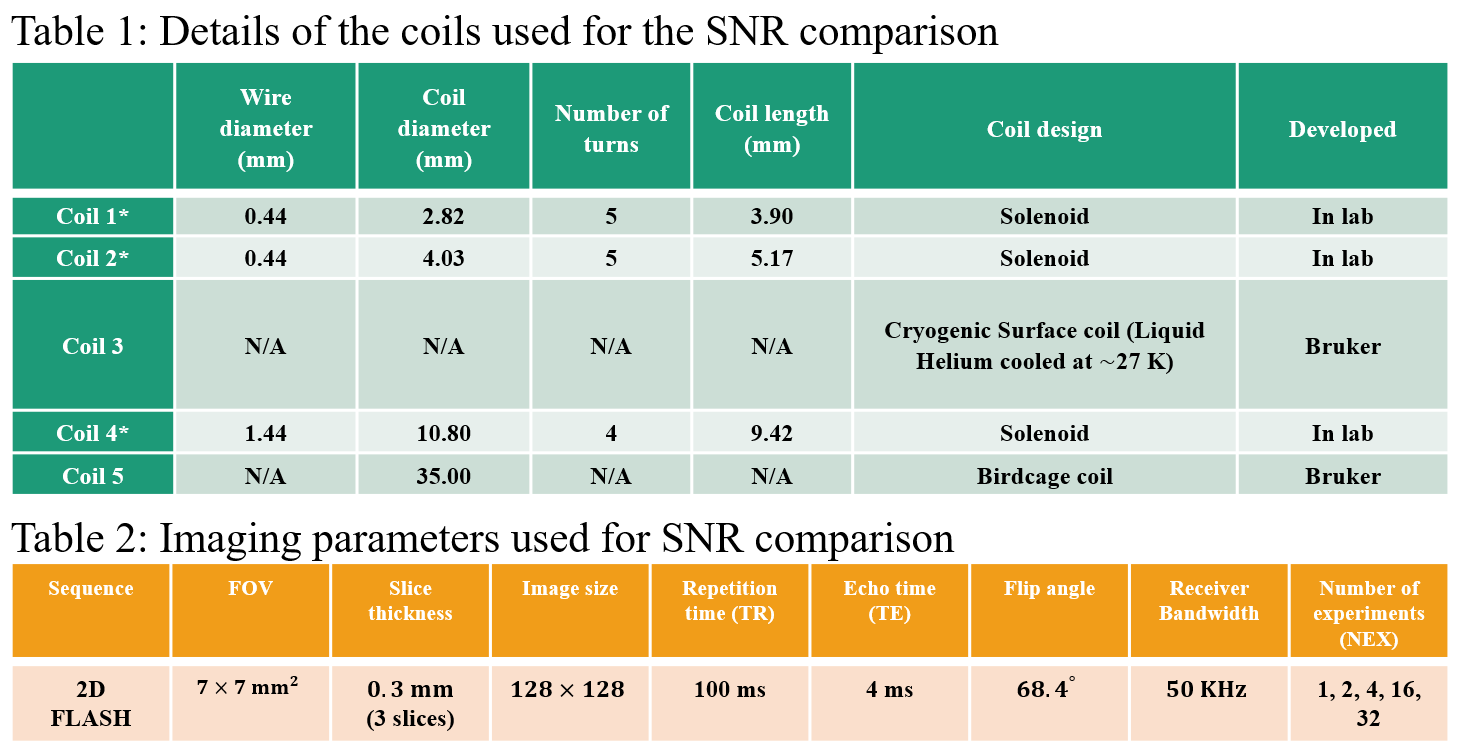
A tune-and-match transceive micro-solenoid radiofrequency (RF) circuit was developed using a copper solenoid, trim capacitors (1-12 pF), chip capacitors (33 pF), and printed circuit board as shown in Figure 1 left. To evaluate the performance of different micro-solenoid coils, SNR comparisons were made between three solenoid diameters and a cryogenic whole-mouse coil as well as a standard 35mm volume coil (see Figure1 and 2).
MRI acquisition
MR imaging was performed on a 15.2 T Bruker BioSpin Spectrometer (Billerica, MA) equipped with gradients of strength 1000 𝑚𝑇/𝑚 and an MR console running ParaVision 6.0.1. A fast low-angle shot (FLASH) pulse sequence was used for acquiring anatomical images and a rapid acquisition with a refocusing echo (RARE) pulse sequence was used for acquiring diffusion weighted images. The images were reconstructed using REMMI-Matlab toolbox (https://github.com/remmi-toolbox/remmi-matlab).
Results
SNR comparison between coilsSNR was significantly higher for the smallest micro-coil by a factor of 2.4 compared to the cryogenic coil and a factor of 38 compared to the volume coil (see Figure 1 and 2).
MR microscopy of the spinal cord
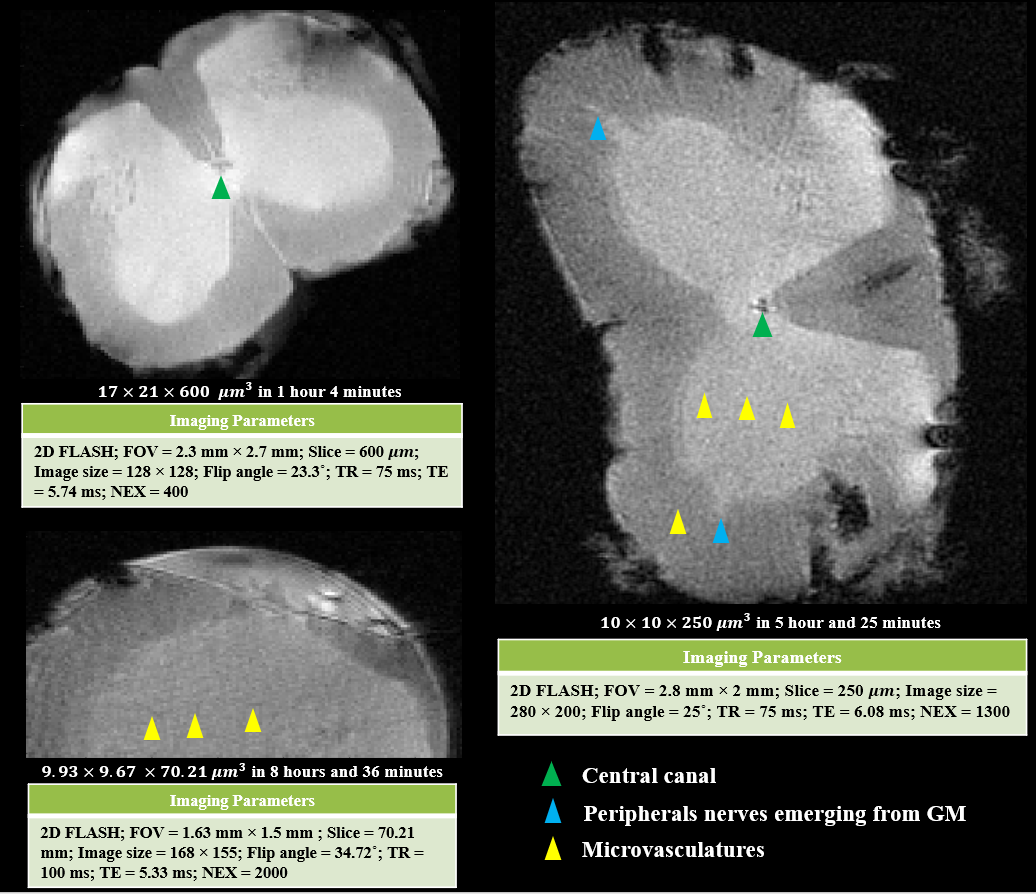
2D FLASH images of excised mouse spinal cords were acquired at various spatial resolutions ranging from 17×21×600 𝜇𝑚3 to 9.93×9.67×70.21 𝜇𝑚3 as shown in Figure 3. As the resolution was increased, several structures such as the central canal, peripheral nerve fibers emerging from grey matter, and microvasculature were resolved.
Diffusion microscopy of the spinal cord
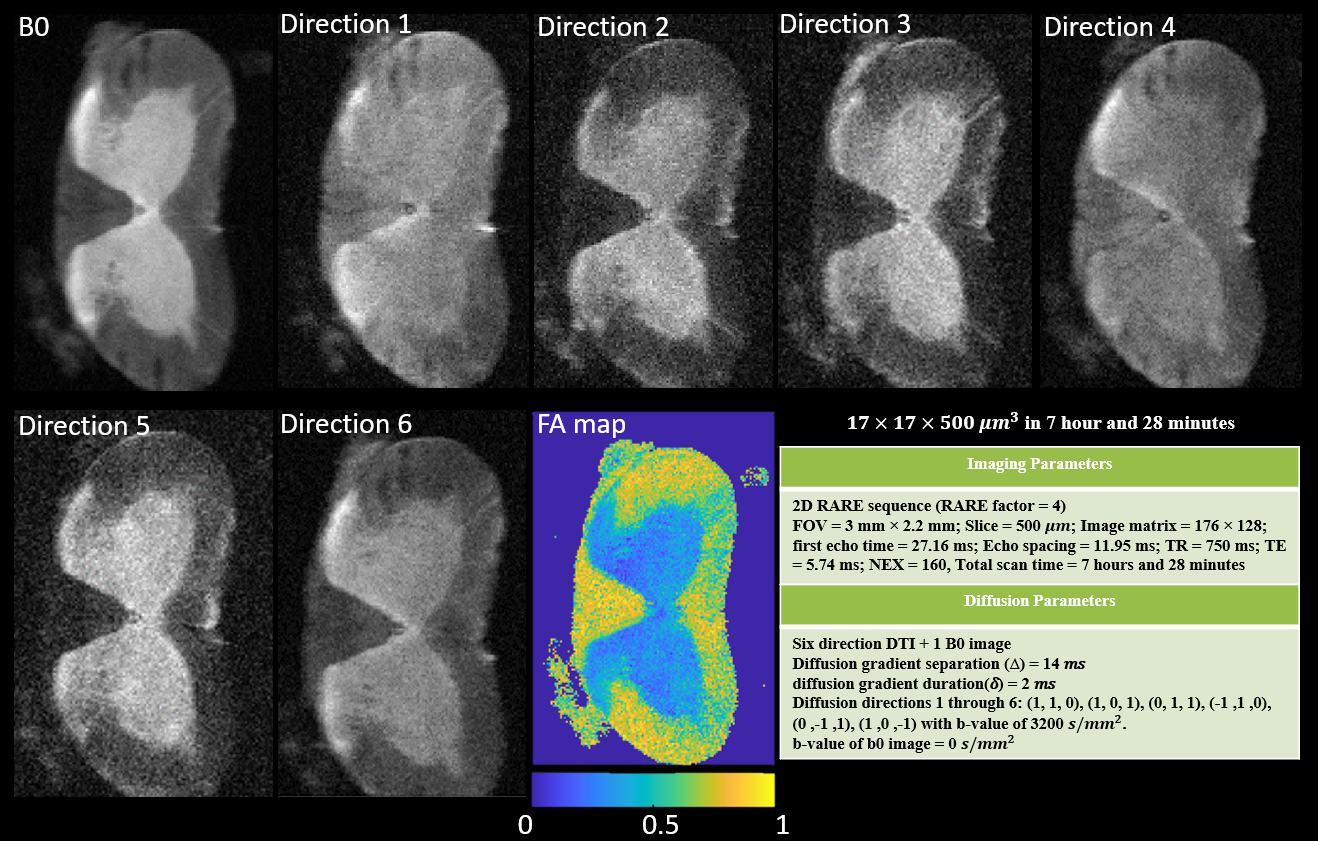
Diffusion tensor imaging (DTI) of excised mice spinal cord with pulsed gradient (PGSE) at spatial resolution of 17×17×500 𝜇𝑚3 resolved tissue microstructure (see Figure 4) including central canal and peripheral nerve fibers originating from the ventral horn of grey matter to white matter. Fractional anisotropy (FA) map at high resolution was generated to reveal spatial heterogeneity on a scale below conventional voxel sizes.
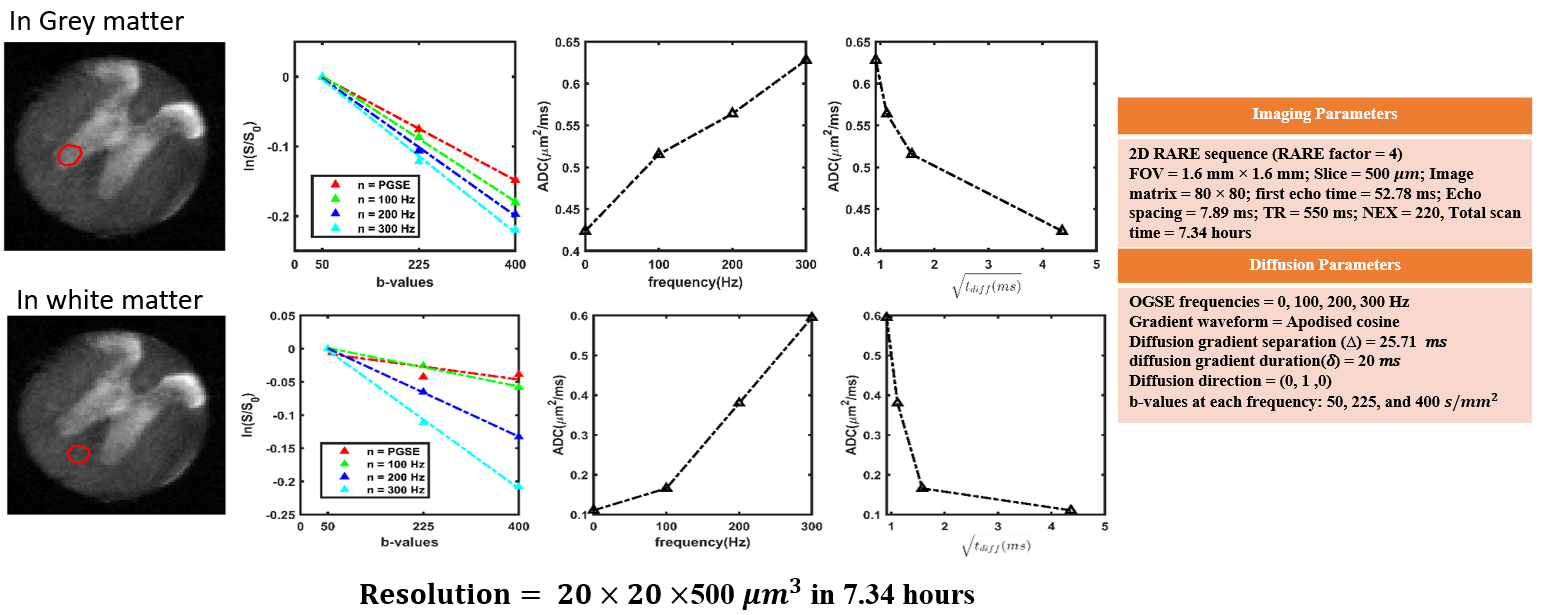
Diffusion-weighted images at a spatial resolution of 20×20×500 𝜇𝑚3 were acquired using cosine modulated oscillating gradient spin echo (OGSE) diffusion weighting with gradient frequency ranging from 0 – 300 Hz and b-value ranging from 50 – 400 𝑠/𝑚𝑚2 at each frequency. ADC increased as the OGSE frequency increased (see Figure 5) as previously reported8,9.
Discussion
High-resolution FLASH imaging using micro-solenoid RF circuits revealed structural heterogeneity on a scale below the sizes of voxels typical of in vivo images. However, confirmation with histology needs to be conducted in the future. Diffusion microscopy of the mouse spinal cord was carried out with both the PGSE and OGSE schemes, enabling the acquisition of data sets to quantify models of diffusion such as DTI, NODDI10, VERDICT11, and IMPULSED9,12 in the future.Conclusion
Micro-solenoid RF circuit design significantly improved the SNR efficiency. High-resolution anatomical images can resolve micro-structures in neuronal tissue below the scale of conventional images, aiding in the accurate estimation of conventional DTI metrics and the interpretation of diffusion models. Reduced partial volume effects at high resolution may also improve the estimation of tissue microstructural properties.Acknowledgements
This work was supported by Chan-Zuckerberg Initiative (CZI) for Deep Tissue Imaging. The authors would like to acknowledge Gary Drake and Shuyang Chai for their help during coil development and Daniel Colvin for his constant help during the imaging experiments.References
(1) Ciobanu, L.; Webb, A. G.; Pennington, C. H. Magnetic Resonance Imaging of Biological Cells. Progress in Nuclear Magnetic Resonance Spectroscopy 2003, 42 (3–4), 69–93. https://doi.org/10.1016/S0079-6565(03)00004-9.
(2) Neuberger, T.; Webb, A. Radiofrequency Coils for Magnetic Resonance Microscopy. NMR Biomed. 2009, 22 (9), 975–981. https://doi.org/10.1002/nbm.1246.
(3) van Schadewijk, R.; Krug, J. R.; Shen, D.; Sankar Gupta, K. B. S.; Vergeldt, F. J.; Bisseling, T.; Webb, A. G.; Van As, H.; Velders, A. H.; de Groot, H. J. M.; Alia, A. Magnetic Resonance Microscopy at Cellular Resolution and Localised Spectroscopy of Medicago Truncatula at 22.3 Tesla. Sci Rep 2020, 10 (1), 971. https://doi.org/10.1038/s41598-020-57861-7.
(4) Flint, J. J.; Lee, C. H.; Hansen, B.; Fey, M.; Schmidig, D.; Bui, J. D.; King, M. A.; Vestergaard-Poulsen, P.; Blackband, S. J. Magnetic Resonance Microscopy of Mammalian Neurons. NeuroImage 2009, 46 (4), 1037–1040. https://doi.org/10.1016/j.neuroimage.2009.03.009.
(5) Flint, J. J.; Hansen, B.; Fey, M.; Schmidig, D.; King, M. A.; Vestergaard-Poulsen, P.; Blackband, S. J. Cellular-Level Diffusion Tensor Microscopy and Fiber Tracking in Mammalian Nervous Tissue with Direct Histological Correlation. NeuroImage 2010, 52 (2), 556–561. https://doi.org/10.1016/j.neuroimage.2010.04.031.
(6) Flint, J. J.; Hansen, B.; Portnoy, S.; Lee, C.-H.; King, M. A.; Fey, M.; Vincent, F.; Stanisz, G. J.; Vestergaard-Poulsen, P.; Blackband, S. J. Magnetic Resonance Microscopy of Human and Porcine Neurons and Cellular Processes. NeuroImage 2012, 60 (2), 1404–1411. https://doi.org/10.1016/j.neuroimage.2012.01.050.
(7) Flint, J. J.; Menon, K.; Hansen, B.; Forder, J.; Blackband, S. J. Visualization of Live, Mammalian Neurons during Kainate-Infusion Using Magnetic Resonance Microscopy. NeuroImage 2020, 219, 116997. https://doi.org/10.1016/j.neuroimage.2020.116997.
(8) Does, M. D.; Parsons, E. C.; Gore, J. C. Oscillating Gradient Measurements of Water Diffusion in Normal and Globally Ischemic Rat Brain. Magn. Reson. Med. 2003, 49 (2), 206–215. https://doi.org/10.1002/mrm.10385.
(9) Xu, J.; Li, H.; Harkins, K. D.; Jiang, X.; Xie, J.; Kang, H.; Does, M. D.; Gore, J. C. Mapping Mean Axon Diameter and Axonal Volume Fraction by MRI Using Temporal Diffusion Spectroscopy. NeuroImage 2014, 103, 10–19. https://doi.org/10.1016/j.neuroimage.2014.09.006.
(10) Zhang, H.; Schneider, T.; Wheeler-Kingshott, C. A.; Alexander, D. C. NODDI: Practical in Vivo Neurite Orientation Dispersion and Density Imaging of the Human Brain. NeuroImage 2012, 61 (4), 1000–1016. https://doi.org/10.1016/j.neuroimage.2012.03.072.
(11) Panagiotaki, E.; Walker-Samuel, S.; Siow, B.; Johnson, S. P.; Rajkumar, V.; Pedley, R. B.; Lythgoe, M. F.; Alexander, D. C. Noninvasive Quantification of Solid Tumor Microstructure Using VERDICT MRI. Cancer Research 2014, 74 (7), 1902–1912. https://doi.org/10.1158/0008-5472.CAN-13-2511.
(12) Jiang, X.; Li, H.; Xie, J.; McKinley, E. T.; Zhao, P.; Gore, J. C.; Xu, J. In Vivo Imaging of Cancer Cell Size and Cellularity Using Temporal Diffusion Spectroscopy: Cancer Cell Size and Cellularity Using IMPULSED. Magn. Reson. Med. 2017, 78 (1), 156–164. https://doi.org/10.1002/mrm.26356.
Figures