0595
Identify molecular subtypes in breast cancer using time-dependent diffusion MRI based microstructural mapping1Radiology, Chongqing University Cancer Hospital, chongqing, China, 2Biomedical Engineering, College of Biomedical Engineering & Instrument Science, Zhejiang University, hangzhou, China, 3MR Collaborations, Siemens Healthineers, chengdu, China
Synopsis
Keywords: Microstructure, Breast
Motivation: It is imperative to noninvasively assess molecular subtypes in patients with breast cancer, as these play a vital role in guiding treatment approaches and monitoring outcomes. However, conventional apparent diffusion coefficient measurements may not reliably identify the histopathologic differences in molecular subtypes.
Goal(s): We explore the feasibility of time-dependent diffusion MRI (td-dMRI) based microstructural mapping for noninvasive identification of molecular subtypes.
Approach: The td-dMRI method was validated on breast cancer patients, and microstructural parameters were estimated and compared among molecular subtypes.
Results: The cellularity and diameter derived from td-dMRI proved effective for identifying molecular subtypes in breast cancer.
Impact: Microstructural mapping derived from td-dMRI proves to be an effective method for predicting molecular subtypes, demonstrating unique microstructural properties acroess various molecular subtypes, and thus is promising in personalizing treatment strategies.
Introduction
In clinical practice, molecular subtype plays a vital role in guiding treatment strategies and monitoring treatment outcomes. Diffusion weighted imaging allows for noninvasive assessment of tissue microenvironment and the characterization of breast cancer subtypes. However, there is a significant overlap in apparent diffusion coefficient (ADC) values among these molecular subtypes1. Advances in time-dependent diffusion MRI (td-dMRI) based methods provide a promising approach for modeling tumor microstructures in vivo. By measuring the dMRI signals at varying diffusion times, the time dependency can be captured and used to characterize microstructural properties, such as the cell diameter, intracellular fraction (fin), and cellularity2. The clinical feasibility of td-dMRI in tumor applications has been explored in prostate tumors, breast tumors3,4, and head and neck tumors. Therefore, we aim to explore the feasibility of td-dMRI based microstructural mapping for noninvasive identification of molecular subtypes of breast cancer and to validate the performance.Methods
Study PopulationThis prospective study was approved by the Institutional Review Board of our hospital. Informed consent was obtained from all patients. In total, 101 patients (mean age: 52.17 years ± 10.49) with breast cancer, comprising 66 patients with luminal subtype, 21 patients with TNBC subtype, and 14 patients with HER2-enriched subtype, were recruited.
Data Acquisition
MRI was performed on a 3T system (MAGNETOM Prisma, Siemens Healthineers, Erlangen, Germany). An oscillating-gradient spin-echo (OGSE) sequence 4 with trapezoid-cosine gradients was implemented with 2D echoplanar imaging acquisition. OGSE data was acquired at 25 Hz (effective td = 10 ms, 2 cycles, b = 250/500/750/1000 s/mm2) and 50 Hz (effective td = 5 ms, 1 cycle, b = 250/500 s/mm2) with a maximum gradient of 114.5 mT/m combining three axes and 6 diffusion directions. Other scan parameters were: TE/TR = 5000/111 ms, FOV = 260 × 260 mm2; inplane resolution = 2.6 × 2.6 mm2; slice thickness = 4 mm; slice number = 10; and total scan time = 4.5 minutes.
Image Analysis
The td-dMRI data were subjected to fitting using Imaging Microstructural Parameters Using Limited Spectrally Edited Diffusion (IMPULSED) to estimate the values of cell diameter, fin, and extracellular diffusivity (Dex) 5. The value of Din was fixed at 0.9 µm2/ms to ensure fitting stability. The parameter values were constrained to fall within the physiologically relevant range of 0 < diameter < 30μm, 0.1 < fin < 0.9, 0.5 < Dex < 3.5μm2/ms. Cellularity was represented as fin/diameter∙100 5. Additionally, the ADC maps were fitted according to S/S0 = exp(-b∙D) using a log-linear fitting with all b values at each td.
Statistical Analysis
Univariate analysis of td-dMRI microstructural parameters was performed to predict the molecular subtype. Then, we ranked the parameters by their importance scores and used a forward selection procedure to include the multiple features in the logistic regression model. The area under the receiver operating characteristic curve (AUC) was used as the classification metric to evaluate the predictive ability.
Results
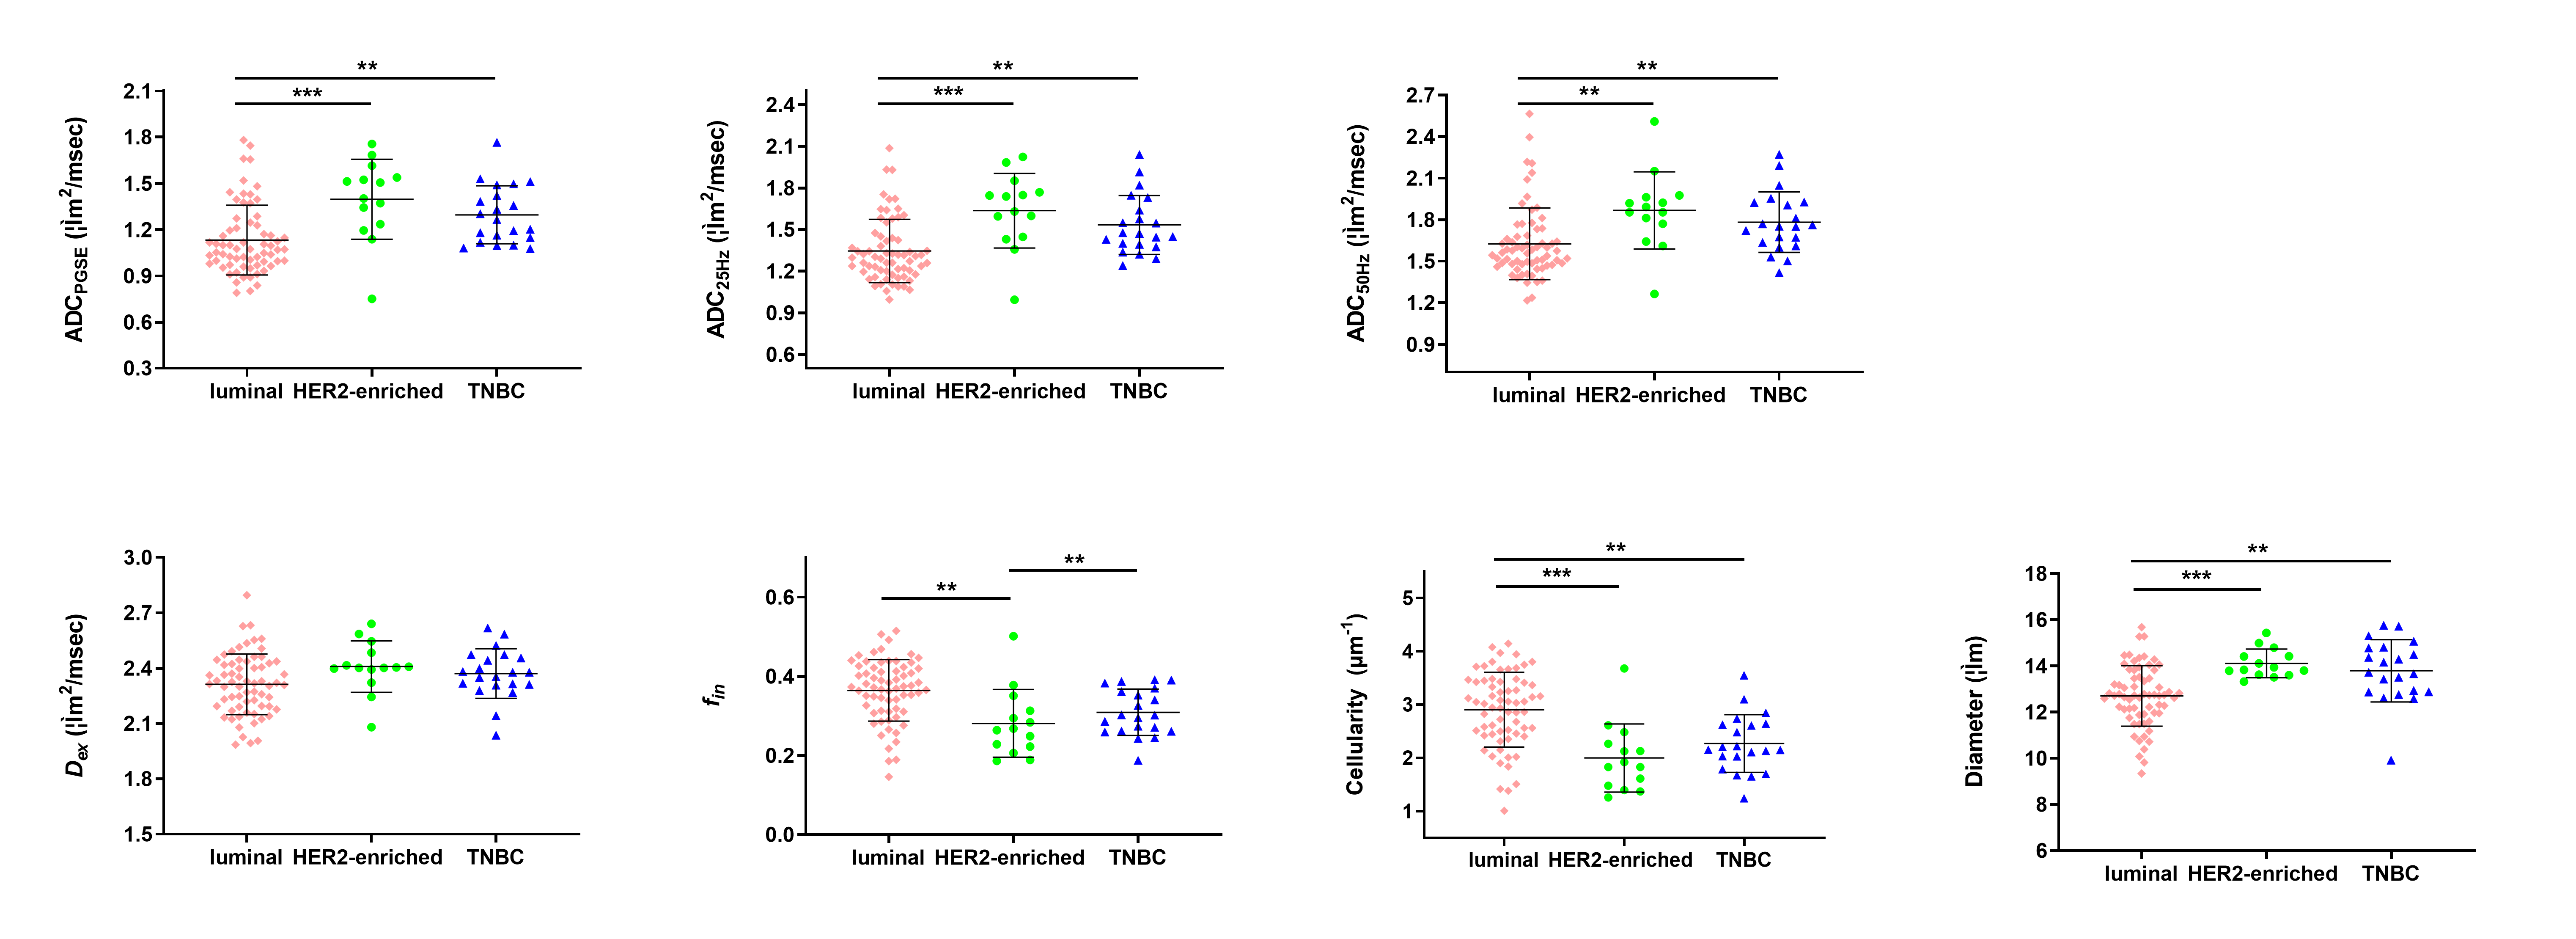
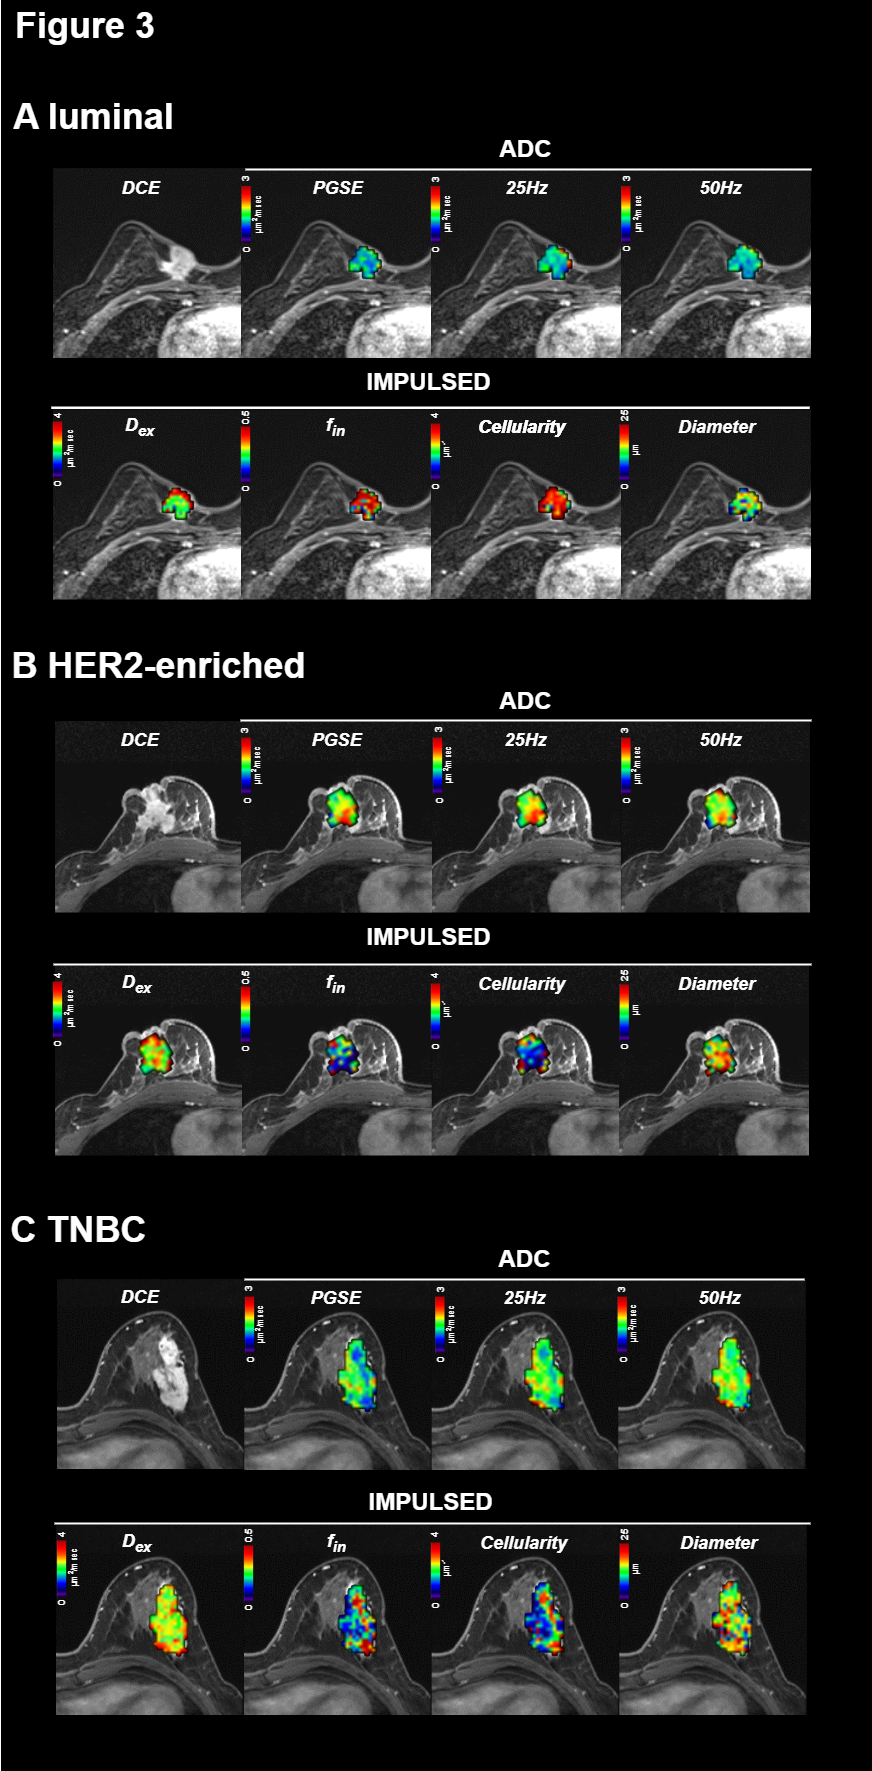
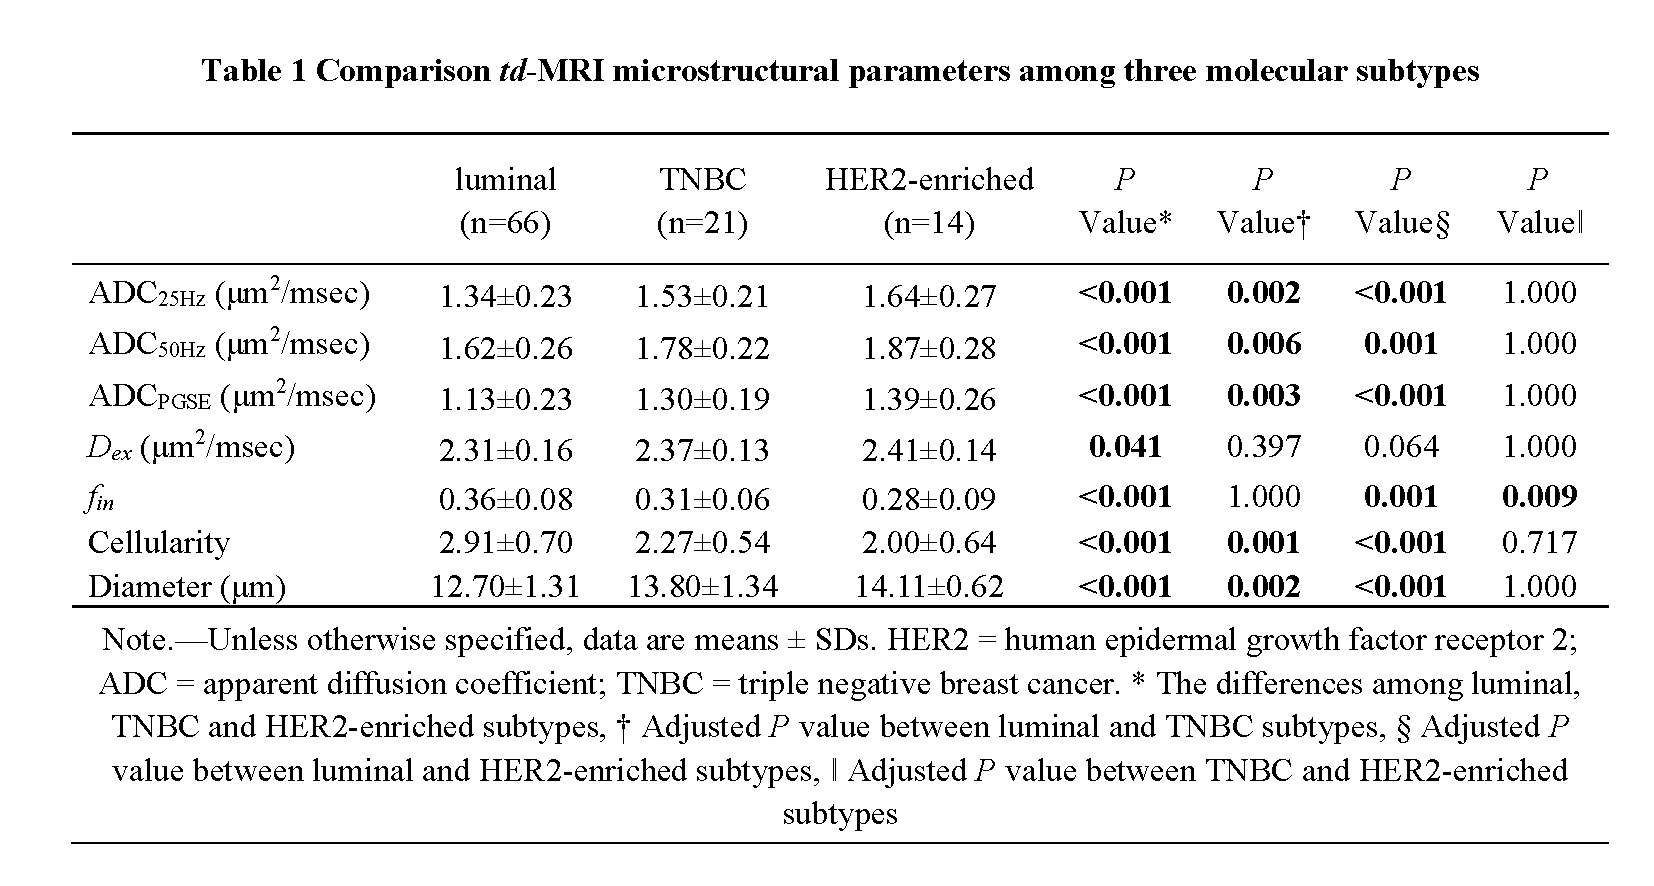
Significant differences were observed among the three molecular subtypes for all td-dMRI microstructural parameters (all P < 0.05) (Figure 1). Among these parameters, the luminal subtype exhibited the lowest ADC and diameter, as well as the highest cellularity (all adjusted P < 0.05, table 1). Figure 2 shows the dynamic contrast-enhanced MRI, ADC maps at different oscillating frequencies, and td-dMRI -fitted microstructural parameter maps from three patients.The use of cellularity enabled to distinguish the luminal subtype with the highest AUC among the td-dMRI microstructural parameters, producing AUC of 0.79, which was superior to ADCPGSE (AUC of 0.77). When combining cellularity and diameter, the AUC were significantly higher compared to using cellularity alone (AUC of 0.82). The cellularity showed superior performance in identifying the HER2-enriched subtype compared with ADCPGSE (AUC of 0.79 vs. 0.77). When distinguishing between TNBC and non-TNBC, the cellularity also demonstrated the highest performance, with AUC of 0.69.
Discussion and Conclusion
Our proposed td-dMRI technology offers distinct advantages in depicting the cell microstructure across different molecular subtypes, by characterizing the diffusion time dependence of restricted water diffusion and connecting this diffusion time dependence to specific microstructure parameters5. We found that among all td-dMRI microstructural parameters, cellularity played a pivotal role and demonstrated the highest performance in distinguishing between the three molecular subtypes, outperforming conventional ADC measurements. Additionally, the combination of cellularity and diameter significantly improved the AUC for identifying the luminal subtype.Acknowledgements
We thank the study participants and referring technicians for their participation in this study.References
1. Surov, A. et al. Apparent diffusion coefficient cannot predict molecular subtype and lymph node metastases in invasive breast cancer: a multicenter analysis. BMC cancer 19, 1043, doi:10.1186/s12885-019-6298-5 (2019).
2. Wu, D. et al. Diffusion‐prepared 3D gradient spin‐echo sequence for improved oscillating gradient diffusion MRI. Magnetic Resonance in Medicine 85, 78-88, doi:10.1002/mrm.28401 (2020).
3. Xu, J. et al. Magnetic resonance imaging of mean cell size in human breast tumors. Magnetic Resonance in Medicine 83, 2002-2014, doi:10.1002/mrm.28056 (2019).
4. Ba, R. et al. Diffusion-time dependent diffusion MRI: effect of diffusion-time on microstructural mapping and prediction of prognostic features in breast cancer. European Radiology 33, 6226-6237, doi:10.1007/s00330-023-09623-y (2023).
5. Wu, D. et al. Time-Dependent Diffusion MRI for Quantitative Microstructural Mapping of Prostate Cancer. Radiology 303, 578-587, doi:10.1148/radiol.211180 (2022).
Figures