0594
Spatial Imaging Transcriptomic reveals the molecular basis among diffusion MRM models1Key Laboratory for Biomedical Engineering of Ministry of Education, Department of Biomedical Engineering, College of Biomedical Engineering & Instrument Science, Zhejiang University, Hangzhou, China, Hangzhou, China
Synopsis
Keywords: Microstructure, Microstructure, Spatial Imaging Transcriptomic;Data Integration;Mouse Brain
Motivation: Integration of MRI and spatial transcriptomics may provide a new approach for imaging-genetics research for probing molecular basis underlying observed MRI phenotypes.
Goal(s): We proposed a pipeline for integration of diffusion MRI(dMRI) and spatial transcriptomics of mouse brain to understand potential biological pathway underlying dMRI microstructural models.
Approach: We spatially co-register population-averaged dMRI maps of mouse brain to 2D spatial transcriptomic for pixelwise correlation and explored genes function and celltype related with dMRI metrics.
Results: We found FA was associated with myelination and oligodendrocyte and water diffusivity was associated with neurons. We identified molecular basis driving two distinct gradients of dMRI in cortex.
Impact: Integration of spatial transcriptomics and MRI enables imaging-genomics analysis at an unprecedented resolution. Our study revealed molecular basis for typical microstructural markers in diffusion MRI. We further revealed genetic driven force of cortical gradients in axial and radial diffusivity maps.
Introdunction
Imaging-transcriptomic analysis provides insights into biological and molecular substrates for MRI-based phenotypes1,2, and previous studies typically used ROI-based and bulk-based method, e.g., utilizing the Allen Human Brain Atlas3. Recent development of high-throughput spatial transcriptomic technique with unprecedented resolution, and the integration between spatial transcriptome and MRI, namely spatial imaging-transcriptomics, may offer insights to regional patterns, e.g., genetic driven force of the layer-specific MRI contrasts.Method
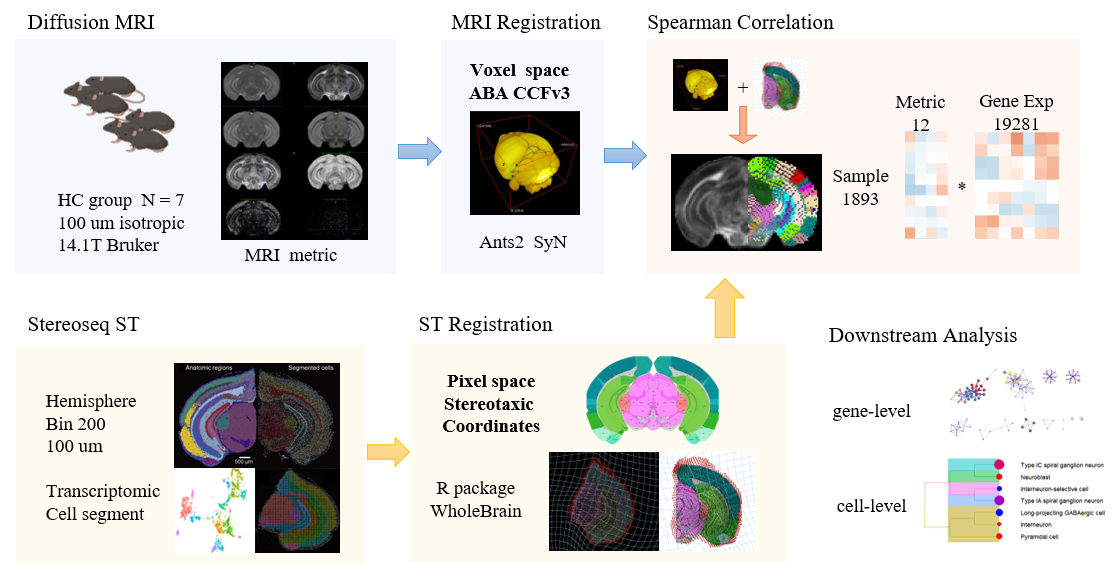
Ex vivo diffusion MRI (dMRI) data were acquired from adult mouse brains (n = 7) at 100 μm isotropic resolution by 14.1T Bruker, and microstructural markers from several dMRI models were obtained, including Diffusion Tensor Imaging (DTI) and Diffusion Based Spectrum Imaging (DBSI). Spatial transcriptome of an adult mouse brain was obtained with Stereo-seq technique hemisphere and we utilized a coronal section along with its cell segment from MOSTA project4.We proposed a pipeline (Fig.1) for spatial imaging-transcriptomics by co-registration of transcriptomics and dMRI data via the Allen Mouse Brain Atlas(AMBA). dMRI data was registered to AMBA CCFv35 and Stereo-seq section was registered to 2D AMBA by WholeBrain6. This way we obtained the spatial correspondence between each spot of Stereo-seq (downsampled to 100 μm resolution) and dMRI for pixelwise correlation, and the high-correlated genes were fed to downstream analysis like enrichment by Metascape7.
Results
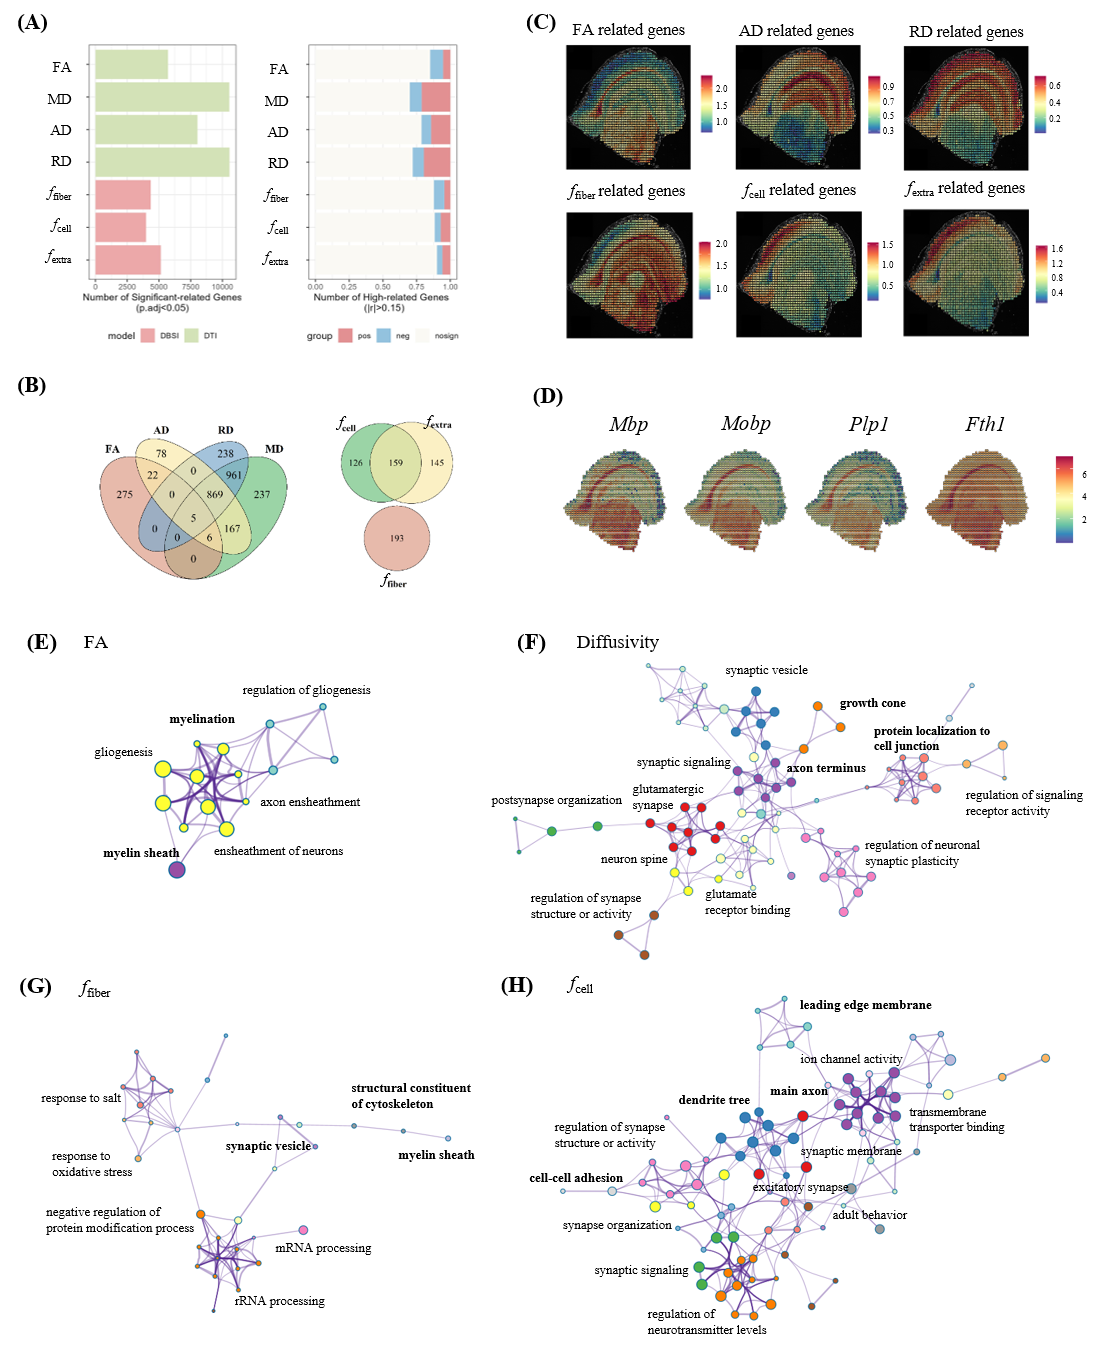
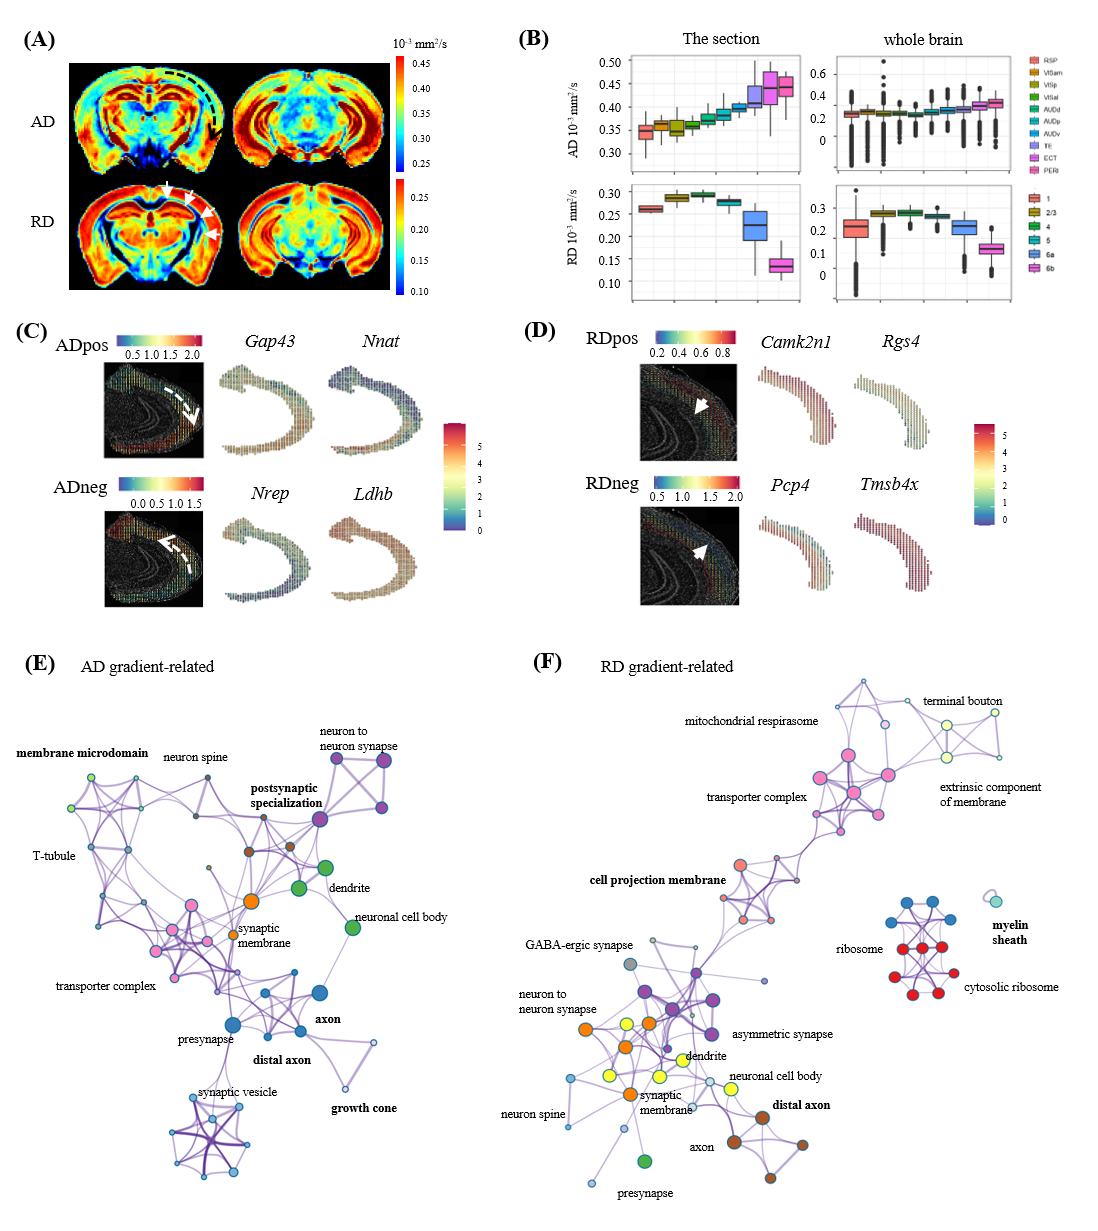
The genes that were highly-correlated (FDR corrected p<0.05 and |r|>0.15) were selected (Fig. 2A). Spatial patterns (mean expression) of these highly-correlated gene were presented in Fig. 2C. Genes correlated with fractional anisotropy (FA, n=306) from DTI model were linked with myelin sheath and glia cell (Fig. 2E), while the fiber fraction (ffiber, n=193) related genes were enriched in myelin sheath and cytoskeleton (Fig. 2G), suggesting both shared and different molecular mechanism underlying the different microstructural markers. Genes correlated with the diffusivity metrics (n=875) were less specific, pointing to large functional modules, including various neural connection compound and activity, such as synapse, axon, synaptic vesicle and associated regulation (Fig.2F). Genes correlated with cell fraction (fcell, n=285) enriched in other cell-related term like cell adhesion, cell lead edge (Fig. 2H).Interestingly, we identified two spatial gradients in cortex based on axial diffusivity (AD) along the axis of cortex or transition from isocortex to mesocortex and allocortex, and radial diffusivity (RD) maps along the depth of cortex layer, respectively (Fig.3A-B). Genes most highly-correlated with AD gradient were specific to nervous activity such as Gap43,Ly6h,Fxy6d primarily expressed in the hippocampus and associated cortex and Pvalb,Gabra1 markered interneuron. Enrichment of RD correlated genes were involve in various synapse and associated structure, growth cone, and myelin sheath which were known to be differentially expressed in different cortical layers.
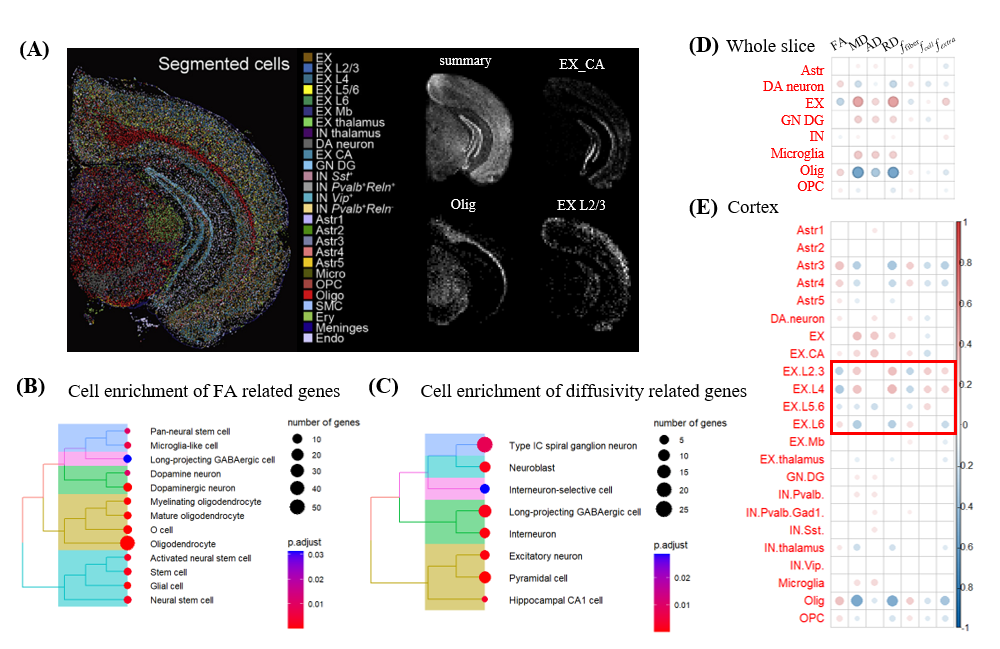
Mouse cell marker from CellMarker2.08 was used for enrichment to explore the relation of dMRI metrics and cell type indirectly. We found FA was associated with oligodendrocyte and other glial cell and diffusivity metrics were associated with various excitatory neuron and interneuron (Fig. 4B-C). Combined with cell annotations from MOSTA (Fig. 4A), we found that EX neuron was positive correlated with diffusivity metrics and negative correlated with FA, and microglia and granule cell of dentate gyrus had a similar trend; while oligodendrocyte and dopaminergic neuron showed an opposite trend(Fig. 4C). If we only focused on the cortex area, a gradual reversed relationship between EX layer-specify neurons and dMRI metrics along the cortical depth was observed(Fig. 4D), e.g., RD was positively correlated with EX L2/-4 neurons but negatively correlated with EX L6 neurons, which may be resulted from different function and morphology of neurons in superficial and deeper layers.
Discussion and Conclusion
We demonstrate a new analysis pipeline called Spatial Imaging Transcriptomic to explore potential biological pathway and molecular mechanism underlying dMRM measurements. Our results demonstrated that different dMRI models and their associated microstructural markers were supported by distinct cellular and molecular processes. For example, fiber tracts and oligodendrocyte contributed to the anisotropy of water diffusion while neuron and associated connection compounds influence water diffusivity. Genes and cells with gradual change from isocortex to allocortex, such as hippocampal pyramidal neurons and interneuron marker genes Pvalb,Gabra1 may explain the spatial gradient of AD, and EX layer-specific neurons may explain the spatial gradient of RD in the mouse brain cortex.Acknowledgements
This work is supported by the National Natural Science Foundation of China (81971606, 82122032), and Science and Technology Department of Zhejiang Province (2022C03057, 202006140)References
[1]Diez I, Sepulcre J. Unveiling the neuroimaging-genetic intersections in the human brain. Curr Opin Neurol. 2021 Aug 1;34(4):480-487. doi: 10.1097/WCO.0000000000000952.
[2]Martins D, Giacomel A, Williams SCR, Turkheimer F, Dipasquale O, Veronese M; PET Templates Working Group. Imaging transcriptomics: Convergent cellular, transcriptomic, and molecular neuroimaging signatures in the healthy adult human brain. Cell Rep. 2021 Dec 28;37(13):110173. doi: 10.1016/j.celrep.2021.110173. PMID: 34965413.
[3]Bo, T., Li, J., Hu, G. et al. Brain-wide and cell-specific transcriptomic insights into MRI-derived cortical morphology in macaque monkeys. Nat Commun 14, 1499 (2023). https://doi.org/10.1038/s41467-023-37246-w
[4]Chen et al., Spatiotemporal transcriptomic atlas of mouse organogenesis using DNA nanoball-patterned arrays, Cell (2022), https://doi.org/10.1016/j.cell.2022.04.003
[5]Wang Q, Ding SL, Li Y, Royall J, Feng D, Lesnar P, Graddis N, Naeemi M, Facer B, Ho A, Dolbeare T, Blanchard B, Dee N, Wakeman W, Hirokawa KE, Szafer A, Sunkin SM, Oh SW, Bernard A, Phillips JW, Hawrylycz M, Koch C, Zeng H, Harris JA, Ng L. The Allen Mouse Brain Common Coordinate Framework: A 3D Reference Atlas. Cell. 2020 May 14;181(4):936-953.e20. doi: 10.1016/j.cell.2020.04.007. Epub 2020 May 7. PMID: 32386544; PMCID: PMC8152789.
[6]Fürth, D., Vaissière, T., Tzortzi, O. et al. An interactive framework for whole-brain maps at cellular resolution. Nat Neurosci 21, 139–149 (2018). https://doi.org/10.1038/s41593-017-0027-7
[7]Hu C, Li T, Xu Y, Zhang X, Li F, Bai J, Chen J, Jiang W, Yang K, Ou Q, Li X, Wang P, Zhang Y. Zhou Y, Zhou B, Pache L, Chang M, Khodabakhshi AH, Tanaseichuk O, Benner C, Chanda SK. Metascape provides a biologist-oriented resource for the analysis of systems-level datasets. Nat Commun. 2019 Apr 3;10(1):1523. doi: 10.1038/s41467-019-09234-6. PMID: 30944313; PMCID: PMC6447622.
[8]CellMarker 2.0: an updated database of manually curated cell markers in human/mouse and web tools based on scRNA-seq data. Nucleic Acids Res. 2023 Jan 6;51(D1):D870-D876. doi: 10.1093/nar/gkac947. PMID: 36300619; PMCID: PMC9825416
Figures