0592
Elucidating Micro-scale Fiber Trajectories at 16μ in Anisotropic Phantoms via Structural Tensor Analysis1Learning Research and Development Center, University of Pittsburgh, PITTSBURGH, PA, United States, 2Max Planck Institute for Biological Cybernetics, Tübingen, Germany, 3Department for Biomedical Magnetic Resonance, University Hospital Tübingen, Tübingen, Germany, 4Psychology Software Tools, Pittsburgh, PA, United States, 5Department of Developmental Biology, University of Pittsburgh, Pittsburgh, PA, United States, 6Learning Research and Development Center, University of Pittsburgh, Pittsburgh, PA, United States, 7Psychology, University of Pittsburgh, Pittsburgh, PA, United States, 8Bioengineering, University of Pittsburgh, Pittsburgh, PA, United States, 9Neurosurgery, Pittsburgh, PA, United States, 10Radiology, University of Pittsburgh, Pittsburgh, PA, United States
Synopsis
Keywords: Phantoms, Phantoms, Validation, microstructural Imaging
Motivation: This study utilizes a custom-designed fiber crossing configuration based on anisotropic textile hollow fiber phantom and harnesses high-resolution 14T MRI to unravel manufactured fiber crossings at a microscopic scale.
Goal(s): By applying structural tensor analysis in combination with eigenvalue decomposition, we have estimated underlying fiber orientations and visualized in multi-planar, directional-color-encoded maps.
Approach: This innovative approach yielded precise angular measurements across the volume to delineate the expected fiber orientation and crossing angles, thereby validating the structural tensor method's efficacy in capturing complex fiber architecture within a controlled environment.
Results: This Phantom can provide a ground truth for validating diffusion MRI based crossing assessments.
Impact: This research presents a pivotal advancement for validating MRI-based fiber crossing, offering a novel phantom design for assessing the accuracy and limitations of MRI methods in resolving complex fiber architectures in biological tissues.
Introduction
Accurately characterizing fiber orientation in anisotropic materials1,2 is crucial for understanding structural complexities, especially in biomedical contexts like brain white matter3. Diffusion MRI often struggles with fiber crossings, leading to uncertainties in mapping anatomical connectivity4-7. To mitigate this, we have developed a textile phantom that precisely replicates known fiber crossing angles based on textile-based hollow fiber called Taxons8,9, providing a reliable standard for testing dMRI fiber tracking.Employing a high-resolution scan on 14T Bruker machine and structural tensor analysis1—a technique proven in material sciences2—This study aims to extend the application of structural tensor analysis to discern fiber orientations in complex structures2,3. This approach could provide ground truth for advancing dMRI accuracy and can be used to evaluate the performance of various mathematical diffusion MRI models against intricate fiber configurations in biological tissue17.
Methods
Phantom ConstructionA cubic, hollow shell with a 60° crossing was fabricated via 3D printing to house the water-filled taxons. These taxons are constructed using nylon, can contain dissolvable copolyester, and be filled with water8,9. A 60° taxonal crossing pattern was engineered through layer-by-layer 3D printing, composing eight layers to the desired 60° crossing configuration.
Data Acquisition
The phantom was scanned on a 14T Bruker at Tubinegen, Germany. 3D volume is acquired with the following MR parameters used in scanning: FoV: 30.72x16.38x8.192 mm, voxel dimensions: 0.016x0.016x0.040 mm³, with a total of 461 axial slices, with TE/TR = 10.5ms/50ms.
Preprocessing
The 3D volumes underwent a series of preprocessing steps to accentuate fiber contrast. Noise reduction was accomplished utilizing the ANTs software suite10, followed by bias field correction11-12 to standardize signal intensity across the volume. A CHALE filter13-16 was applied to heighten the contrast differential between the taxon and water in the background. Afterward, an inversion filter generated T1-weighted contrast, ensuring fibers appeared hyperintense relative to the surrounding water.
Structural Tensor Analysis
Structural tensor analysis is performed using GPU-based Python library structure tensor2 to estimate the tensor for each voxel. The smoothing parameters, ρ(integration scale) = 2.76 and σ(noise scale) = 11.04, used in the computation, were informed by the voxel size and size of the taxons. Further, the estimated tensor underwent eigenvalue decomposition to estimate principal eigenvalues/vectors for each voxel. Based on the principle eigenvector, an in-plane angular metric is calculated, ranging from -90° to +90°, to quantify the orientation of fibers relative to the xy-plane.
Orientation Classification and Visualization
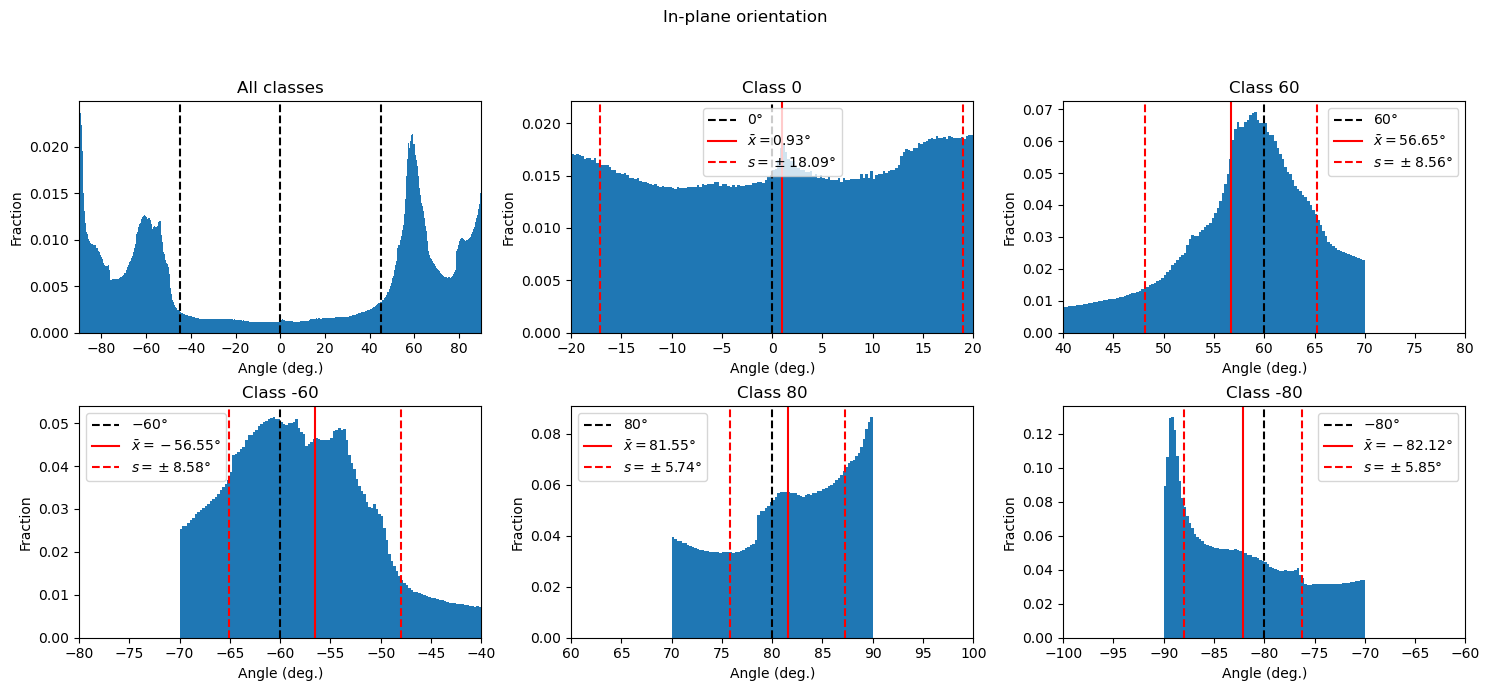
The in-plane angular metric in each voxel is used to classify the orientation of taxons with the crossing configuration. The density plot of all voxels delineated five distinct orientation classes (0, ±60°, and ±80°) that identify the manufactured crossing. The Separate density plots for each class facilitated the identification of the mean taxonal orientation and its standard deviation. All plots were created using Python's Matplotlib library.
Results and Discussion
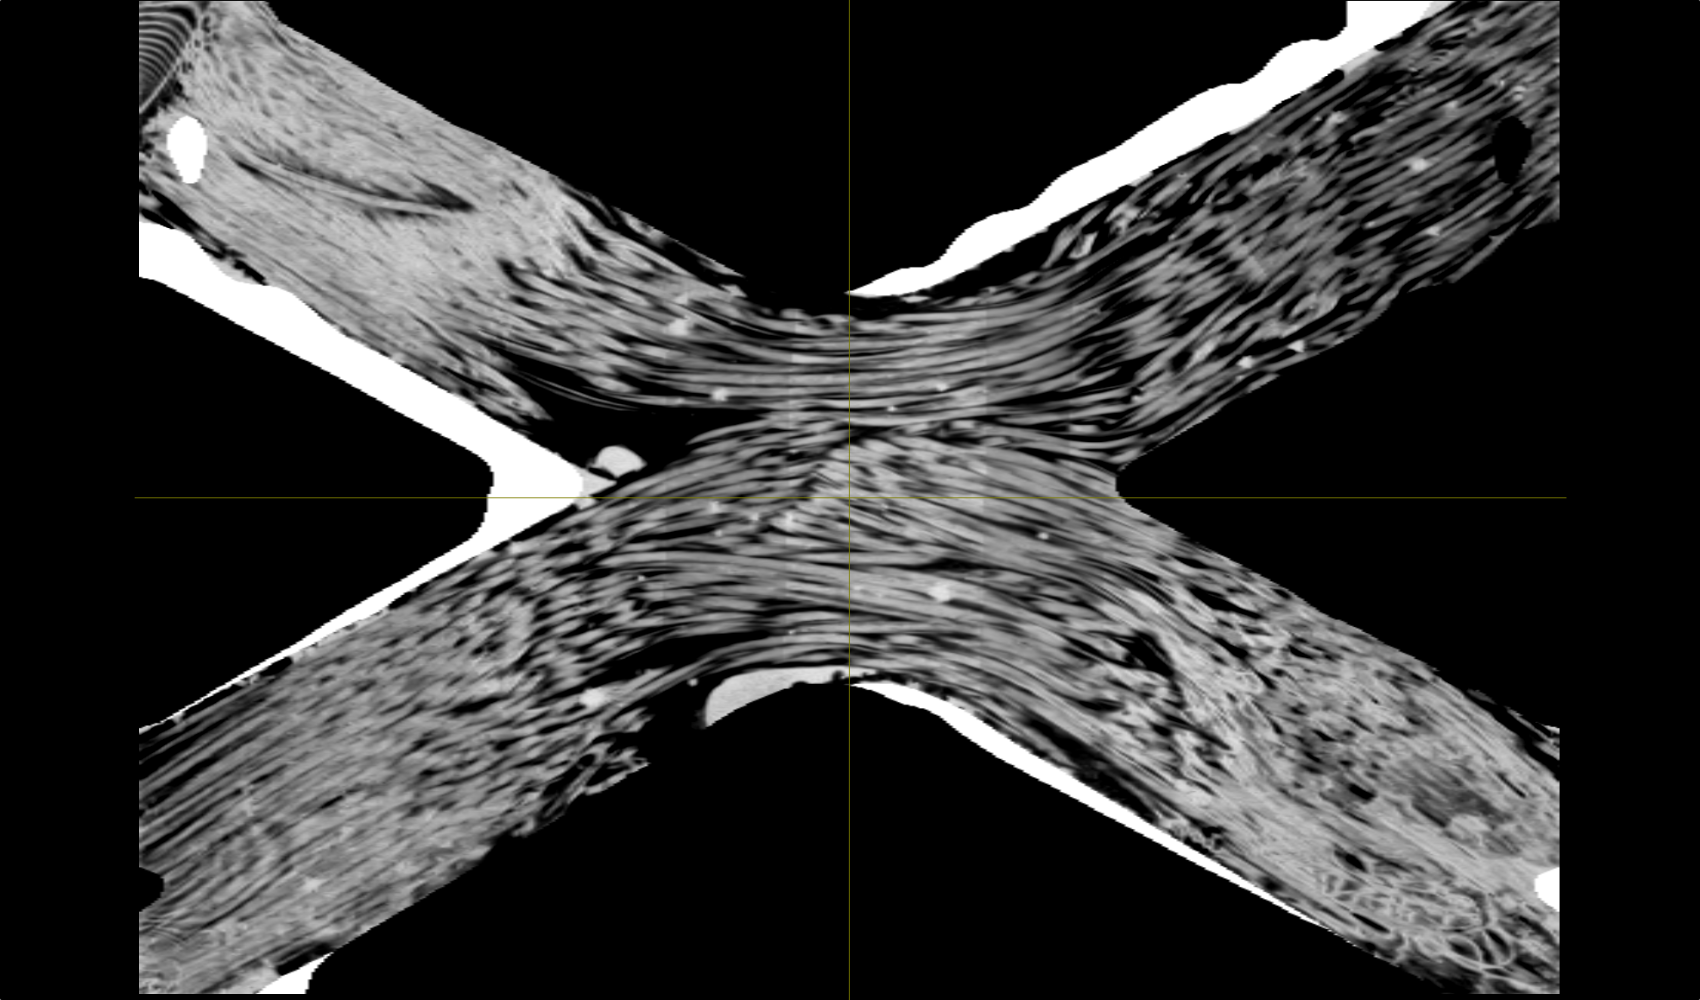
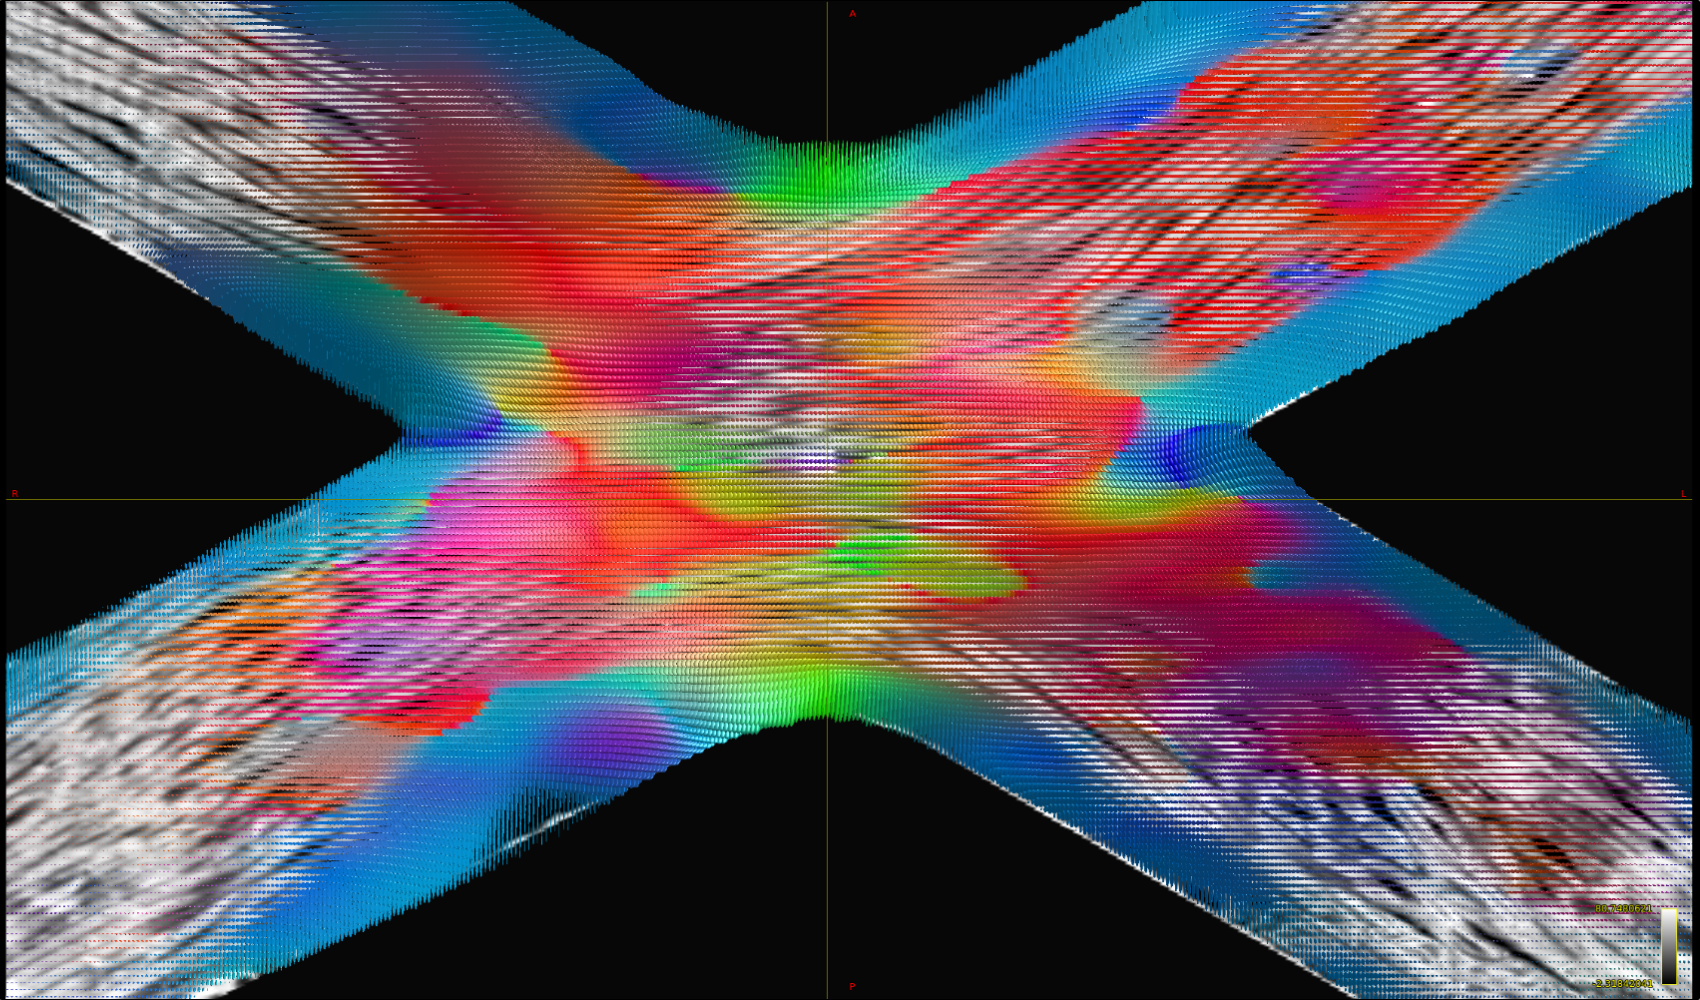
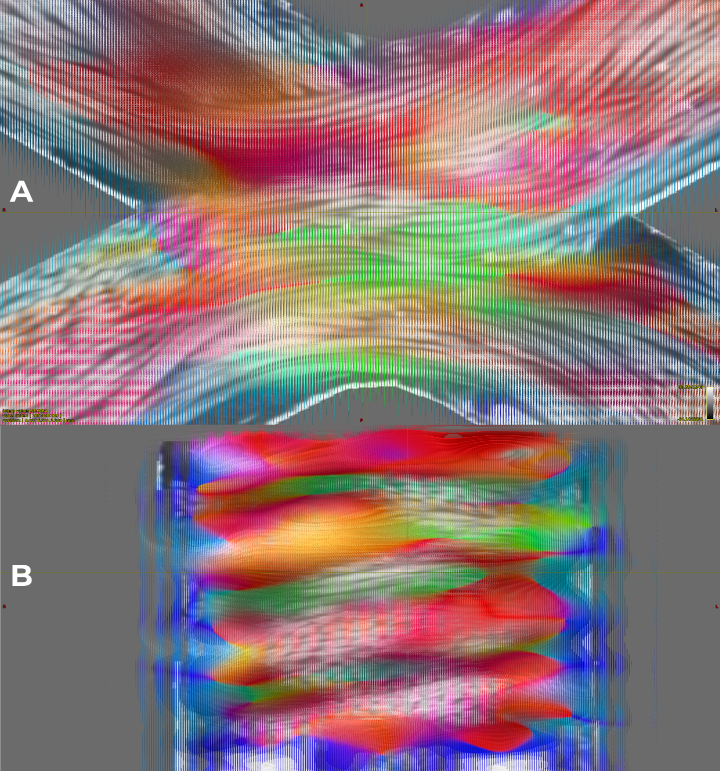
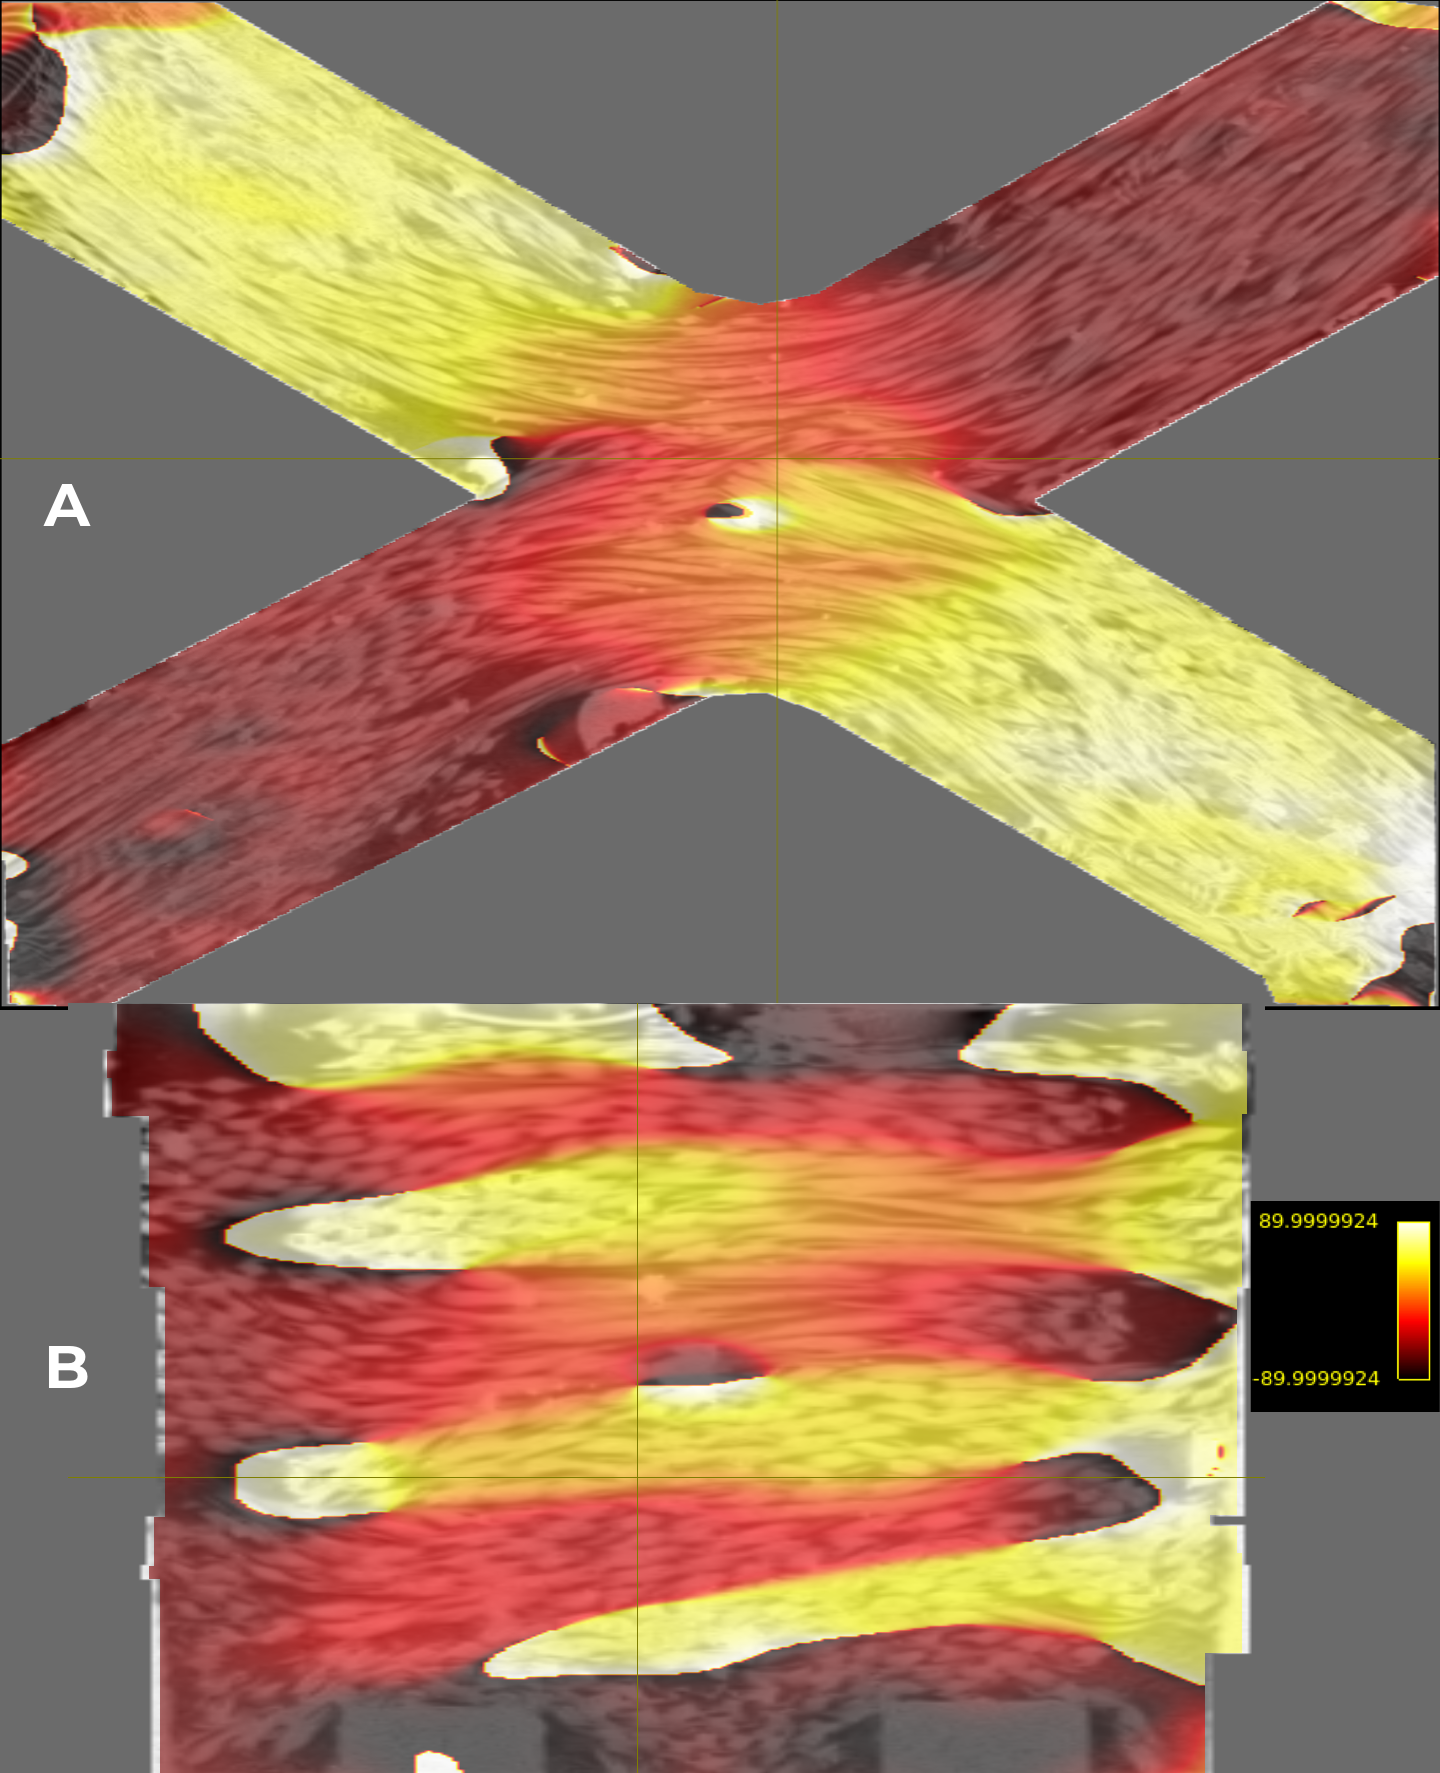
The anisotropic taxon-based phantom is scanned at 14T with high-resolution imaging to reveal underlying ground truth taxonal orientations, particularly at crossings with a 60° angle (Figure 1). The structural tensors technique calculates the structural tensor for each voxel (Figure 2) with optimal smoothing parameters (ρ=2.76, σ=11.04). Eigenvalue decomposition is used to estimate taxon orientation for each voxel. The estimated eigenvector is represented as color-encoded directional mapping in axial and coronal slices, illustrating the complex crossing patterns within the phantom (Figure 3). Further, the in-plane angular metrics were quantitatively assessed, with the resulting angles ranging from -90° to 90°. These were represented as red and yellow bands on the structural image, indicating that taxons are oriented in opposite directions within the crossing configuration (Figure 4). Density plots of these angles highlighted the predominant orientation classes within the fiber bundles, with a clear peak at 60° validating the expected crossing angle and the 80° class aligning with the xy-plane, confirming the phantom's design specifications (Figure 5). Phantom design with pre-processing and Structural tensor analysis successfully shows that it can provide ground truth data for advanced diffusion MRI methods.Conclusions
The anisotropic phantom, tailored for 14T MRI, provides a robust validation tool for resolving fiber orientations and crossings. Structural tensor analysis, supported by eigenvalue decomposition and precise angular measurements, has proven effective in delineating intricate crossing patterns. This methodology affirms the phantom's design and demonstrates the potential for enhanced characterization of fiber orientations in complex biological tissues. The discernible peaks at critical angles in the density plots affirm the structural tensor's capability to detect and classify fiber orientations accurately, providing a quantitative foundation for future studies to challenge and refine diffusion MRI techniques.Acknowledgements
- Our work on the fibers, fixtures, and routing of fiber paths is supported by (NIH/NINDS, R44-NS103729)
- This project was funded by the. NIH/NINDS, R44-NS103729, DoD project W81XWH-20-1-0774, Veteran Administration Contract VA I01RX003444and the David Scaife Foundation of Pittsburgh
References
1. Jeppesen, N., et al. "Quantifying effects of manufacturing methods on fiber orientation in unidirectional composites using structure tensor analysis." Composites Part A: Applied Science and Manufacturing 149 (2021): 106541.
2. Jeppesen, N., et al. "Characterization of the fiber orientations in non-crimp glass fiber reinforced composites using structure tensor." IOP Conference Series: Materials Science and Engineering. Vol. 942. No. 1. IOP Publishing, 2020.
3. Wang, Hui, Christophe Lenglet, and Taner Akkin. "Structure tensor analysis of serial optical coherence scanner images for mapping fiber orientations and tractography in the brain." Journal of biomedical optics 20.3 (2015): 036003-036003.
4. Schilling, Kurt, et al. "Can increased spatial resolution solve the crossing fiber problem for diffusion MRI?." NMR in Biomedicine 30.12 (2017): e3787.
5. Le Bihan, Denis, et al. "Artifacts and pitfalls in diffusion MRI." Journal of Magnetic Resonance Imaging: An Official Journal of the International Society for Magnetic Resonance in Medicine 24.3 (2006): 478-488.
6. Alexander, Daniel C., and Kiran K. Seunarine. "Mathematics of crossing fibers." Diffusion MRI: theory, methods, and application (2010): 451-464.
7. Jones, Derek K., Thomas R. Knösche, and Robert Turner. "White matter integrity, fiber count, and other fallacies: the do's and don'ts of diffusion MRI." Neuroimage 73 (2013): 239-254.
8. Fan, Q., Nummenmaa, A., Wichtmann, B., Witzel, T., Mekkaoui, C., Schneider, W., ... & Huang, S. Y. (2018). Validation of diffusion MRI estimates of compartment size and volume fraction in a biomimetic brain phantom using a human MRI scanner with 300 mT/m maximum gradient strength. Neuroimage, 182, 469-478.
9. Zuccolotto, Anthony P., et al. "Mri phantom including hollow fluid filled tubular textiles for calibrated anisotropic imaging." U.S. Patent Application No. 16/859,444.
10. J. V. Manjon, P. Coupe, Luis Marti-Bonmati, D. L. Collins, and M. Robles. Adaptive Non-Local Means Denoising of MR Images With Spatially Varying Noise Levels, Journal of Magnetic Resonance Imaging, 31:192-203, June 2010.
11. Sled JG, Zijdenbos AP, Evans AC. A nonparametric method for automatic correction of intensity nonuniformity in MRI data. IEEE Trans Med Imaging. 1998 Feb;17(1):87-97. doi: 10.1109/42.668698. PMID: 9617910.
12. Tustison NJ, Avants BB, Cook PA, Zheng Y, Egan A, Yushkevich PA, Gee JC. N4ITK: improved N3 bias correction. IEEE Trans Med Imaging. 2010 Jun;29(6):1310-20. doi: 10.1109/TMI.2010.2046908. Epub 2010 Apr 8. PMID: 20378467; PMCID: PMC3071855.
13. Zuiderveld, Karel. "Contrast limited adaptive histogram equalization." Graphics gems IV. 1994. 474-485.
14. G. R. Vidhya and H. Ramesh, "Effectiveness of contrast limited adaptive histogram equalization technique on multispectral satellite imagery", Proc. Int. Conf. Video Image Process., pp. 234-239, Dec. 2017.
15. Schneider, C. A., Rasband, W. S., & Eliceiri, K. W. (2012). NIH Image to ImageJ: 25 years of image analysis. Nature Methods, 9(7), 671–675. doi:10.1038/nmeth.2089
16. Schindelin, J., Arganda-Carreras, I., Frise, E., Kaynig, V., Longair, M., Pietzsch, T., … Cardona, A. (2012). Fiji: an open-source platform for biological-image analysis. Nature Methods, 9(7), 676–682. doi:10.1038/nmeth.2019
17. Jelescu, I. O., & Budde, M. D. (2017). Design and validation of diffusion MRI models of white matter. Frontiers in physics, 5, 61.
Figures