0587
Evaluation of slow flow measurement with low b-value diffusion tensor imaging using fluid phantoms in comparison with 4D-flow1Department of Radiology, Shiga University of Medical Science, Otsu, Shiga, Japan, 2FUJIFILM Healthcare Corporation, Kashiwa, Chiba, Japan
Synopsis
Keywords: DWI/DTI/DKI, Diffusion Tensor Imaging
Motivation: Is low b-value diffusion tensor imaging (low-b DTI) useful for analyzing cerebrospinal fluid flow, which is a slow and complex flow that is difficult to measure?
Goal(s): To validate low-b DTI for analyzing the slow flow.
Approach: To compare low-b DTI with 4D-flow in the fluid phantom where water flowed at a constant slow rate.
Results: A strong correlation between the mean diffusivity of Low-b DTI and the mean square of deviation of velocity of 4D-flow, which is supported by the theory that these correlate in laminar flow.
Impact: If low b-value diffusion tensor imaging is useful for analyzing slow and complex flows of cerebrospinal fluid, it should contribute to understanding the pathogenesis of various diseases in which impaired cerebrospinal fluid clearance system may be part of the etiology.
Introduction
Cerebrospinal fluid (CSF) plays an important role in the brain’s clearance system. There is a need for a technique for measuring and analyzing the slow and complex flow of CSF. Low b-value diffusion tensor imaging (low-b DTI) has been reported as a method to measure and analyze the pseudorandom flow such as CSF [1,2]. Although there are reports of DTI measured in vivo, there are not any experimental report that proves whether they reflect actual flow. Thus, we examined the validity of measuring the slow and complex flow of the fluid phantom with DTI by evaluating the correlation between low-b DTI and 4D-flow.Methods
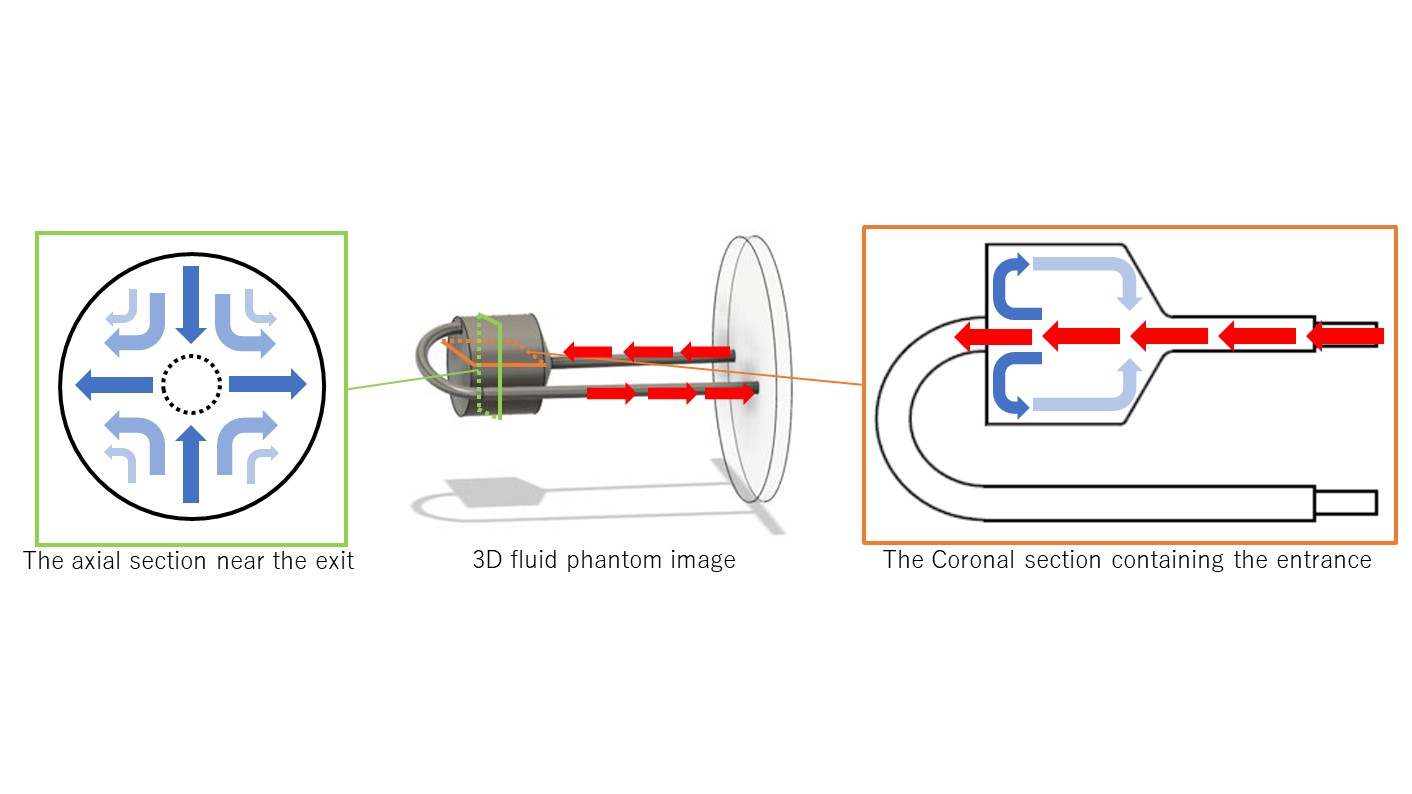
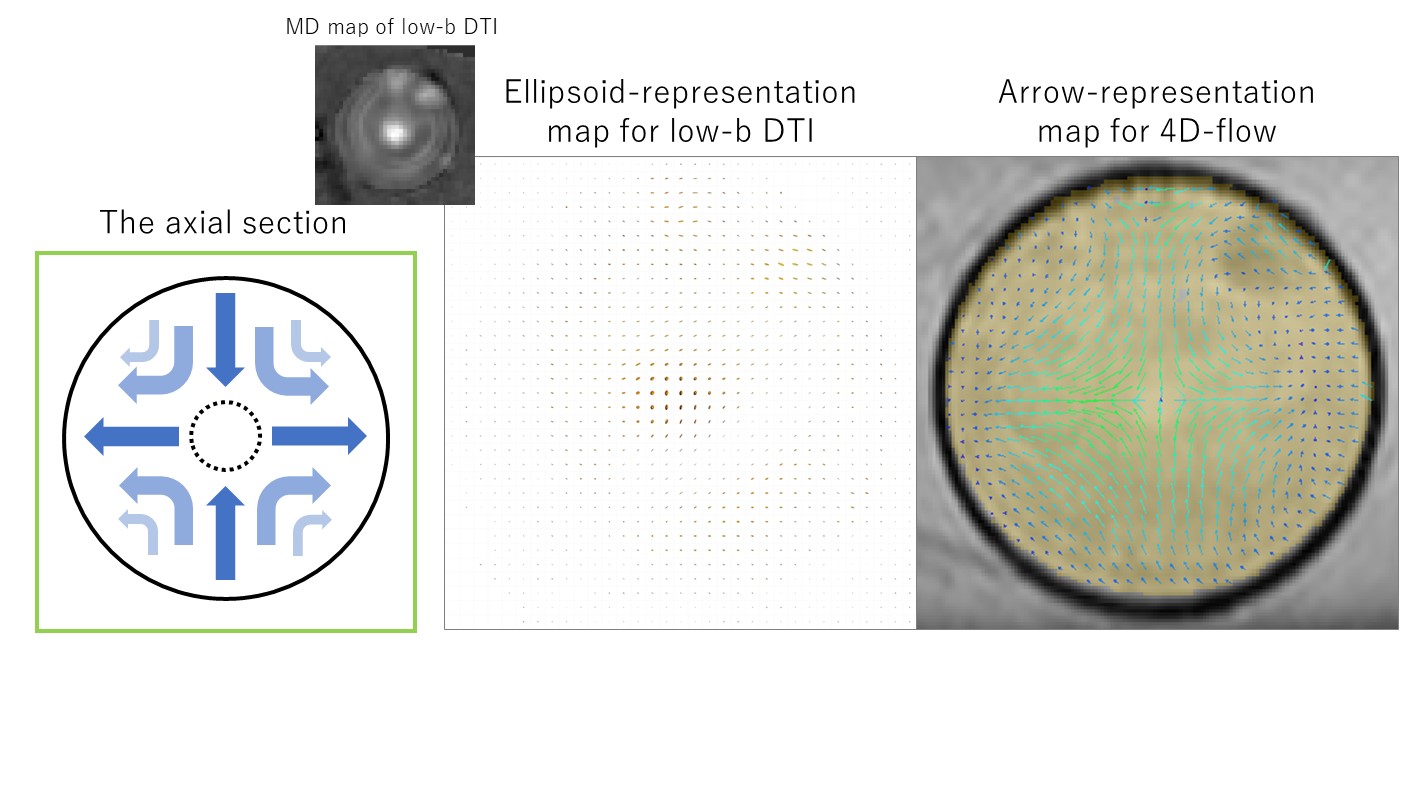
Water flowed at a constant rate (43 mL/min) from the conical side into the fluid phantom (Fig.1-A). 4D-flow MRI and DTI by 3T-MRI were obtained with the following parameters; 4D-flow: FOV=20cm, Voxel Size=1.0x1.0x2.0, TR=21.3, TE=5.6, Hyper Kat=6.0, Bandwidth=62.5, NEX=1.0 and DTI: FOV=19.2cm, Voxel Size=2.0x2.0x2.0, TR=4500, TE=74.9, Diffusion Direction=15, b-value=0, 100, Asset factor=3.0, NEX=1.0. Obtained 4D-flow data were down-sampled to 2-mm iso-voxel to match the sample size to the DTI.Two representative axial and coronal slices were selected for qualitative and quantitative analysis (Fig.1). In the qualitative analysis, tensors of low-b DTI and velocities of 4D-flow were visually assessed using ellipsoid- and arrow-representation maps, respectively (Fig. 2). In the quantitative analysis, the following voxel-wise comparisons were performed:
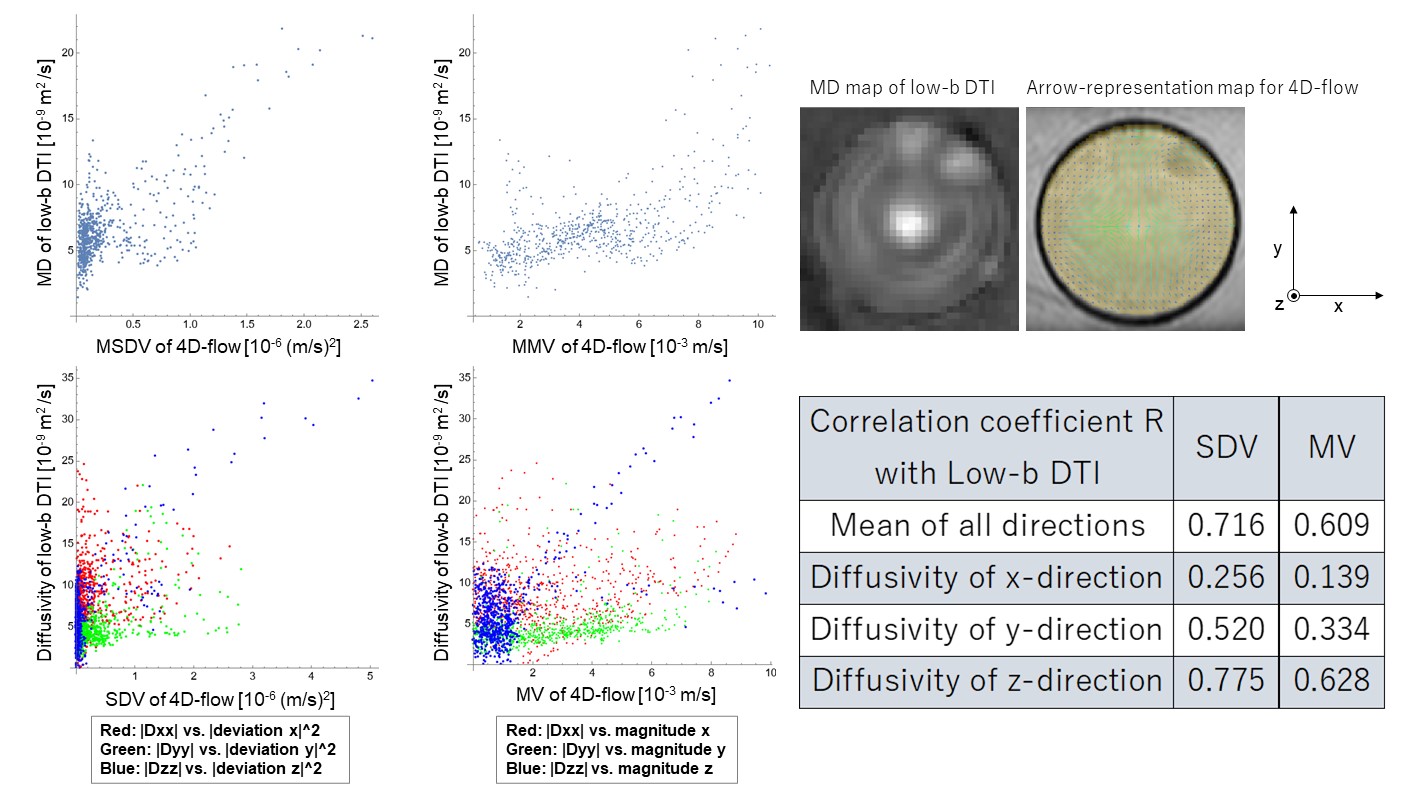
(1) Correlation between mean diffusivity (MD) of low-b DTI and (1a) mean square of deviation of velocity (MSDV) of 4D-flow, and (1b) mean magnitude of velocity (MMV) of 4D-flow,
(2) Correlation between diffusivity of each direction; |Dxx|, |Dyy|, and |Dzz| of low-b DTI and (2a) square of deviation of velocity (SDV) along x, y and z of 4D-flow, and (2b) magnitude of velocity (MV) along x, y and z of 4D-flow.
The SDV was calculated because it should theoretically correlate with diffusivity for laminar flow although the magnitude of velocity should not [1,2].
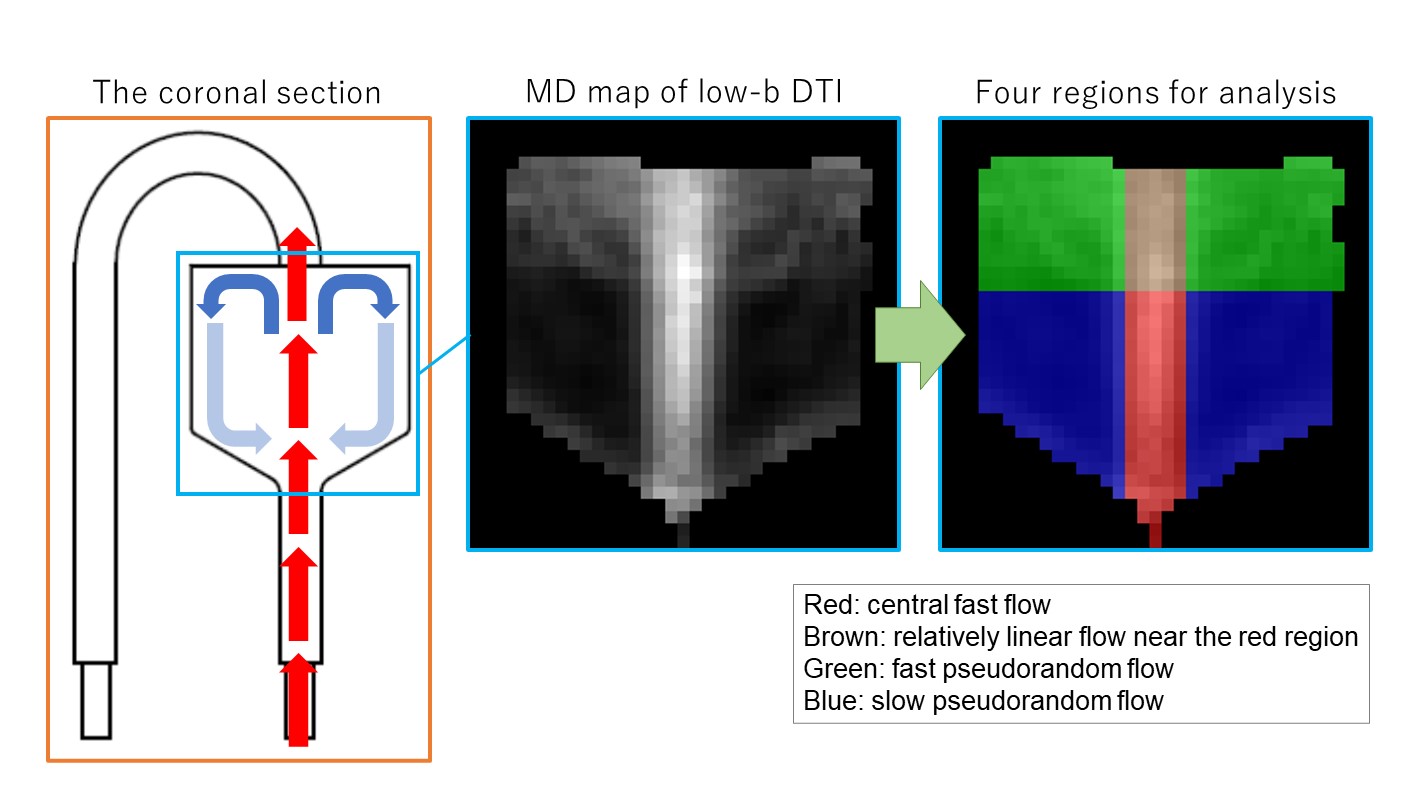
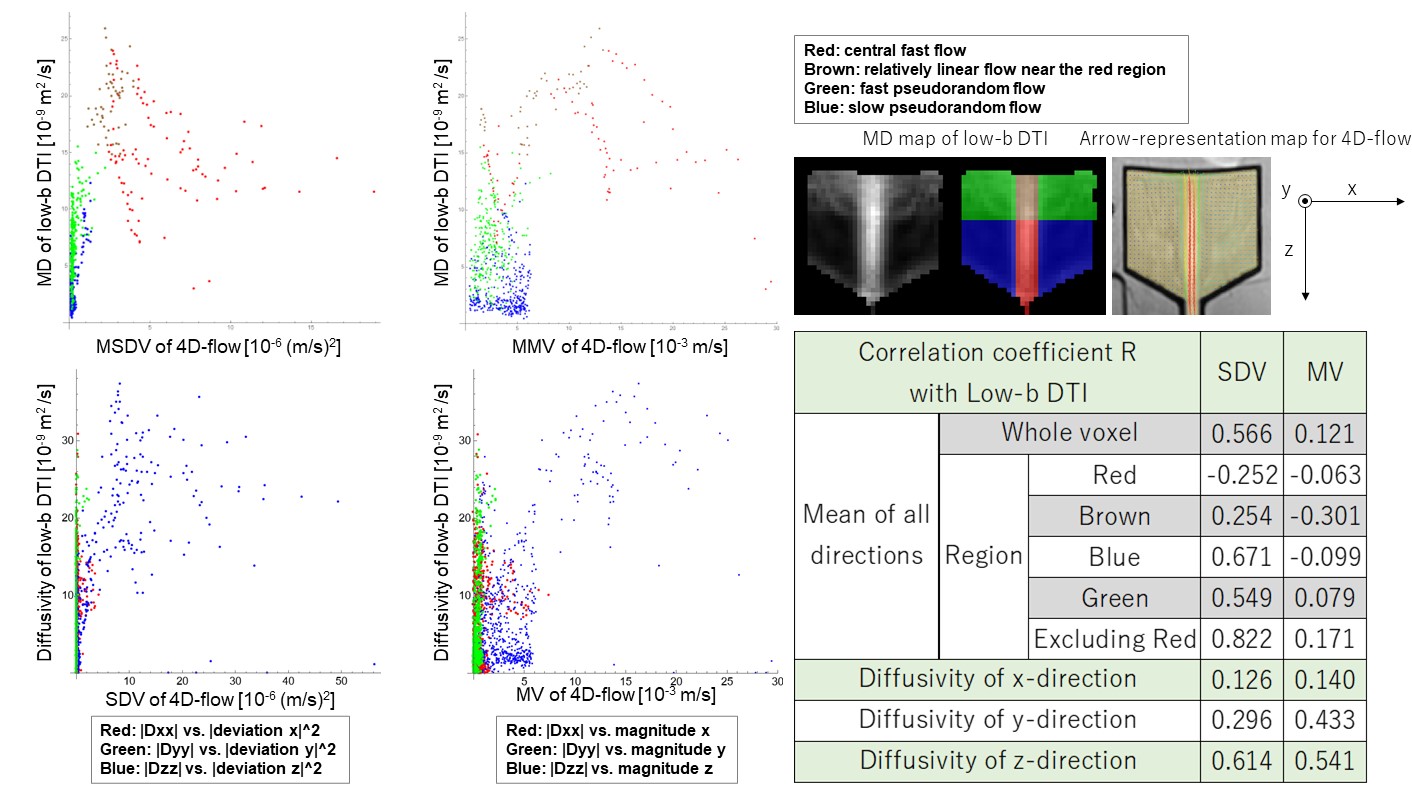
The abovementioned comparison was done for whole voxels in the axial slice. Besides, it was done for separated four regions in the coronal slice to investigate the effect of various flows; including non-laminar flow, contained in the slice. The four regions were visually divided with edges of the central stream and with a line thresholding MD outside of the central stream; Red: central fast flow, Brown: relatively linear flow near the red region, Green: fast pseudorandom flow, and Blue: slow pseudorandom flow (Fig. 3).
Results
For the axial section, MD and MSDV showed a strong correlation (r=0.716), which was stronger than the correlation between MD and MMV (r=0.609). For diffusivity and SDV in the x, y, and z directions, the correlation was stronger in the order of x-direction, y-direction, and z-direction (r=0.256, 0.520, and 0.775) (Fig.4).On the other hand, for the coronal section, a strong correlation was found for MD and MSDV but not for MD and MMV (r=0.566 and 0.121). In addition, the correlation between MD and MSDV was even stronger when the red region was excluded (r=0.822). For diffusivity and SDV in the x, y, and z directions, the correlation was stronger in the order of x-direction, y-direction, and z-direction (r=0.126, 0.296, and 0.614) (Fig.5).
Discussion
A strong correlation between MD and MSDV in both axial and coronal sections; for the latter, especially in the slow flow region, which is supported by the theory that these correlate in laminar flow [1,2].In addition, analyzing the x-, y-, and z-directions, strong correlations between diffusivity and SDV were also observed in the y- and z-directions for the axial section, where fast flow velocities account for only a small proportion. On the other hand, in the coronal section, which includes fast velocities in the z-direction, a strong correlation was demonstrated only in the z-direction. These correlations are considered to be influenced by the sufficient distribution of deviation of the velocity to calculate the correlation in each direction, the spatial resolution when differentiating the flow velocity measured by 4D-flow, and the flow velocity dispersion within voxels that cannot be measured by 4D-flow. Especially in the present b-value (b=100), it may depend on the error in the derivative value of the fast flow velocity component in the phantom and the large flow velocity dispersion in the voxel. Therefore, it is necessary to consider further appropriate b-values for analyzing slow flow velocities in each direction.
Conclusion
In the fluid phantom at a constant velocity, diffusivity of low-b DTI showed a strong correlation with SDV of 4D-flow, indicating that low-b DTI has the potential to evaluate slow flow such as CSF in vivo.Acknowledgements
No acknowledgement found.References
1. Bito Y, Harada K, Ochi H, et al. Low b-value diffusion tensor imaging for measuring pseudorandom flow of cerebrospinal fluid. Magn Reson Med. 2021 Sep;86(3):1369-1382.
2. Bito Y, Ochi H, Shirase R, et al. Low b-value Diffusion Tensor Imaging to Analyze the Dynamics of Cerebrospinal Fluid: Resolving Intravoxel Pseudorandom Motion into Ordered and Disordered Motions. Magn Reson Med Sci. 2023 Oct 27. Online ahead of print.
Figures