0586
FlowSim: a blood flow simulator for histology-informed diffusion MRI micro-vasculature mapping in cancer1Radiomics Group, Vall d’Hebron Institute of Oncology, Barcelona, Spain, 2Department of Biomedicine, Faculty of Medicine and Health Sciences, University of Barcelona, Barcelona, Spain, 3Molecular Oncology Group, Vall d’Hebron Institute of Oncology, Barcelona, Spain, 4Prostate Cancer Translational Research Group, Vall d’Hebron Institute of Oncology, Barcelona, Spain, 5Institut de Diagnòstic per la Imatge (IDI), Barcelona, Spain, 6Department of Radiology, Hospital Universitari Vall d’Hebron, Barcelona, Spain, 7GU, Sarcoma and Neuroncology Unit, Hospital Universitari Vall d’Hebron, Barcelona, Spain, 8Drug Development Unit, Vall d’Hebron Institute of Oncology, Vall d’Hebron Barcelona Hospital Campus, Barcelona, Spain, 9Biomarkers and Clonal dynamics group, Vall d’Hebron Institute of Oncology, Vall d’Hebron Barcelona Hospital Campus, Barcelona, Spain, 10Early Clinical Drug Development Group, Vall d’Hebron Institute of Oncology, Vall d’Hebron Barcelona Hospital Campus, Barcelona, Spain, 11Department of Biomedicine, Faculty of Medicine, Institute of Neurosciences, Institut d’Investigacions Biomèdiques August Pi i Sunyer (IDIBAPS), University of Barcelona, Barcelona, Spain, 12Centro de Investigación Biomédica en Red de Bioingeniería, Biomateriales y Nanomedicina (CIBER-BBN), Barcelona, Spain, 13Cardiff University Brain Research Imaging Centre (CUBRIC), School of Psychology, Cardiff University, Cardiff, United Kingdom, 14School of Computer Science and Informatics, Cardiff University, Cardiff, United Kingdom
Synopsis
Keywords: Simulation/Validation, Perfusion, cancer, IVIM, microvasculature
Motivation: Open-source software for simulating diffusion MRI (dMRI) signals arising from micro-vascular perfusion is needed to inform the development of new techniques for non-invasive vascular characterization.
Goal(s): To present FlowSim, a micro-vasculature perfusion dMRI signal simulator, demonstrating its utility for in vivo vascular property estimation.
Approach: FlowSim estimates blood velocities in all segments of custom vascular networks. These are used to calculate spin trajectories in the presence of arbitrary diffusion-encoding gradients.
Results: FlowSim synthesizes dMRI signals from realistic vascular networks reconstructed from histology. These can be used to inform the estimation of capillary blood velocity distributions in vivo, showcased herein in cancer.
Impact: We present FlowSim, a simulator of diffusion MRI (dMRI) signals arising from micro-vasculature perfusion. FlowSim synthesizes dMRI signals from realistic vascular networks reconstructed from histology, and informs the estimation of new microvasculature metrics in vivo, needed, for example, in cancer.
Introduction
The diffusion MRI (dMRI) signal is sensitive to intra-voxel incoherent motion (IVIM), which reflects micro-vascular perfusion within tissues1. To our knowledge, limited freely-available software exists for IVIM simulation, despite its potential utility in informing innovative micro-vasculature mapping strategies, sought, for example, in cancer research2. To address this need, we introduce FlowSim, an open-source Python simulator designed to synthesize dMRI signals arising from micro-vascular perfusion, demonstrating its utility for micro-vascular property estimation in vivo.Methods
Simulation frameworkFlowSim takes as input a vascular network of nodes in 3D space connected by pipes of specified radius, and solves for volumetric flow rates3 (VFR) via an electric-hydraulic analogy in PySpice4 (Fig.1). The VFR $$$q_{k,n}$$$ between each directly-connected pair of nodes (k,n) is linked to the pressure drop $$$Δp_{k,n}$$$ between them via3,5
$$$Δp_{k ,n} = q_{k,n} R_{k,n}.$$$
$$$R_{k,n}$$$ is the flow resistance, computed via a modified Hagen-Poiseuille law6
$$$R_{k,n}=\ 4\left[1-0.863e^{-r_{k,n}\over14.3µm}+27.5e^{-r_{k,n}\over0.351µm}\right]{8μL_{k,n}\over r_{k,n}^{4}π} $$$
accounting for hematocrit and blood cell-vessel interactions. Above, μ is the dynamic viscosity of pure plasma7 (μ=1.20 mPa s at 37ºC), and $$${r_{k,n}}/{L_{k,n}}$$$ capillary radius/length. The 3D trajectory of the w-th out of W uniformly-seeded spins $$$\mathbf{p}_w(t)$$$ is obtained by $$$v_w(t)={q_w(t)}/{πr_w^2(t)}$$$ as
$$$\mathbf{p}_w\left(t+Δt\right)=\mathbf{p}_w(t)+v_w(t)Δt\mathbf{n}_w(t).$$$
Above, $$$v_w(t)$$$ and $$$\mathbf{n}_w(t)$$$ are the instantaneous velocity and travel direction experienced by the spin at time t, ensuring mass conservation at junctions3. The dMRI signal for a gradient G(t) is finally obtained via ensemble averaging8
$$$s=\left\vert{\frac{1}{W}\sum_{w=1}^We^{-iγΔt\sum_{t=0}^T\mathbf{p}_w(t)·\mathbf{G}(t)}}\right\vert,$$$
given the simulation duration/resolution $$$T/Δt$$$.
Vascular networks
We showcase FlowSim on twelve 2D vascular networks drawn on digitized liver tumor biopsies (resolution: 0.454 µm) from an ongoing study, stained with hematoxylin-eosin (HE) or CD31 immunostaining, for vascular structures. Networks were drawn manually on normal-appearing (NA) liver and cancerous tissues (hepatocellular carcinoma (HCC), colorectal cancer (CRC) and melanoma). For each drawing, we obtained 100 network realizations by varying input velocity ([3.5; 8] mm/s) and inlet/outlet. We characterized networks by computing mean/standard deviation of velocity distributions (Vm/Vs).
In silico experiments
We used FlowSim to inform micro-vascular property estimation. Firstly, we generated signals for a protocol matching available in vivo scans, consisting of diffusion-weighted (DW) twice-refocused spin echo (TRSE) measurements (b = {0, 50, 100} s/mm2, 3 diffusion times; see Fig. 3 caption), and corrupted them with Rician noise (b = 0 signal-to-noise ratio: 20). Afterwards, we estimated (Vm, Vs) for each network using a forward signal model (Vm, Vs) ↦ s(Vm, Vs) learnt via radial-basis function regression on signals from all other networks. Density plots and correlation coefficients assessed agreement between ground-truth/estimated parameters.
In vivo experiments
We estimated Vm and Vs on a in vivo DW-TRSE scan performed on a patient (HCC; 65 years old male) with a 1.5T Siemens Avanto scanner for an ongoing study. The protocol matched that of simulations (see above), with additional b-values up to 1600 s/mm2. Three diffusion times were sampled by varying TE (TE = {93, 105, 120} ms; resolution: 1.9 × 1.9 × 6 mm3; TR = 7900 ms; effective NEX = 6). After routine pre-processing9,10, we normalised images to the b = 0 with matching TE, and estimated the pure vascular IVIM signal by extrapolating a high-b diffusion kurtosis11 fit. Finally, we fitted Vm and Vs , and characterized them within regions-of-interest (ROIs): two in the tumor; one in NA liver, kidney cortex/hilum, spleen.
Results
Figure 2 showcases two vascular networks, with velocity and VFR fields. A distribution of velocities arises across the network, leading to fast dMRI signal decay for an exemplificatory protocol. The signal, virtually undetectable for b ≈ 200 s/mm2, features diffusion-time dependence.Figure 3 illustrates the DW-TRSE sequence used in silico and in vivo, and in silico Vm and Vs estimation. Estimating Vm and Vs is feasible; estimated Vm and Vs correlate moderately with ground truth values.
Figure 4 shows in vivo Vm and Vs maps, while Table 1 reports per-ROI mean/standard deviations.
Between-tissue contrasts are compatible with known physiology. The highest Vm and Vs are seen for the NA liver, a well-perfused organ receiving on average 25% of the cardiac output12. Lower Vm and Vs are seen in the tumour (e.g., ROI 2, likely containing some necrosis). The kidney cortex exhibits lower Vm compared to the adjacent vessel-rich hilum, whose Vm and Vs are similar to the spleen.
Conclusions
FlowSim enables the synthesis of realistic DW signals arising from micro-vascular perfusion within user-defined vascular networks. Such simulations can contribute to the estimation of micro-vascular properties using dMRI, as demonstrated in cancer in vivo.Acknowledgements
RPL and FG are joint last (senior) and corresponding authors. The authors are thankful to Prof. Dmitry S. Novikov and Prof. Els Fieremans for useful discussion, and to the whole MRI radiology team and Siemens Healthineers for their support with in vivo diffusion imaging. This project received support from AstraZeneca (AZ); AZ was not involved in the acquisition and analysis of the data, interpretation of the results, or the decision to submit this abstract. RPL is supported by ”la Caixa” Foundation, a CRIS Foundation Talent Award (TALENT19-05), the FERO Foundation, the Instituto de Salud Carlos III-Investigación en Salud (PI18/01395 and PI21/01019) and the Prostate Cancer Foundation (18YOUN19). FG receives the support of a fellowship from ”la Caixa” Foundation (ID 100010434). The fellowship code is “LCF/BQ/PR22/11920010”, and the fellowship also supports AV. AG is supported by a Severo Ochoa PhD fellowship (PRE2022-102586). KB is funded by a Generalitat de Catalunya Beatriu de Pinós post-doctoral grant (2019 BP 00182). MP is supported by the UKRI Future Leaders Fellowship MR/T020296/2.
References
1. Le Bihan, D., Breton, E., Lallemand, D., Grenier, P., Cabanis, E., & Laval-Jeantet, M. (1986). MR imaging of intravoxel incoherent motions: Application to diffusion and perfusion in neurologic disorders. Radiology, 161(2), 401–407. https://doi.org/10.1148/radiology.161.2.3763909.2. Mayer, P., Fritz, F., Koell, M., Skornitzke, S., Bergmann, F., Gaida, M. M., al. & Stiller, W. (2021). Assessment of tissue perfusion of pancreatic cancer as potential imaging biomarker by means of Intravoxel incoherent motion MRI and CT perfusion: correlation with histological microvessel density as ground truth. Cancer Imaging, 21(1), 1-12. https://doi.org/10.1186/s40644-021-00382-x.
3. Van, V. P., Schmid, F., Spinner, G., Kozerke, S., & Federau, C. (2021). Simulation of intravoxel incoherent perfusion signal using a realistic capillary network of a mouse brain. NMR in Biomedicine, 34(7), e4528. https://doi.org/10.1002/nbm.4528.
4. Salvair, F. PySpice. Available at https://pyspice.fabrice-salvaire.fr.
5. Pries, A. R., Secomb, T. W, Gaehtgens, P., Gross, J. F. (1990). Blood flow in microvascular networks. Circulation research, 67(4):826-34. https://doi.org/10.1161/01.res.67.4.826.
6. Blinder, P., Tsai, P. S., Kaufhold, J. P., Knutsen, P. M., Suhl, H., & Kleinfeld, D. (2013). The cortical angiome: An interconnected vascular network with noncolumnar patterns of blood flow. Nature Neuroscience, 16(7), Article 7. https://doi.org/10.1038/nn.3426.
7. Késmárky, G., Kenyeres, P., Rábai, M., & Tóth, K. (2008). Plasma viscosity: A forgotten variable. Clinical Hemorheology and Microcirculation, 39(1–4), 243–246. https://doi.org/ 10.3233/ch-2008-1088.
8. Fieremans, E., & Lee, H.-H. (2018). Physical and numerical phantoms for the validation of brain microstructural MRI: A cookbook. NeuroImage, 182, 39–61. https://doi.org/10.1016/j.neuroimage.2018.06.046.
9. Veraart, J., Novikov, D. S., Christiaens, D., Ades-Aron, B., Sijbers, J., & Fieremans, E. (2016). Denoising of diffusion MRI using random matrix theory. NeuroImage, 142, 394–406. https://doi.org/10.1016/j.neuroimage.2016.08.016.
10. Kellner, E., Dhital, B., Kiselev, V. G., & Reisert, M. (2016). Gibbs-ringing artifact removal based on local subvoxel-shifts. Magnetic Resonance in Medicine, 76(5), 1574–1581. https://doi.org/10.1002/mrm.26054.
11. Jensen, J. H., Helpern, J. A., Ramani, A., Lu, H., & Kaczynski, K. (2005). Diffusional kurtosis imaging: the quantification of non‐gaussian water diffusion by means of magnetic resonance imaging. Magnetic Resonance in Medicine, 53(6), 1432-1440. https://doi.org/10.1002/mrm.20508.
12. Eipel, C., Abshagen, K., & Vollmar, B. (2010). Regulation of hepatic blood flow: The hepatic arterial buffer response revisited. World Journal of Gastroenterology : WJG, 16(48), 6046–6057. https://doi.org/10.3748/wjg.v16.i48.6046.
Figures
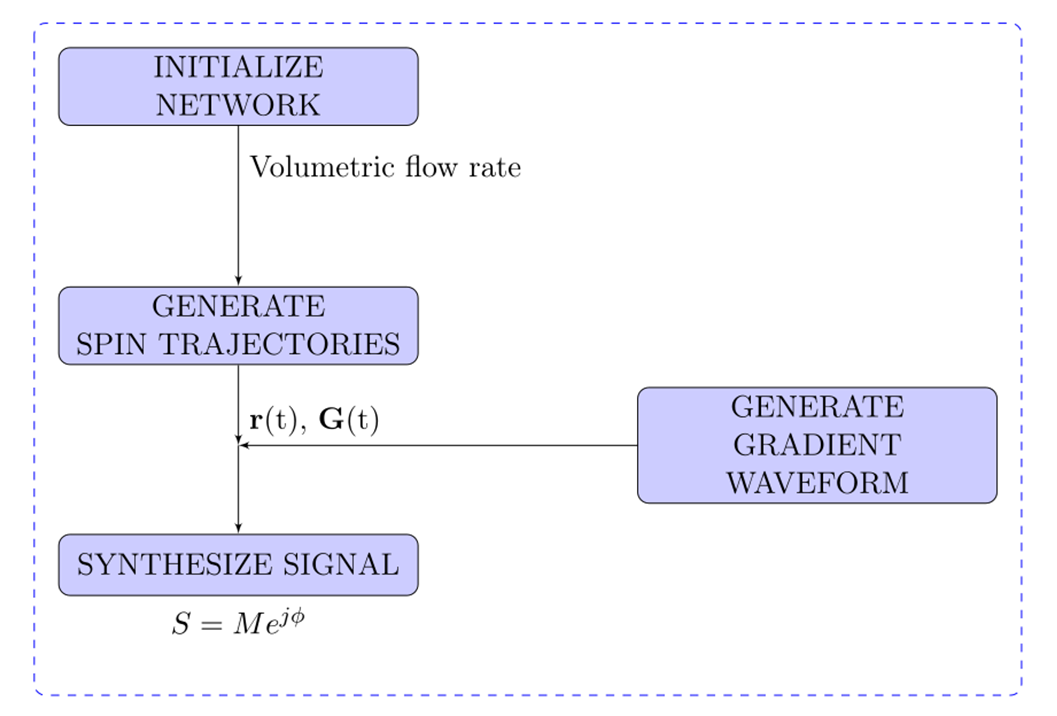
Figure 1 Block diagram illustrating the FlowSim dMRI flow simulator. FlowSim synthesizes IVIM signals by superimposing diffusion-encoding gradient waveforms to spin motion within input vascular networks extracted from histology. r(t) are the positions of blood spins in the network, while G(t) represents the diffusion-encoding gradient, part of a dMRI protocol.
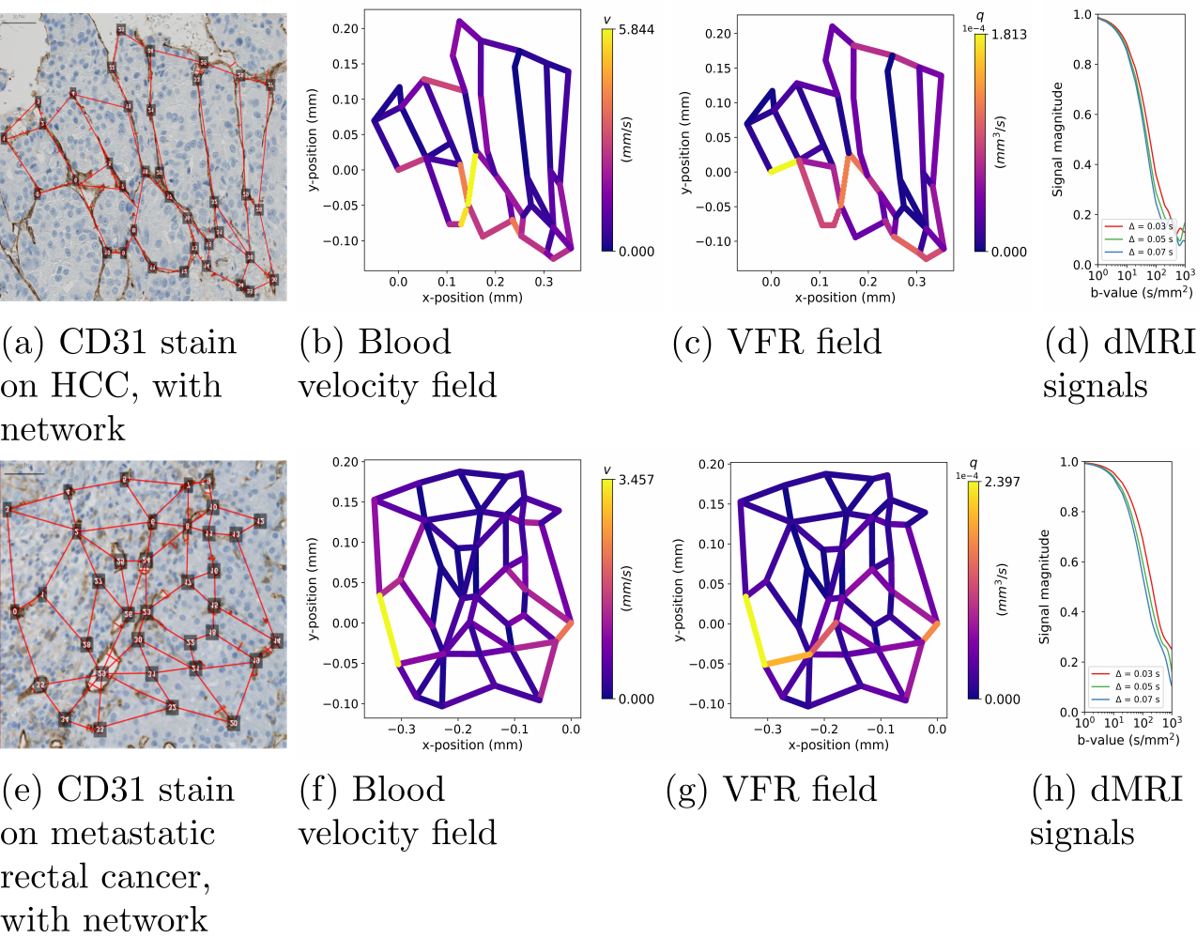
Figure 2 Examples of networks drawn on liver biopsies and resolved flow properties. Top ((a) to (d)): primary hepatocellular carcinoma. Bottom ((e) to (h)): rectal cancer metastasis. (a) and (e): endothelial cell marker immunostaining (CD31) and the segmented vascular network. (b) and (f): blood velocity field across capillary for an illustrative input velocity of vin = 4.5 mm/s; (c) and (g): blood volumetric flow rate field across capillaries (vin = 4.5 mm/s); (d) and (h): examples of magnitude signal attenuation for pulsed-gradient spin echo with δ = 20 ms and varying Δ and b-values.
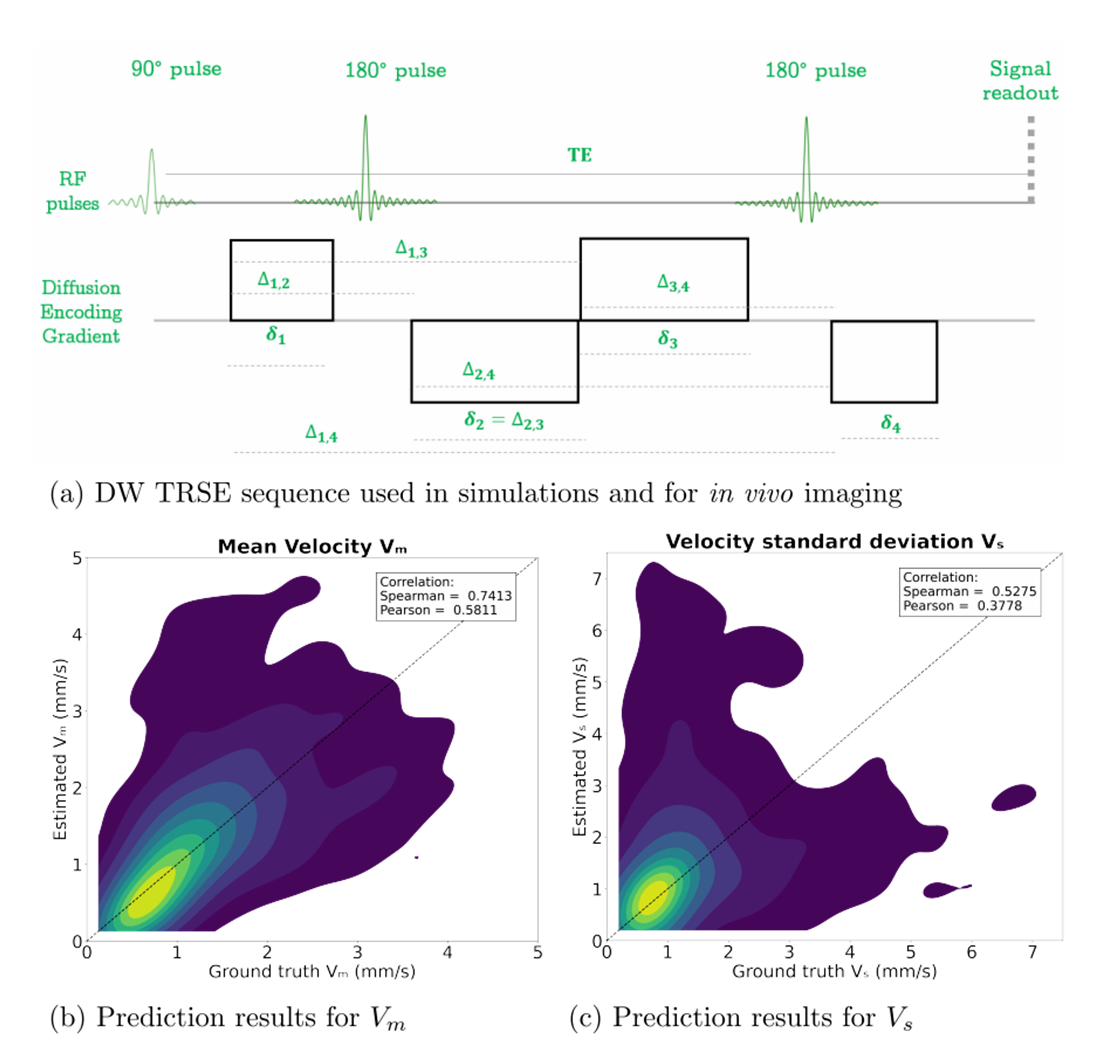
Figure 3 (a) DW twice-refocused spin echo pulse sequence used in simulations and in vivo. The protocol features b = {0, 50, 100} s/mm2 each acquired at 3 diffusion times (δ1 = 8.9 ms, δ2 = 17.6 ms, δ3 = 20.4 ms, δ4 = 6.0 ms, ∆1,2 = 17.4 ms and ∆1,4 = 63.9 ms at short diffusion time; δ1 = 13.2 ms, δ2 = 19.3 ms, δ3 = 24.8 ms, δ4 = 7.7 ms, ∆1,2 = 21.7 ms and ∆1,4 = 74.2 ms at intermediate diffusion time; δ1 = 18.9 ms, δ2 = 21.0 ms, δ3 = 30.5 ms, δ4 = 9.5 ms, ∆1,2 = 27.5 ms and ∆1,4 = 87.5 ms at long diffusion time). (b) and (c): scatter plots of ground-truth and estimated Vm(in (b)) and Vs (in (c)) with correlation coefficients.
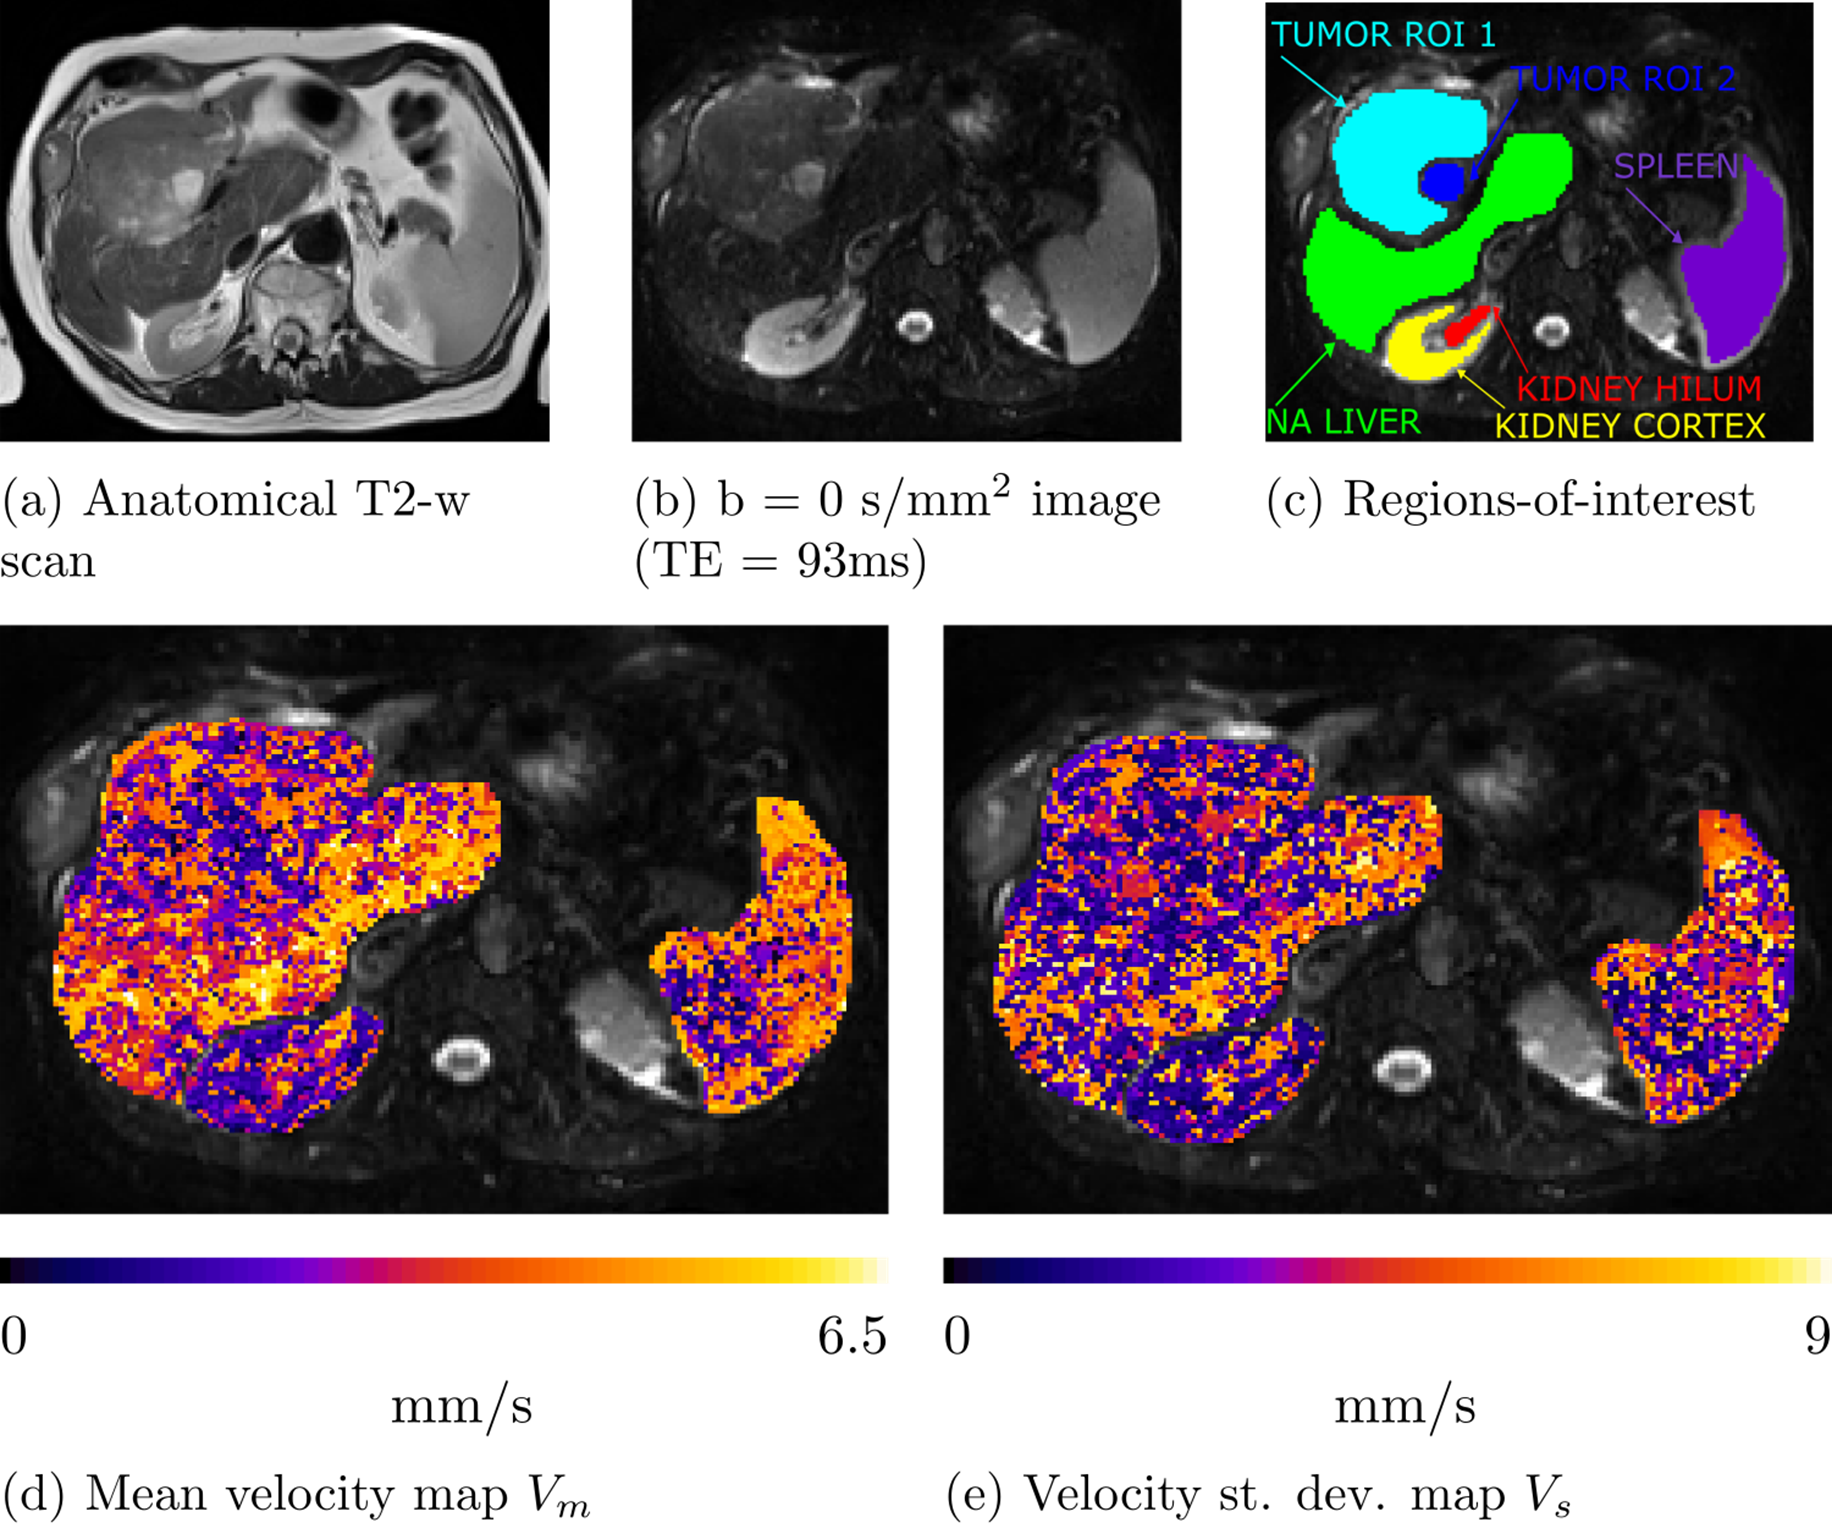
Figure 4 Example of micro-vasculature mapping informed by FlowSim simulations in an HCC patient scanned at 1.5T with a diffusion-weighted TRSE sequence, matching that of Figure 3.a used in simulations. (a): anatomical T2-weighted scan of the abdomen, showing the HCC. (b): illustrative b = 0 s/mm2 at the same anatomical location as (a); (c); locations of the ROIs, namely Kidney Hilum (red) and cortex (yellow), spleen (violet), NA Liver (green), and two ROIs in the HCC tumor (ROI1 in light blue, ROI2 in darker blue). (d): Mean velocity map Vm; (e): Velocity standard deviation map Vs.
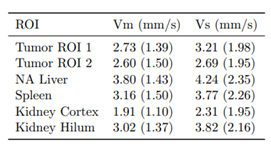
Table 1 Mean and standard deviation (within brackets) of in vivo mean velocity Vm and velocity standard deviation Vs maps obtained on a hepatocellular carcinoma patient in 6 different ROIs (two in the tumor; one in the NA liver, spleen, kidney cortex, and kidney hilum).