0581
Using Aleatoric Uncertainty to Aid Deep Learning based T1rho Mapping and Analysis in the Liver1Department of Imaging and Interventional Radiology, The Chinese University of Hong Kong, Shatin, Hong Kong, 2CUHK Lab of AI in Radiology, Shatin, Hong Kong, 3Department of Medicine and Therapeutics, The Chinese University of Hong Kong, Shatin, Hong Kong, 4Philips Healthcare, Shatin, Hong Kong
Synopsis
Keywords: Quantitative Imaging, Liver
Motivation: The utility of uncertainty to ensure a reliable learning-based parametric mapping in quantitative MRI is underexplored.
Goal(s): This study aimed to develop a reliable method for quantitative T1rho mapping of liver using uncertainty-based deep learning.
Approach: We proposed a parametric map refinement approach that trained the model probabilistically to estimate uncertainty in predicted T1rho values. The uncertainty map was used to enhance mapping performance and identify unreliable values in the region of interest.
Results: Testing on 51 patients with liver fibrosis showed a mapping error of less than 3% and simultaneous uncertainty estimation.
Impact: Our work demonstrates potential of saving scan time while preserving T1rho quantification accuracy. It is also shown that incorporating uncertainty estimation in the T1rho mapping network can improve the reliability of predicted values.
Introduction
While the learning-based parametric mapping in quantitative MRI (qMRI) has been extensively studied [1-3], the utility of uncertainty in this task remains underexplored. In this work, we reported a deep learning-based framework for liver T1rho mapping with uncertainty estimation to provide a direct estimation of the confidence level of T1rho quantification. Furthermore, we investigated the use of uncertainty to improve the reliability of T1rho mapping of the liver with reduced number of T1rho-weighted images (contrasts) for fitting.Methods
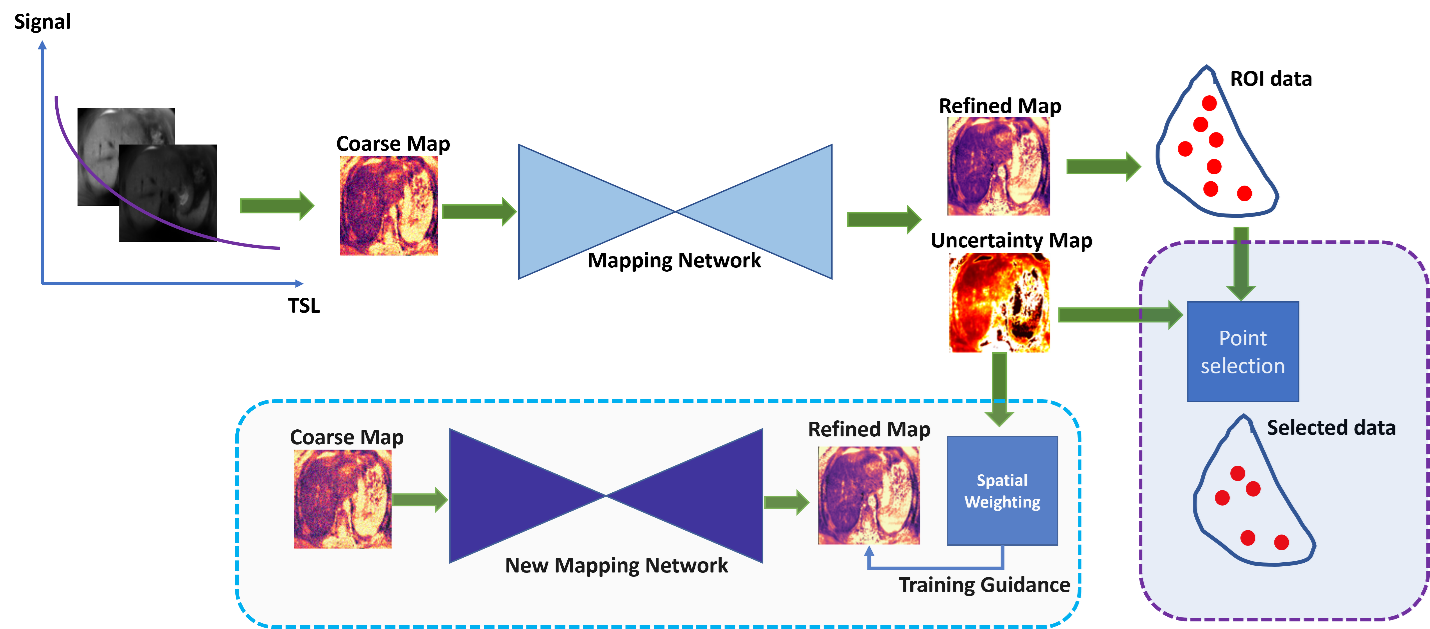
The proposed processing pipeline is shown in Figure 1. The framework takes two contrasts as input and generates both the T1rho map and the uncertainty map. The uncertainty map can be used to refine a user-defined ROI to improve the accuracy of the mean T1rho value within the ROI by discarding pixels where T1rho quantification is unreliable. The uncertainty map is also further processed and leveraged to train an improved network to improve T1rho mapping accuracy.Training of mapping network:
The training of the mapping network follows the method of minimizing the negative log likelihood[4], which follows the loss function below:
$$L = \logΠ^Z_{i=1}\frac{\exp(-|\hat{M_i}-M_i|/\sigma_i)}{2\sigma_i}\propto∑^Z_{i=1}(\frac{|\hat{M_i}-M_i|}{\sigma_i}+\log(\sigma_i))$$
$$$\sigma$$$ is the uncertainty term. $$$\hat{M}$$$ and $$$M$$$ are the ground-truth and the predicted T1rho map. The ground-truth map is fitted by using four contrasts. $$$Z$$$ stands for the number of pixels in a slice and $$$i$$$ is the index. Note the value of the ground-truth map is cut off at a range from 25 ms to 65 ms.
Uncertainty aided improved network:
We convert the uncertainty map into a spatial weighting map to train a new network. Intuitively, the network should prioritize areas with low uncertainty. Noted that the areas with cut off values typically have low uncertainty, while they are typically not the region of interests. To address this issue, we assign the largest uncertainty value in the uncertainty map to those areas which satisfy the following conditions: 1) having extremely low uncertainty (below a certain threshold) in the uncertainty map and 2) having the cut off values in the target T1rho map. The spatial weighting map $$$S$$$ is then applied to the following loss function so that useful areas with low uncertainty are prioritized.
$$L = Σ^Z_{i=1}exp(-S_i)|\hat{M_i}-M_i|$$
Uncertainty-aided ROI refinement:
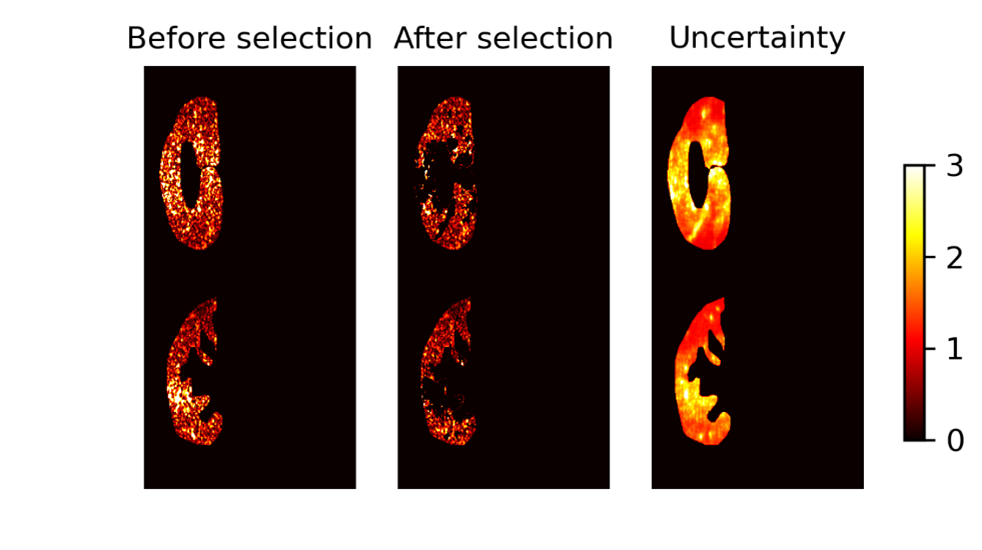
In our framework, ROIs are firstly obtained on the anatomical image. The uncertainty threshold is computed in the validation set and is determined by taking the mean uncertainty value of all pixels in all ROIs and added with the corresponding standard deviation of the uncertainty values in the ROIs, denoted as $$$\mu_{uncer} + std_{uncer}$$$. During inference, those pixels with uncertainty values larger than the threshold are discarded.
Evaluation metric:
We define the ROI mean relative error (RMRE) as:
$$RMRE = \frac{1}{Z}Σ^Z_{z=1}\frac{1}{N}Σ^N_{n=1}\frac{|T1rho_n-\hat{T1rho_n}|}{\hat{T1rho_n}}\times 100\%$$
$$$N$$$ is the number of pixels within the ROI. $$$T1rho_n$$$ and $$$\hat{T1rho_n}$$$ are the predicted value and the target value of a pixel respectively.
Results
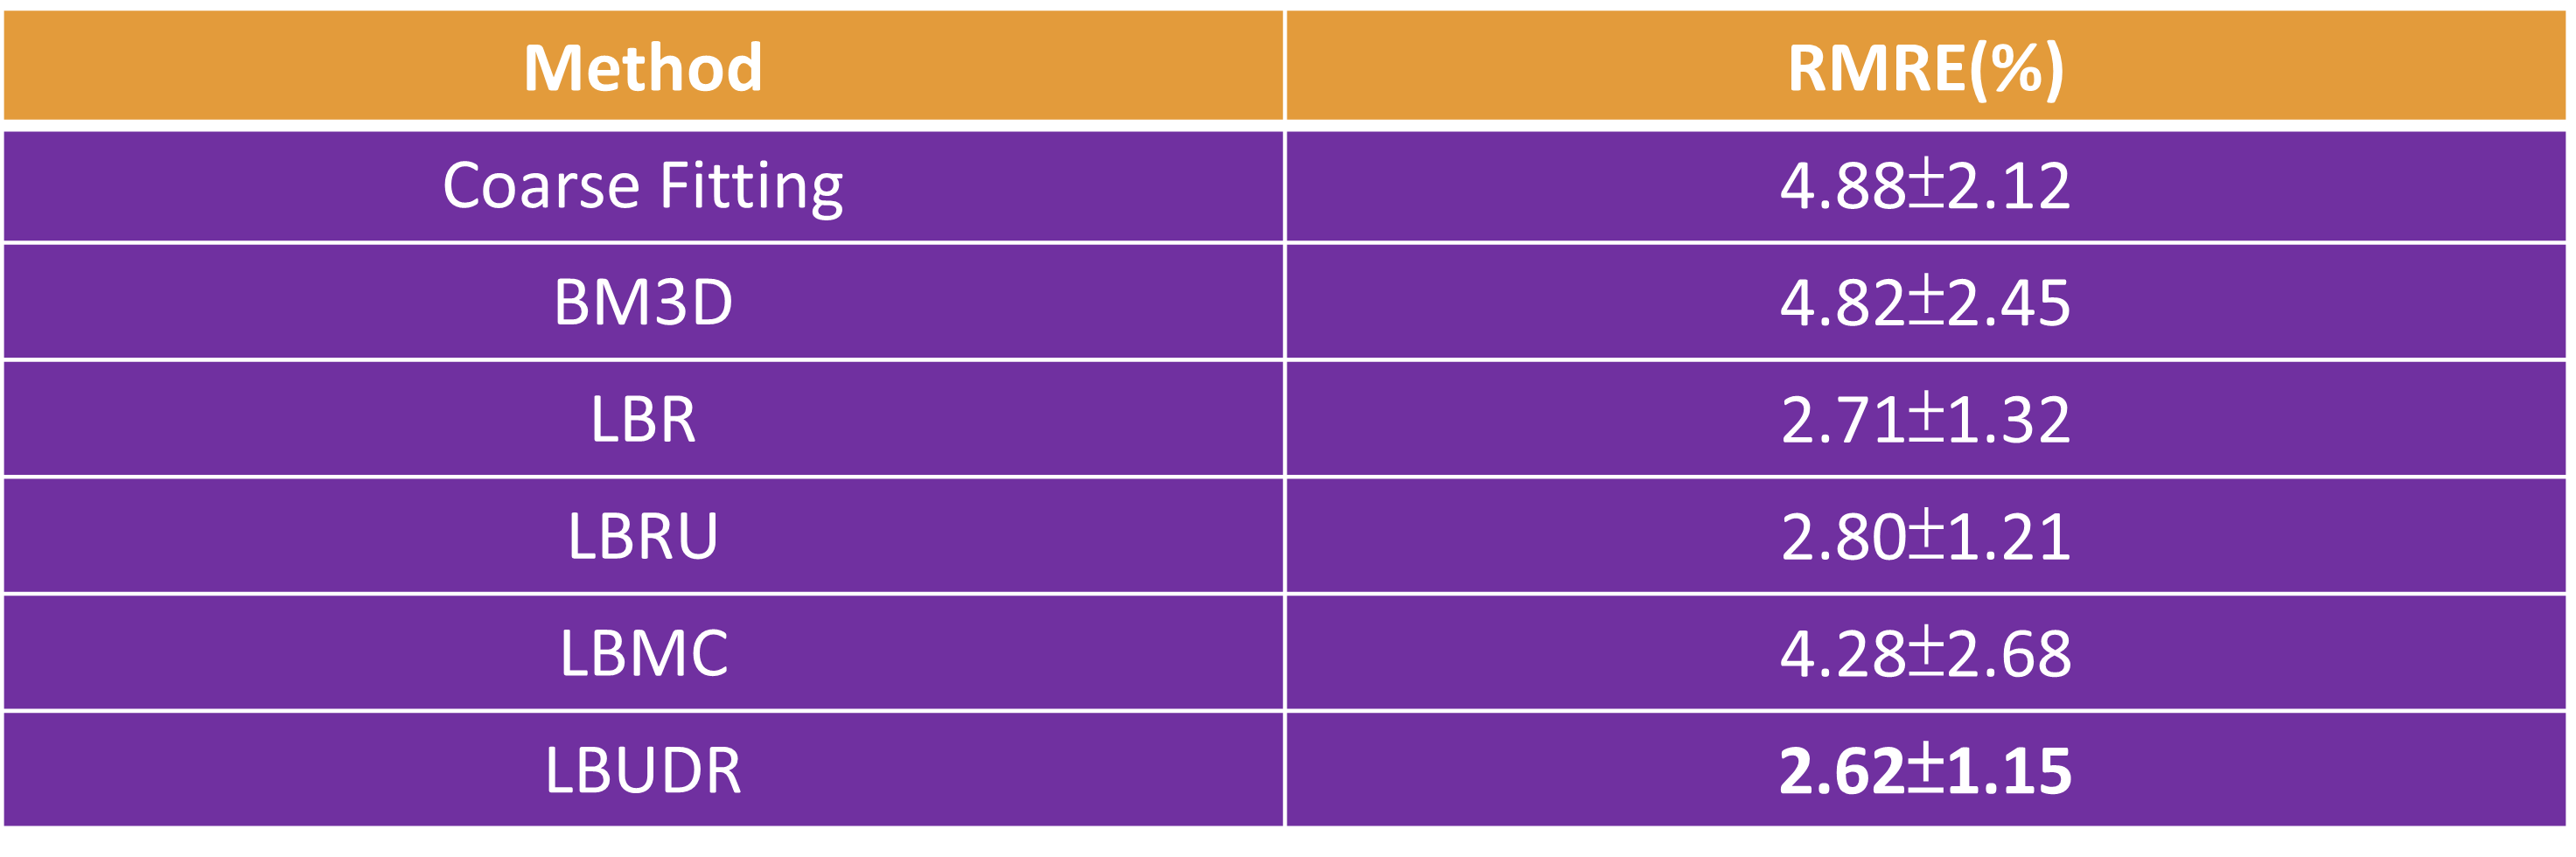
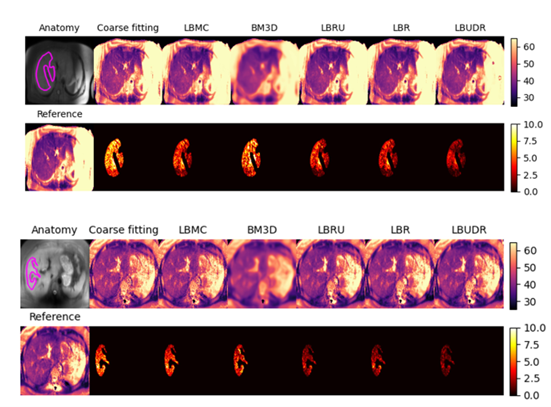
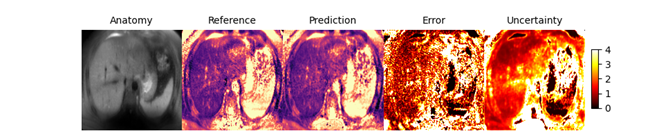
We compare the results of the following models on a dataset with 51 patients with early stage of liver fibrosis (F0 to F2): least-square fitting from two contrasts (Coarse fitting), BM3D[5], learning based refinement without and with uncertainty (LBR and LBRU), learning based mapping from T1rho contrasts (LBMC) and learning based uncertainty driven refinement (LBUDR, the proposed uncertainty aided improved network). The result is shown in Table 1 and Figure 2. By using the uncertainty aided method, the proposed LBUDR achieved the best performance (2.60%). Figure 3 and Figure 4 show the uncertainty maps and the refined ROI by using the uncertainty for pixel selection. Areas with relatively high absolute error are spatially associated with relatively high uncertainty values.Discussions
Our study demonstrates potential of saving scan time while preserving quantification accuracy and the incorporated uncertainty estimation in the T1rho mapping network can improve the reliability of predicted values. The estimated uncertainty map from the network has potential post-hoc applications, such as ROI refinement and providing spatial weighting to train models to further improve T1rho mapping. Regarding the limitation, we studied liver disease of early-stage liver fibrosis, which has a relatively homogeneous structure and relatively insignificant alterations of relaxation rates. Anatomies like brain and knee have more complicated structures. Further investigation is needed to extend the proposed methods for applications in other liver diseases and other anatomies.Conclusion
Our proposed method can generate both refined parametric maps and corresponding estimation of uncertainty levels using only two contrasts. We demonstrated the estimated uncertainty map can be used for ROI refinement in the liver and as spatial weighting to further improve the accuracy of T1rho quantification of the liver.Acknowledgements
This study was supported by a grant from the Research Grants Council of the Hong Kong SAR (Project GRF 14201721), a grant from the Innovation and Technology Commission of the Hong Kong SAR (Project No.MRP/046/20x).References
[1] Feng, L., Ma, D., & Liu, F. (2022). Rapid MR relaxometry using deep learning: An overview of current techniques and emerging trends. NMR in Biomedicine, 35(4), e4416.
[2] Zhu, Y., Cheng, J., Cui, Z. X., Zhu, Q., Ying, L., & Liang, D. (2023). Physics-Driven Deep Learning Methods for Fast Quantitative Magnetic Resonance Imaging: Performance improvements through integration with deep neural networks. IEEE Signal Processing Magazine, 40(2), 116-128.
[3] Shafieizargar, B., Byanju, R., Sijbers, J., Klein, S., den Dekker, A. J., & Poot, D. H. (2023). Systematic review of reconstruction techniques for accelerated quantitative MRI. Magnetic Resonance in Medicine.
[4] Kendall, A., & Gal, Y. (2017). What uncertainties do we need in bayesian deep learning for computer vision?. Advances in neural information processing systems, 30.
[5] Dabov, K., Foi, A., Katkovnik, V., & Egiazarian, K. (2007). Image denoising by sparse 3-D transform-domain collaborative filtering. IEEE Transactions on image processing, 16(8), 2080-2095.
Figures