0579
Multinuclear fingerprinting (MNF): high-resolution simultaneous proton/sodium MR fingerprinting
1NMR Signal Enhancement, Max Planck Institute for Multidisciplinary Sciences, Göttingen, Germany, 2Department of Radiology, New York University School of Medicine, New York, NY, United States, 3Vilcek Institute of Graduate Biomedical Sciences, NYU Langone Health, New York, NY, United States, 4Departement of Medicine, University of Hawaii, Honolulu, HI, United States, 5Centre for Advanced Imaging, The University of Queensland, Brisbane, Brisbane, Australia
Synopsis
Keywords: MR Fingerprinting, Brain, 23Na, 1H
Motivation: Develop a method for high-resolution multinuclear fingerprinting (MNF).
Goal(s): Generate high-resolution multi-parametric maps of proton and sodium nuclei.
Approach: The method consists of two steps:
1- Simultaneous acquisition of 1H/23Na MR fingerprinting (MRF) data resulting in high-resolution 1H maps and low-resolution 23Na maps
2- Application of a super-resolution algorithm to match the in-plane resolution of 23Na maps to the in-plane high-resolution of the 1H maps.
Results: Multinuclear fingerprinting (MNF) can generate high-resolution 1H density, T1, and T2 maps and 23Na density, T1, T2long, and T2short maps in brain from simultaneous 1H/23Na MRF data acquired at 7 T in 21 min.
Impact: This method provides a novel approach towards the investigation of sodium maps as biomarkers for neurological diseases.
Introduction
Sodium (23Na) MRI has potential to reveal valuable metabolic information1. However, due to their low-resolution, 23Na images are usually paired with high-resolution proton (1H) MRI to reveal the underlying morphology. In this work, we present an extension of our multinuclear fingerprinting (MNF) method2. In addition to high-resolution 1H density, T1, and T2 maps, our upgraded MNF implementation also produces high-resolution 23Na density, T1, T2long, and T2short maps, all acquired simultaneously in a single scan. The method consists of two steps: (1) simultaneous acquisition of 1H/23Na MR fingerprinting (MRF) data resulting in high-resolution (HR) 1H maps and low-resolution (LR) 23Na maps2 (1H and 23Na maps have therefore different in-plane resolution based on the respective gyromagnetic ratios but the same slice thickness); (2) application of a super-resolution algorithm to match the in-plane resolution of 23Na maps to the in-plane HR resolution of the 1H maps3.Methods
We modified our simultaneous 3D 1H MRF/23Na MRI2 sequence into a simultaneous 3D 1H/23Na MRF acquisition. The nuclear spins are sequentially excited every TR (7.5ms) for 1H and every 2TRs (15ms) for 23Na using non-selective pulses followed by one simultaneous readout for both nuclei. The partition phase-encoding gradient moments were distributed such that images from both nuclei had the same slice thickness. The frequency-encoding gradient moments were distributed such that a full radial trajectory for 1H and a center-out radial trajectory for 23Na were obtained in k-space, leading to a ratio of ~1.9 in-plane resolution between the 1H and 23Na images2.The 23Na flip angle (FA) train is made up of 22 pulses applied 4 times per shot. The 22 angles were optimized by a genetic algorithm to minimize the Pearson correlation4 coefficient between signals of gray and white matter based on the simulated signal evolution for sodium nuclear spins5. Modeling of the dynamics of the sodium spin 3/2 under the 22-pulse train was performed using the irreducible spherical tensor operator formalism in MATLAB5. Details about the proton FA train can be found in Yu et al.2. A diagram of the sequence is shown in Fig.1.
The 3D simultaneous 1H/23Na MRF sequence parameters were: FOV 240×240×168mm3, 1H 160×160/23Na 84×84 matrix, 1H 1.5×1.5mm2/23Na 2.85×2.85mm2 in-plane resolution, 1H TR=7.5ms/23Na TR=15ms, 1H TE=2ms/23Na TE=1.2ms, 1 slab of 56 slices, 5mm sagittal slice thickness for both 1H and 23Na, 3 shots per slab, 2 acquisitions, total scan time 21min.
The scans were performed at 7T (MAGNETOM, Siemens) using an 8-channel-1H/8-channel-23Na Tx/Rx head coil6 developed in-house. The images were reconstructed and processed offline in MATLAB. The full-radial proton data and center-out sodium data were processed separately.
For proton MRF, images were reconstructed with CG-SENSE7 to reduce the radial artifacts8.
For sodium MRF, images were reconstructed with compressed-sensing using Total-Generalized-Variation regularization9. The brain was segmented into two compartments (“tissue” and “CSF”) using the proton T1=2100 s as a threshold and independent matching strategies were implemented for each compartment. For “CSF”, the following matching constrains were implemented T1∈[49-74]ms, T2long∈[42-74]ms and T2short=T2long. For “tissue”, T1∈[20-48]ms, T2long∈[10-40]ms and T2short∈[0.5-20]ms. The final sodium maps were obtained using a correlation coefficient-weighted average over the best 50 maps for “CSF” and over the best 500 for “tissue”. Finally, a partial-least-square (PLS) super-resolution algorithm3 was adapted to match the sodium maps in-plane resolution with the proton maps resolution. Fig.2 shows a schematic of the pipeline of the MNF method.
The method was first validated in phantoms and then tested on seven volunteers (4 female, mean age=27±3 years) after informed consent, in accordance with the relevant institutional and national guidelines. The CSF, gray matter and white matter masks were created with SPM10, and the mean values and standard deviations of the 1H and 23Na different metrics were calculated for each compartment.
Results & Discussion
Fig. 3 shows the final HR 1H/23Na 3D maps obtained from MNF from one healthy subject. Table 1 and 2 show the measurements for CSF, gray matter and white matter from the sodium and proton maps respectively.The proton results are consistent with the results from our previous 3D 1H MNF/23Na MRI method11.
The T2long, and T2short slightly differ for the CSF because the mask used for quantification is different than the one used in the dictionary matching. The sodium results obtained for the brain agree with the ranges of values reported in the literature12,13,14.
Conclusion
We presented a MNF method that can generate high-resolution 1H density, T1, and T2 maps and 23Na density, T1, T2long, and T2short maps from simultaneous 1H/23Na MRF acquisition and super-resolution post-processing.Acknowledgements
The research reported in this publication was supported by the NIH/NIBIB grant R01EB026456, and performed under the rubric of the Center for Advanced Imaging Innovation and Research, a NIBIB Biomedical Technology Resource Center (P41EB017183).References
1. Madelin G, & Regatte R R. Biomedical applications of sodium MRI in vivo. J. Magn. Reson. Imag., 2013;38:511-529.
2. Yu, Z., Hodono, S., Dergachyova, O., Hilbert, T., Wang, B., Zhang B., Sodickson, D. K., Madelin, G., & Cloos, M. A. Simultaneous 3D acquisition of 1H MRF and 23Na MRI. Mag. Res. in Med., 2021, 83(6), 00:1-14.
3. Rodriguez, G.G., Yu, Z., L., Shaykevich, O'Donnell, L., Calderon , S., Cloos, M. A., & Madelin, G., Super-resolution of sodium images from simultaneous 1H MRF/23Na MRI acquisition. NMR Biomed. 2023, e4959.
4. Saidi R., Bouaguel W., Essoussi N. Hybrid Feature Selection Method Based on the Genetic Algorithm and Pearson Correlation Coefficient: 3–24. Cham: Springer International Publishing, 2019.
5. O'Donnell, L., Rodriguez, G.G., Lemberskiy G., Yu, Z., Dergachyova, O., S., Cloos, M. A., & Madelin, G. N. Mapping sodium relaxation parameters in brain using magnetic resonance fingerprinting at 7T. Proceeding of Annual meeting of the ISMRM 2023, #3306.
6. Wang, B, Zhang, B., Yu, Z., Ianniello C., Lakshmanan K., Paska, J., Madelin, G., Cloos, M. & Brown, R.. A radially interleaved sodium and proton coil array for brain MRI at 7T. NMR Biomed. 2021, e4608.
7. Pruessmann, K. P., Weiger, M., Börnert, P. & Boesiger, P. Advances in sensitivity encoding with arbitrary k-space trajectories. Magn. Reson. Med. 46, 638–651 (2001).
8. Kara, D. et al. Parameter map error due to normal noise and aliasing artifacts in MR fingerprinting. Magn. Reson. Med. 81, 3108–3123 (2019).
9. Knoll F., Bredies K., Pock T., Stollberger R.. Second Order Total Generalized Variation (TGV) for MRI. Mag. Res. in Med., 2011, 65:480–491.
10. Ashburner, J. et al. SPM12 Manual. The FIL Methods Group (and honorary members), 2015.
11. Rodriguez, G.G., Yu, Z., O'Donnell, L., Calderon, S., Cloos, M. A., & Madelin, G., Repeatability of simultaneous 3D 1H MRF/23Na MRI in brain at 7 T. Sci. Rep. 2022, 14156.
12. Kratzer F., et al. 3D sodium (23Na) magnetic resonance fingerprinting for time-efficient relaxometric mapping. Magn. Res. in Med. 2021, 86(5):2412-2425.
13. 5- Niesporek S., et al. Improved T∗2 determination in 23Na, 35Cl, and 17O MRI using iterative partial volume correction based on 1H MRI segmentation. MAGMA. 2017, 30(6):519–536.
14. 4- Blunck Y., et al. 3D-multi-echo radial imaging of 23Na (3D-MERINA) for time-efficient multi-parameter tissue compartment mapping. Magn. Res. in Med. 2018, 79(4):1950-1961.
Figures
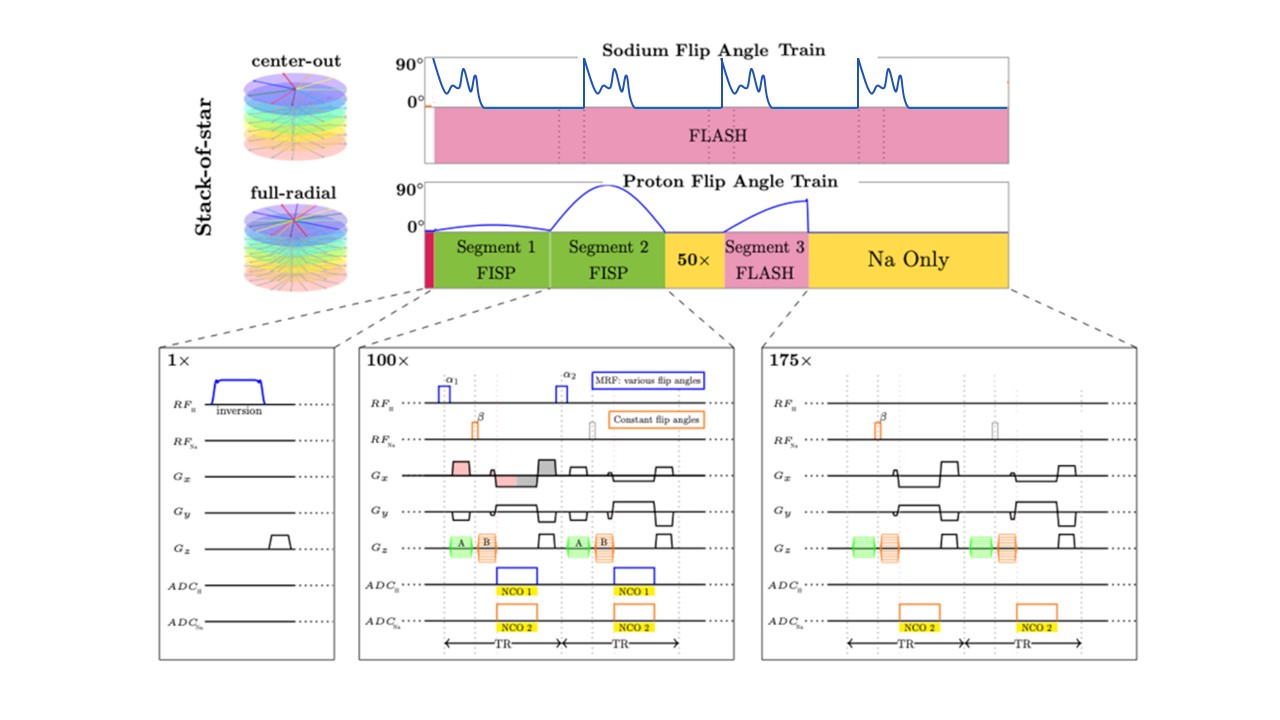
Figure 1: Diagram of the 3D simultaneous 1H/23Na MRF sequence. The diagram on top shows the sodium excitations with flip angles (in degrees): 90, 90, 39, 32, 35, 38, 35, 49, 42, 52, 62, 45, 61, 63, 60, 55, 52, 53, 30, 27, 27, 28, and the proton MRF pulse train with variable flip angles. The details of the sequence for different segments are shown in the corresponding boxes on the bottom.
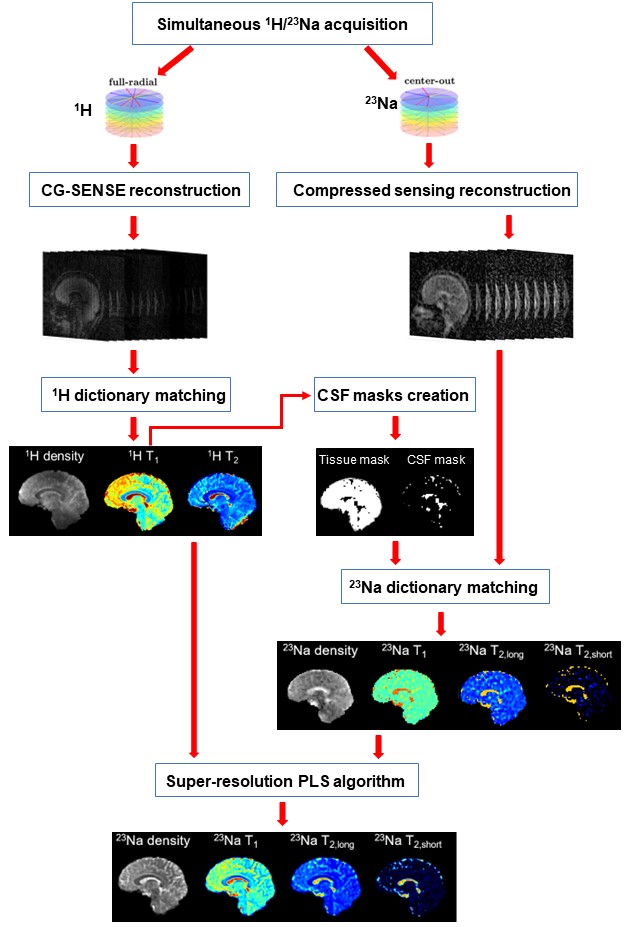
Figure 2: Block diagram of the pipeline of the simultaneous MNF method. The proton and sodium data are acquired simultaneously and reconstructed individually. The proton T1 map is used to generate “CSF” and “tissue” masks and individual matchings are implemented to each compartment. The LR sodium maps and the HR proton maps are the inputs of the super-resolution PLS algorithm, generating HR sodium maps as output.
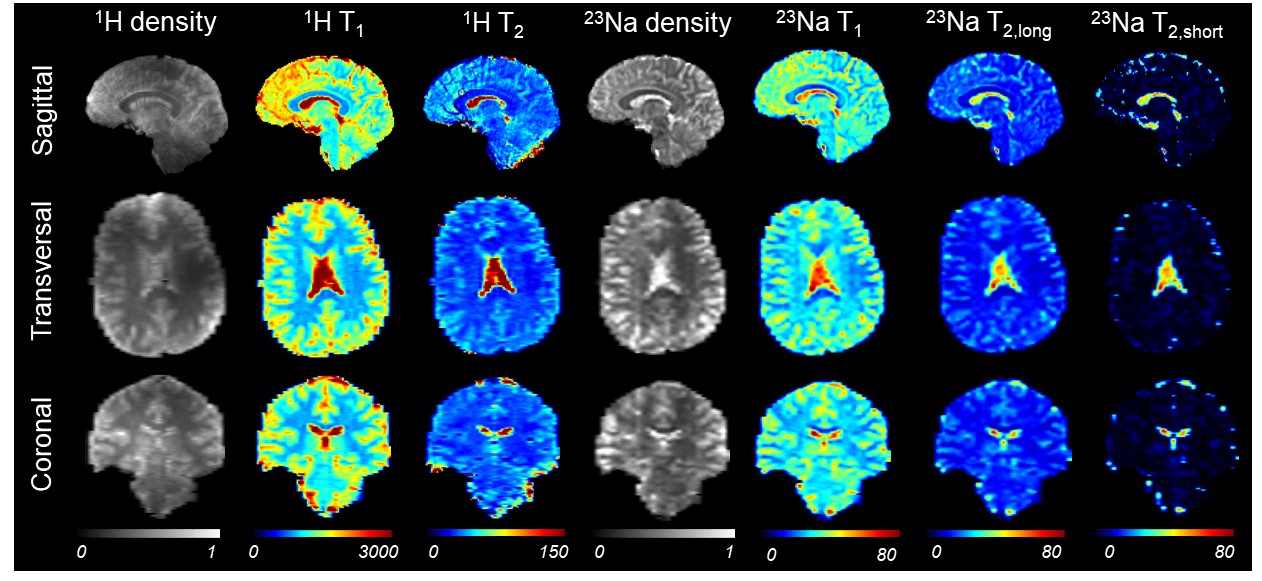
Figure 3: 3D HR 1H/23Na maps from MNF. The proton density (PD), and the proton relaxation maps were obtained directly from the dictionary matching. The sagittal sodium density and sodium relaxation maps are the outputs of the super-resolution algorithm. The in-plane resolution of the proton and sodium images is 1.5´1.5 mm2 (sagittal), with slice thickness of 5 mm for all images.
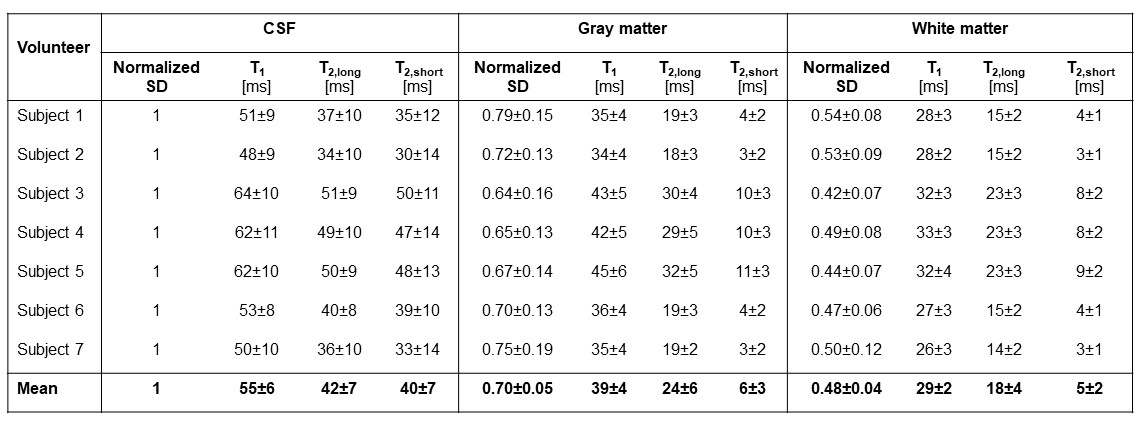
Table 1: Sodium MNF results in CSF, gray matter, and white matter for each subject. The values are represented as mean ± standard deviation. The sodium density (SD) values were normalized by the mean value of the CSF. The tissue segmentation was obtained from SPM10.
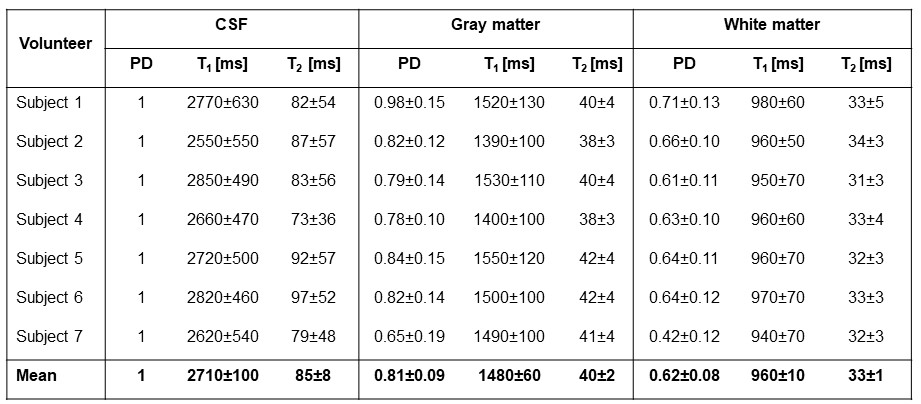
Table 2: Proton MNF results in CSF, gray matter, and white matter for each subject. The values are represented as mean ± standard deviation. The proton density (PD) values were normalized by the mean value of the CSF. The tissue segmentation was obtained from SPM10.