0577
Cardiac Magnetic Resonance Fingerprinting for Simultaneous T1 and T2 Mapping at 0.55T1King's College London, London, United Kingdom, 2Intitute for Biological and Medical Engineering, Pontificia Universidad Católica de Chile, Santiago, Chile, 3Millennium Institute for Intelligent Healthcare Engineering, Pontificia Universidad Católica de Chile, Santiago, Chile, 4MR Research Collaborations, Siemens Healthcare Limited, Camberley, United Kingdom, 5Insititute for Biological and Medical Engineering, Pontificia Universidad Catolica de Chile, Santiago, Chile, 6Electrical Engineering Department, Pontificia Universidad Católica de Chile, Santiago, Chile, 7School of Engineering, Pontificia Universidad Católica de Chile, Santiago, Chile, 8Hans Fischer Senior Fellow Award, Institute for Advanced Study at Technical University of Munich, Munich, Germany
Synopsis
Keywords: MR Fingerprinting, Cancer
Motivation: Cardiac MRF (cMRF) allows for comprehensive myocardial tissue characterization in a single scan and has been investigated at 1.5T/3T. However, cMRF has not been demonstrated at low-field.
Goal(s): Investigate the feasibility of a bSSFP-cMRF sequence for simultaneous T1 and T2 mapping at 0.55T.
Approach: The proposed approach considers bSSFP radial readouts with varying IR and T2-preparation pulses over 16 heartbeats. bSSFP-cMRF was evaluated in phantoms and healthy subjects in comparison to reference maps.
Results: bSSFP-cMRF at 0.55T shows excellent agreement with reference values in phantom and good image quality in healthy subjects with T1 and T2 values agreeing with the literature.
Impact: The simultaneous quantification of T1 and T2 at 0.55T in a single cardiac-MRF scan of 16s could provide an alternative to higher field scanners, allowing for a more accessible way to assess cardiovascular disease.
Introduction
Myocardial T1 and T2 mapping has emerged as a useful clinical tool for the detection of cardiovascular disease. Conventional myocardial maps are acquired in sequential breath-hold scans. Cardiac Magnetic Resonance Fingerprinting (MRF) has shown promising results for simultaneous T1 and T2 parametric mapping in a single scan [1] [2] and has been demonstrated at conventional field strengths of 1.5T and 3T. The recent introduction of high-end low-field 0.55T scanners could greatly increase the accessibility and affordability of this type of technique [3] [4] [5]. Furthermore, lower T1 relaxation times, reduced SAR, and fewer B0/B1 inhomogeneities make low-field MRI an attractive alternative for MRF. Brain [6] and liver [7] MRF have been demonstrated at 0.55T. However, the feasibility of cardiac MRF at 0.55T still needs to be proven. Here we demonstrate 2D T1 and T2 cardiac MRF at 0.55T and evaluate its performance in phantom and healthy subjects.Methods
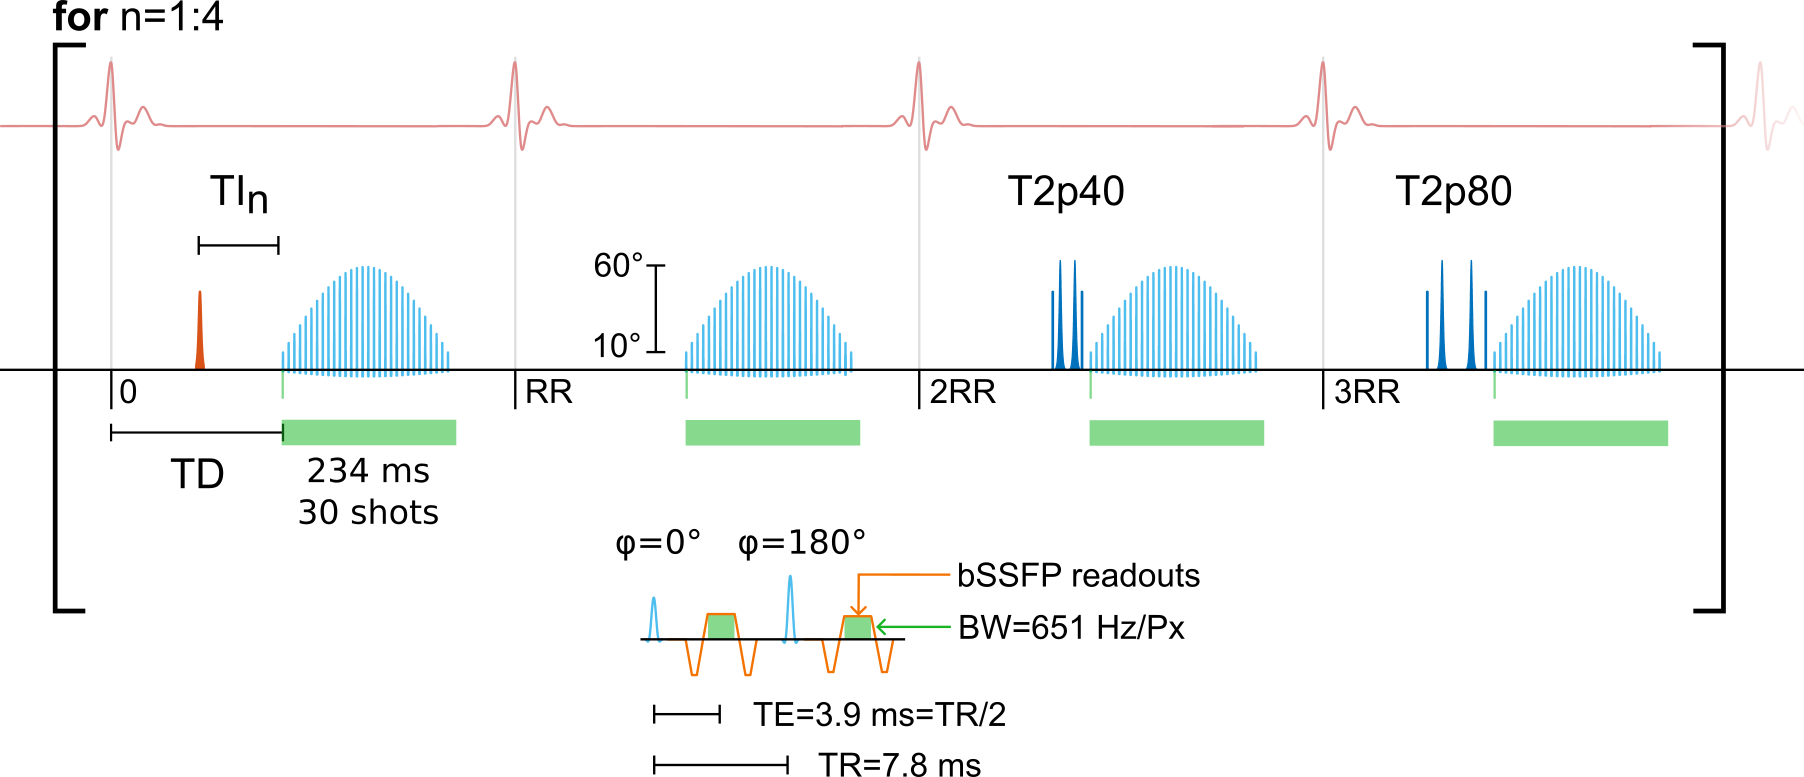
The proposed cardiac MRF at 0.55T (Fig. 1) acquires data over 16 heartbeats, divided into 4 blocks of 4 heartbeats each with varying magnetization preparation pulses (IR with TI = [17,75,150,300] ms, no preparation, T2 preparation 40 ms, T2 preparation 80 ms). This follows the original formulation of cardiac MRF [1], but unlike this implementation, it uses bSSFP radial readouts to boost the SNR at low field. bSSFP readouts were used with alternating RF phase between ϕ = 0° and ϕ = 180°, with flip angles in a sinusoidal sweep of 10° to 60°.All scans were performed at 0.55T (MAGNETOM Free.Max, Siemens Healthineers, Erlangen) using ECG-triggered acquisitions with an external monitoring system (Maglife Serenity, Schiller) and a radial trajectory with spoke rotation angle of 23.6281° (tiny golden angle). Sequence parameters include TE = 3.9 ms, TR = 7.8 ms, FOV = 256 × 256 mm2, in-plane resolution of 2 × 2 mm2, slice thickness 10 mm, bandwidth of 651 Hz/Px, 15-channel coil and an acquisition time of 16 s. The sequence was implemented using the Pulseq open-source sequence definition [8]. All images were reconstructed using low-rank inversion [9] [10] with patch-based low-rank high-dimensional (HD-PROST) regularization [11]. Subject-specific dictionaries were simulated by using the extended phase graph (EPG) formalism [12] using the open-source KomaMRI.jl simulator [13].
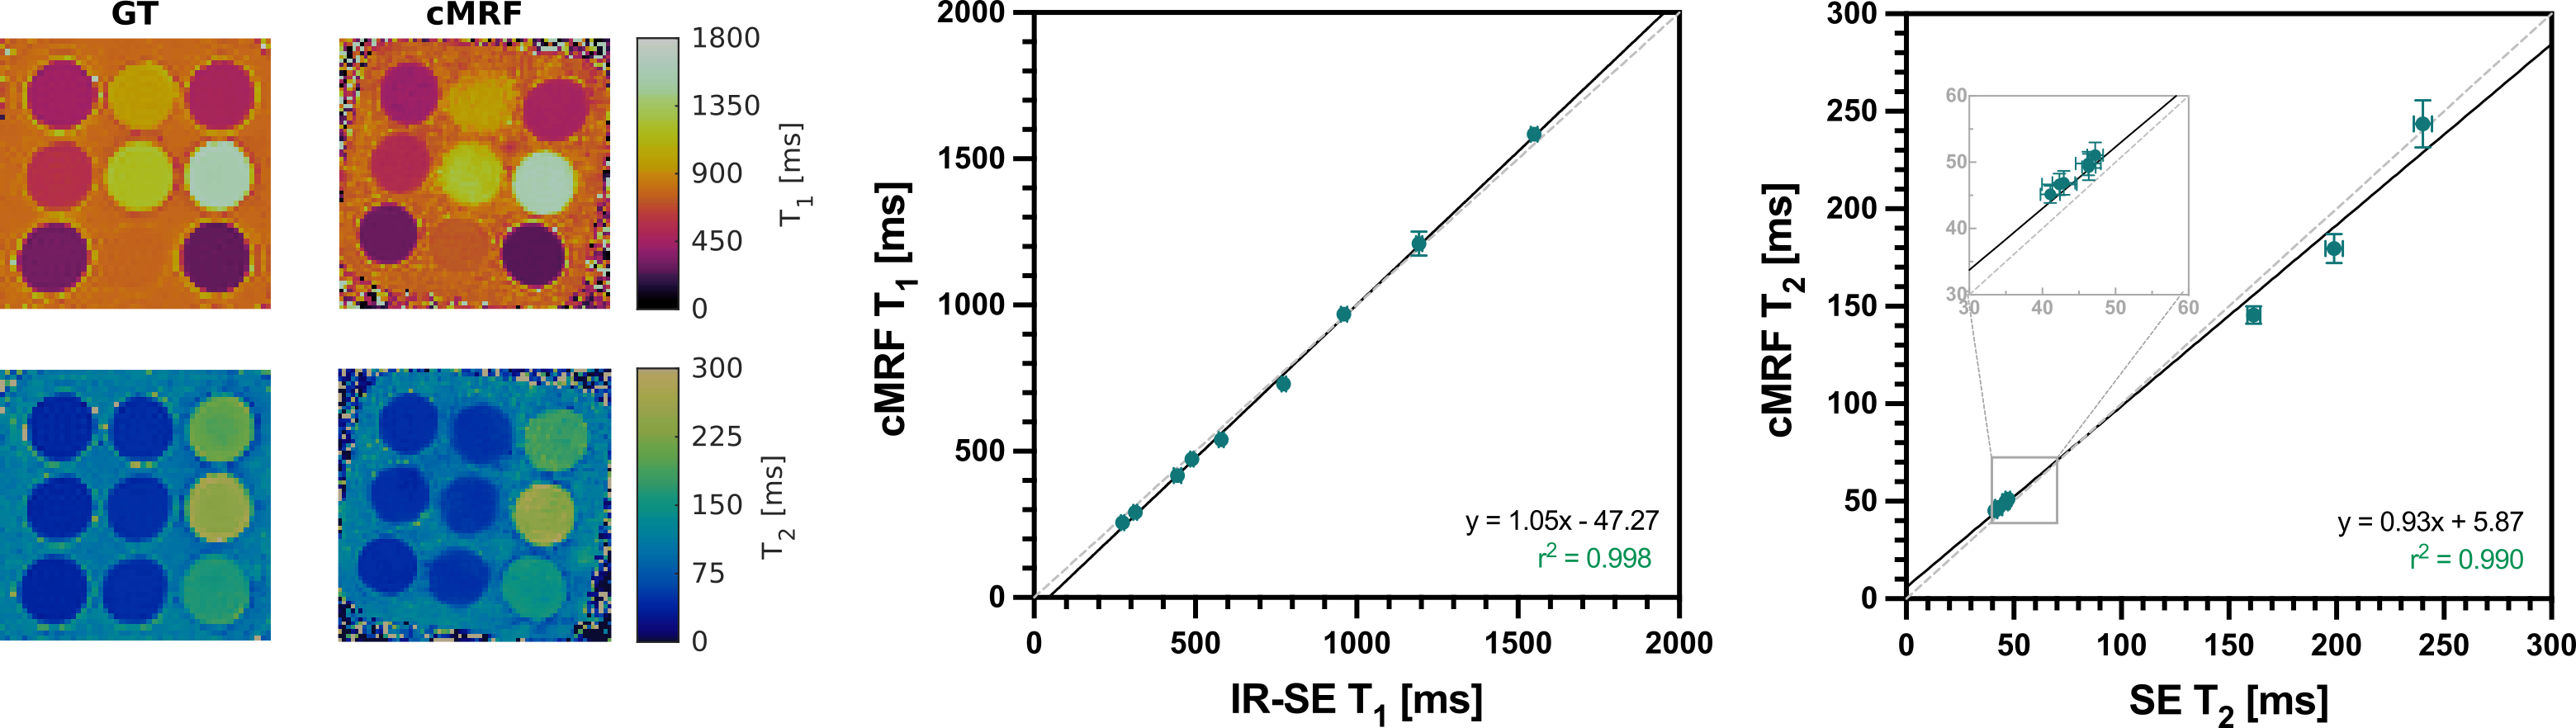
Phantom experiments were performed on the standardized T1MES phantom [14]. T1 and T2 cardiac MRF values were compared against their corresponding SpinEcho (SE) reference scans, IR-SE (TIs = [21, 87:187:1300] ms) and SE (TEs = [6.7, 33:17:267] ms) respectively. All the references were acquired with a resolution of 2×2×10 mm3 and FOV = 256 × 256 mm2 to match the MRF acquisition.
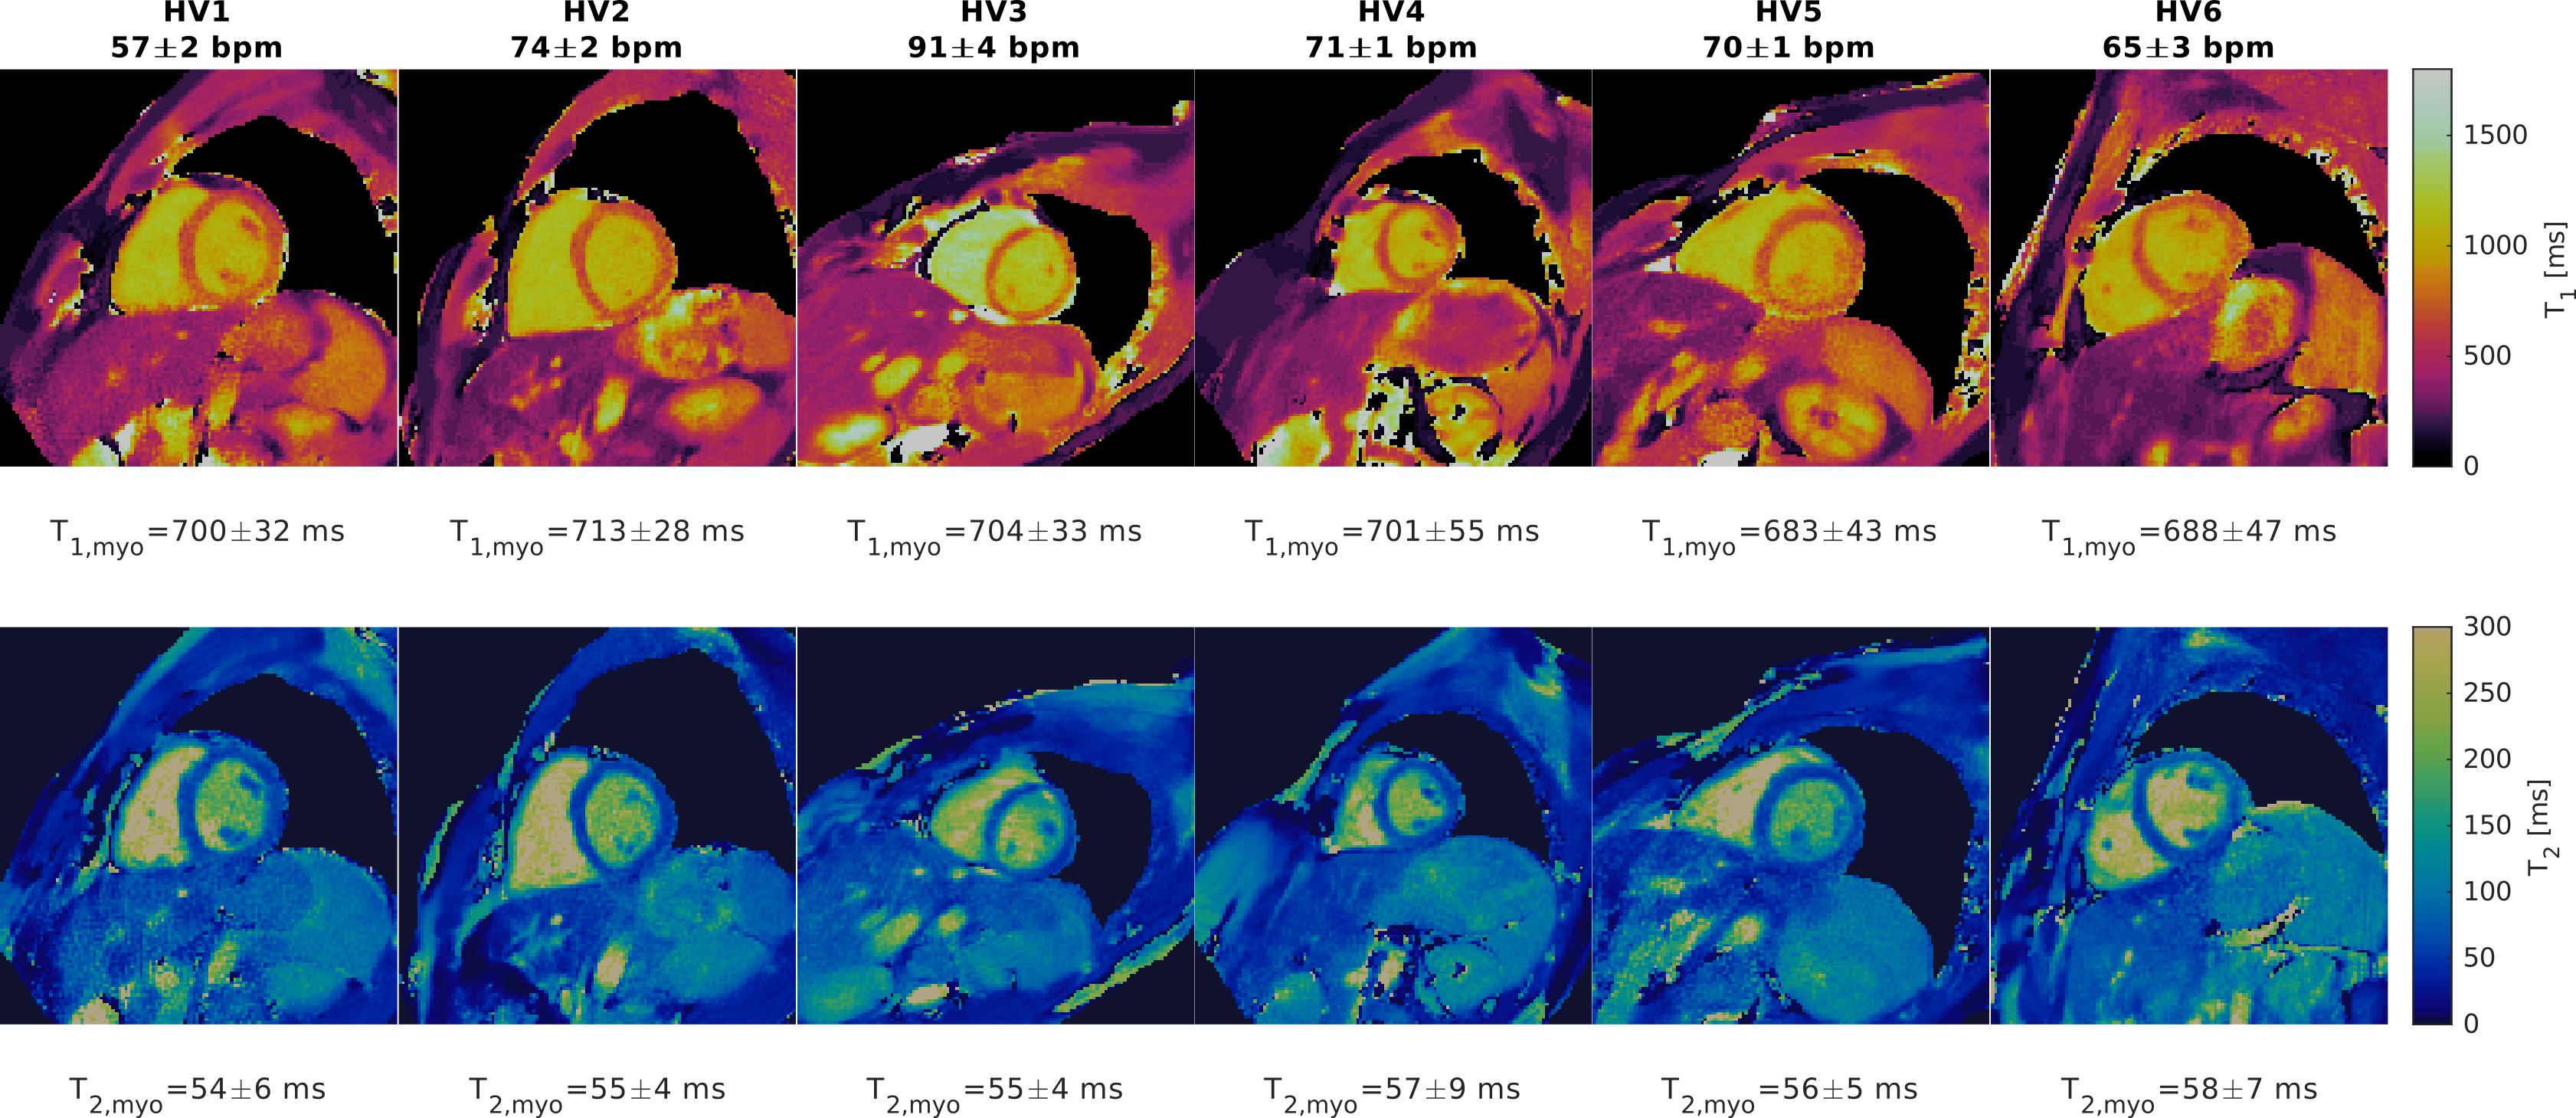
The sequence was also evaluated in vivo in 6 healthy volunteers (30 ± 6 yo, 4 male) on short-axis views at mid-diastole, using a subject-specific trigger delay deduced from a previously acquired CINE image and an acquisition window of 234 ms. The myocardium T1 and T2 values were measured using an ROI positioned in the interventricular septum and compared against literature values.
Results
Phantoms results with the proposed cardiac MRF approach at 0.55T are shown in Figure 2 in comparison to SE references. Results show good map quality and excellent agreement between the values measured with the proposed cardiac MRF at 0.55T and the reference SE values, with correlation and r2 close to one.T1 and T2 maps obtained with the proposed cardiac MRF approach at 0.55T are shown in Figure 3 for 6 healthy subjects (heart rate 71±11 bpm). Good image quality was observed for myocardial T1 and T2 maps for all the healthy volunteers. Measured myocardial T1 and T2 values agree with the reported literature values [15] (T1, myo − ref = 701 ± 24 ms and T2, myo − ref = 58 ± 6 ms vs T1, cMRF = 700 ± 11 ms and T1, cMRF = 56 ± 2 ms).
Acknowledgements
The authors acknowledge financial support from: (1) BHF RG/20/1/34802 (2) EPSRC EP/V044087/1 (3) ANID Millennium Institute iHEALTH, ICN2021_004; Fondecyt 1210637 and 1210638; Fondequip Mayor EQY210003; Basal Funding, IMPACT, FB210024 and (6) the Technical University of Munich – Institute for Advanced Study, (7) PhD program in Biological and Medical Engineering of the Pontificia Universidad Católica de Chile.References
[1] J. I. Hamilton et al., “MR fingerprinting for rapid quantification of myocardial T1 , T2 , and proton spin density,” Magnetic Resonance in Medicine, vol. 77, no. 4, pp. 1446–1458, Apr. 2017, doi: 10.1002/mrm.26216.
[2] G. J. Lima da Cruz, C. Velasco, B. Lavin, O. Jaubert, R. M. Botnar, and C. Prieto, “Myocardial T1, T2, T2*, and fat fraction quantification via low-rank motion-corrected cardiac MR fingerprinting,” Magnetic Resonance in Medicine, vol. 87, no. 6, pp. 2757–2774, Jun. 2022, doi: 10.1002/mrm.29171.
[3] O. P. Simonetti and R. Ahmad, “Low-Field Cardiac Magnetic Resonance Imaging,” Circulation: Cardiovascular Imaging, vol. 10, no. 6, p. e005446, Jun. 2017, doi: 10.1161/CIRCIMAGING.117.005446.
[4] T. C. Arnold, C. W. Freeman, B. Litt, and J. M. Stein, “Low-field MRI: Clinical promise and challenges,” Journal of Magnetic Resonance Imaging, vol. 57, no. 1, pp. 25–44, 2023, doi: 10.1002/jmri.28408.
[5] A. E. Campbell-Washburn, J. Varghese, K. S. Nayak, R. Ramasawmy, and O. P. Simonetti, “Cardiac MRI at Low Field Strengths,” Journal of Magnetic Resonance Imaging, vol. n/a, no. n/a, doi: 10.1002/jmri.28890.
[6] A. E. Campbell-Washburn, Y. Jiang, G. Körzdörfer, M. Nittka, and M. A. Griswold, “Feasibility of MR fingerprinting using a high-performance 0.55 T MRI system,” Magnetic Resonance Imaging, vol. 81, pp. 88–93, Sep. 2021, doi: 10.1016/j.mri.2021.06.002.
[7] Y. Liu, J. Hamilton, Y. Jiang, and N. Seiberlich, “Assessment of MRF for simultaneous T1 and T2 quantification and water-fat separation in the liver at 0.55 T,” Magma (New York, N.Y.), vol. 36, no. 3, pp. 513–523, Jul. 2023, doi: 10.1007/s10334-022-01057-9.
[8] K. J. Layton et al., “Pulseq: A rapid and hardware-independent pulse sequence prototyping framework,” Magnetic Resonance in Medicine, vol. 77, no. 4, pp. 1544–1552, 2017, doi: 10.1002/mrm.26235.
[9] J. Assländer, M. A. Cloos, F. Knoll, D. K. Sodickson, J. Hennig, and R. Lattanzi, “Low Rank Alternating Direction Method of Multipliers Reconstruction for MR Fingerprinting,” Magnetic resonance in medicine, vol. 79, no. 1, pp. 83–96, Jan. 2018, doi: 10.1002/mrm.26639.
[10] G. Lima da Cruz, A. Bustin, O. Jaubert, T. Schneider, R. M. Botnar, and C. Prieto, “Sparsity and locally low rank regularization for MR fingerprinting,” Magnetic Resonance in Medicine, vol. 81, no. 6, pp. 3530–3543, Jun. 2019, doi: 10.1002/mrm.27665.
[11] A. Bustin, G. Lima da Cruz, O. Jaubert, K. Lopez, R. M. Botnar, and C. Prieto, “High-dimensionality undersampled patch-based reconstruction (HD-PROST) for accelerated multi-contrast MRI,” Magnetic Resonance in Medicine, vol. 81, no. 6, pp. 3705–3719, Jun. 2019, doi: 10.1002/mrm.27694.
[12] M. Weigel, “Extended phase graphs: Dephasing, RF pulses, and echoes - pure and simple,” Journal of Magnetic Resonance Imaging, vol. 41, no. 2, pp. 266–295, Feb. 2015, doi: 10.1002/jmri.24619.
[13] C. Castillo-Passi, R. Coronado, G. Varela-Mattatall, C. Alberola-López, R. Botnar, and P. Irarrazaval, “KomaMRI.jl: An open-source framework for general MRI simulations with GPU acceleration,” Magnetic Resonance in Medicine, vol. 90, no. 1, pp. 329–342, 2023, doi: 10.1002/mrm.29635.
[14] G. Captur et al., “A medical device-grade T1 and ECV phantom for global T1 mapping quality assurancethe T1 Mapping and ECV Standardization in cardiovascular magnetic resonance (T1MES) program,” Journal of Cardiovascular Magnetic Resonance, vol. 18, no. 1, p. 58, Sep. 2016, doi: 10.1186/s12968-016-0280-z.
[15] “Opportunities in Interventional and Diagnostic Imaging by Using High-Performance Low-Field-Strength MRI.” https://pubs.rsna.org/doi/epdf/10.1148/radiol.2019190452. doi: 10.1148/radiol.2019190452.
Figures