0576
Normative trajectories of R1, R2*, and Susceptibility values of the healthy human brain cortex1Translational Imaging in Neurology (ThINK) Basel, Department of Biomedical Engineering, Faculty of Medicine, University Hospital Basel and University of Basel, Basel, Switzerland, 2Department of Neurology, University Hospital Basel, Basel, Switzerland, 3Research Center for Clinical Neuroimmunology and Neuroscience Basel (RC2NB), University Hospital Basel and University of Basel, Basel, Switzerland, 4Division of Radiological Physics, Department of Radiology, University Hospital Basel, Basel, Switzerland, 5Athinoula A. Martinos Center for Biomedical Imaging, Charlestown, MA, United States, 6Department of Radiology, Harvard Medical School, Boston, MA, United States, 7Department of Health Sciences, University of Genova, Genova, Italy, 8Donders Centre for Cognitive Neuroimaging, Radboud University, Nijmegen, Netherlands
Synopsis
Keywords: Quantitative Imaging, Quantitative Imaging
Motivation: Quantitative MRI (qMRI) offers sensitive and specific measures to study age-related microstructural changes in the brain. However, models assessing age trajectories in qMRI brain properties are often incomparable among centers.
Goal(s): Develop normative models reflecting aging trajectories and assess the impact of bi-centric, non-fully matched protocols in brain aging studies.
Approach: Investigating age trajectories in cortical regions using polynomial regression models, focusing on quantitative R1, R2*, and susceptibility mapping (QSM).
Results: We validated data harmonization by observing the impact on normative trajectories using bicentric data, where we noted significantly different maturation and aging inflections for R1 and R2* trajectories across cortical regions.
Impact: This bi-centric, multi-parameter qMRI study investigates age-dependent variations across cortical regions, offering a valuable reference for subsequent qMRI aging research and emphasizing age effects on the cortical surface.
Introduction
Brain aging is associated with structural alterations within cerebral architecture, which are macroscopically evident through ventricular expansion and brain volume shrinkage1,2. Quantitative MRI (qMRI) outperforms conventional MRI in accuracy and reproducibility3 and offers additional insights into age-related microstructural changes. By studying longitudinal and apparent transverse relaxation rate (R1, R2*), and Quantitative Susceptibility Mapping (QSM), we can gain a detailed insight into tissue properties such as microstructural composition, mobility of water pools, and variations in iron content 3,4. The present study investigates R1, R2*, and QSM cortical normative aging models in different Brodmann areas (BA). Furthermore, we explore these biomarkers' robustness using harmonized datasets from similar but non-identical protocols in non-age-matched populations.Methods
This study analyzed qMRI data from 400 sex-matched participants (54% female, 46% male) across different age distributions (mean age 47.8 years, age range 18-79 years), acquired from two centers. Imaging protocols comprised Magnetization Prepared 2 Rapid Acquisition Gradient Echoes (MP2RAGE)5 and Multi-Echo Gradient Recalled Echo6 (MEGRE) sequences acquired on the 3.0 T systems (Magnetom Prisma, Siemens Healthcare, Erlangen, Germany) but with significantly different acquisition parameters (see Fig.1B for details).Standard preprocessing (Fig.1C) included skull stripping, bias correction, FreeSurfer cortical segmentation, quality control and parcellation using the PALS-B12 atlas7 on the MP2RAGE T1-weighted data.
MATLAB was used to compute all quantitative maps: QSM and R2* maps were reconstructed using the SEPIA8–11 toolbox, while R1 maps (corrected for transmit field inhomogeneities12) were computed using publicly available code13. QSM and R2* maps were co-registered to R1 space. Quantitative surface maps were created by projecting qMRI maps on the middle-layer cortical surface derived by Freesurfer (to avoid partial volume effects, Fig.2A)12 and outlier voxels in each BA were excluded before averaging within BA.
The age effect on qMRI parameters was assessed employing a polynomial regression model described in Figure 3, integrating age, age2, and sex as covariates, followed by the likelihood ratio test for model comparisons.
Data consistency across sites was obtained using ComBat14.
Results
Average values across brain regions for R1, R2*, and QSM are summarized in Fig.2B, highlighting the regions with the highest and lowest means for each parameter which show the expected trend with primary sensory areas having increased relaxation rates due to increased myelination15.Polynomial regression models were fitted to harmonized dual-site data (Fig.3), which suggested that despite the comparable echo times used across sites, the reduced resolution (R2*/QSM) in site 2 might introduce significant biases when comparing cortical biomarkers. Polynomial regression models (Fig.4) revealed significant age dependencies in R1 across all areas, with BA4 showing the most robust aging dependency. For R2*, only BA38 showed no age dependency, for QSM this extended to BA11, 20, 21, 25, 26, 28, 35 and BA36. Figure 4A showed that only R1 visibly reduced data variance, as indicated by narrower distributions of adjusted residuals.
From the models fitting, we derived peak ages (years, y) (Fig.5A). In R1 peak maps (Fig.5B), the anterior prefrontal cortex (BA10) showed the earlier maturation peak age at 54.2y, while orbitofrontal cortex (BA11) and peripheral visual cortex had later peaks. This pattern was dissimilar to that reported16 in white matter, where primary sensory regions matured first and peaked at late 30s. The spatial pattern of the R2* age peaks was uncorrelated to that of R1 and happens on average 5 years later. The larger range of age peaks observed for QSM seems to reflect noise on the peak estimation rather than an actual (de)maturation process. This is emphasized by repeating the analysis using only site 1 (higher spatial resolution and broader age range) and comparing it to the harmonized maps (see Fig.5C), where no correlation was found for QSM. This result is not surprising as QSM has known shortcomings when studying the cortex (associated with both background field removal and deconvolution15).
Discussion and Conclusion
Significant correlations between age peaks of the large and combined datasets validated harmonization, confirming the reduced inter-site variability and consistent R1 and R2* age trajectories. R1 proved highly sensitive, while cortical R2* trajectories were less stable. At this stage, it's unclear if this is due to the metric (natural inter-subject variability) or protocol differences. This study demonstrates that normative models can correct age effects in future studies on patients’ cortical changes, aiding in the understanding of normal brain maturation and degeneration. This is possible even with nonidentical protocols showing different BAs reach inflection points between 50-60, 55-65 years old for R1, R2* respectively. Future studies will evaluate aging trajectories in white matter tracts, where we expect R1, R2*, but also QSM to show reliable normative trajectories.Acknowledgements
We thank all the subjects for their participation.References
1. Lockhart SN, DeCarli C. Structural imaging measures of brain aging. Neuropsychol Rev. 2014;24:271-289.
2. Fjell AM, Walhovd KB. Structural Brain Changes in Aging: Courses, Causes and Cognitive Consequences. Rev Neurosci. 2010;21(3). doi:10.1515/REVNEURO.2010.21.3.187
3. Granziera C, Wuerfel J, Barkhof F, et al. Quantitative magnetic resonance imaging towards clinical application in multiple sclerosis. Brain. 2021;144(5):1296-1311. doi:https://doi.org/10.1093/brain/awab029 4. Tofts P. Quantitative MRI of the brain: measuring changes caused by disease. John Wiley Sons Ltd. Published online 2003:581-610. doi:10.1002/0470869526
5. Marques JP, Kober T, Krueger G, van der Zwaag W, Van de Moortele PF, Gruetter R. MP2RAGE, a self bias-field corrected sequence for improved segmentation and T1-mapping at high field. Neuroimage. 2010;49(2):1271-1281. doi:https://doi.org/10.1016/j.neuroimage.2009.10.002
6. Wang Y, Liu T. Quantitative susceptibility mapping (QSM): Decoding MRI data for a tissue magnetic biomarker. Magn Reson Med. 2015;73(1):82-101. doi:10.1002/mrm.25358
7. Fischl B. FreeSurfer. Neuroimage. 2012;62(2):774-781.
8. Chan KS, Marques JP. SEPIA—Susceptibility mapping pipeline tool for phase images. Neuroimage. 2021;227:117611.
9. Li W, Wu B, Liu C. Quantitative susceptibility mapping of human brain reflects spatial variation in tissue composition. NeuroImage. 2011;55(4):1645-1656. doi:10.1016/j.neuroimage.2010.11.088
10. Dymerska B, Eckstein K, Bachrata B, et al. Phase unwrapping with a rapid opensource minimum spanning tree algorithm (ROMEO). Magn Reson Med. 2021;85(4):2294-2308. doi:10.1002/mrm.28563 11. Lai KW, Aggarwal M, Van Zijl P, Li X, Sulam J. Learned Proximal Networks for Quantitative Susceptibility Mapping. In: Martel AL, Abolmaesumi P, Stoyanov D, et al., eds. Medical Image Computing and Computer Assisted Intervention – MICCAI 2020. Vol 12262. Lecture Notes in Computer Science. Springer International Publishing; 2020:125-135. doi:10.1007/978-3-030-59713-9_13
12. Shams Z, Norris DG, Marques JP. A comparison of in vivo MRI based cortical myelin mapping using T1w/T2w and R1 mapping at 3T. PloS One. 2019;14(7):e0218089.
13. Marques JP. MP2RAGE scripts. Published online October 22, 2023. Accessed November 6, 2023. https://github.com/JosePMarques/MP2RAGE-related-scripts
14. Fortin JP, Parker D, Tunç B, et al. Harmonization of multi-site diffusion tensor imaging data. NeuroImage. 2017;161:149-170. doi:10.1016/j.neuroimage.2017.08.047
15. Marques JP, Khabipova D, Gruetter R. Studying cyto and myeloarchitecture of the human cortex at ultra-high field with quantitative imaging: R1, R2* and magnetic susceptibility. NeuroImage. 2017;147:152-163.
16. Yeatman JD, Wandell BA, Mezer AA. Lifespan maturation and degeneration of human brain white matter. Nat Commun. 2014;5(1):4932.
Figures
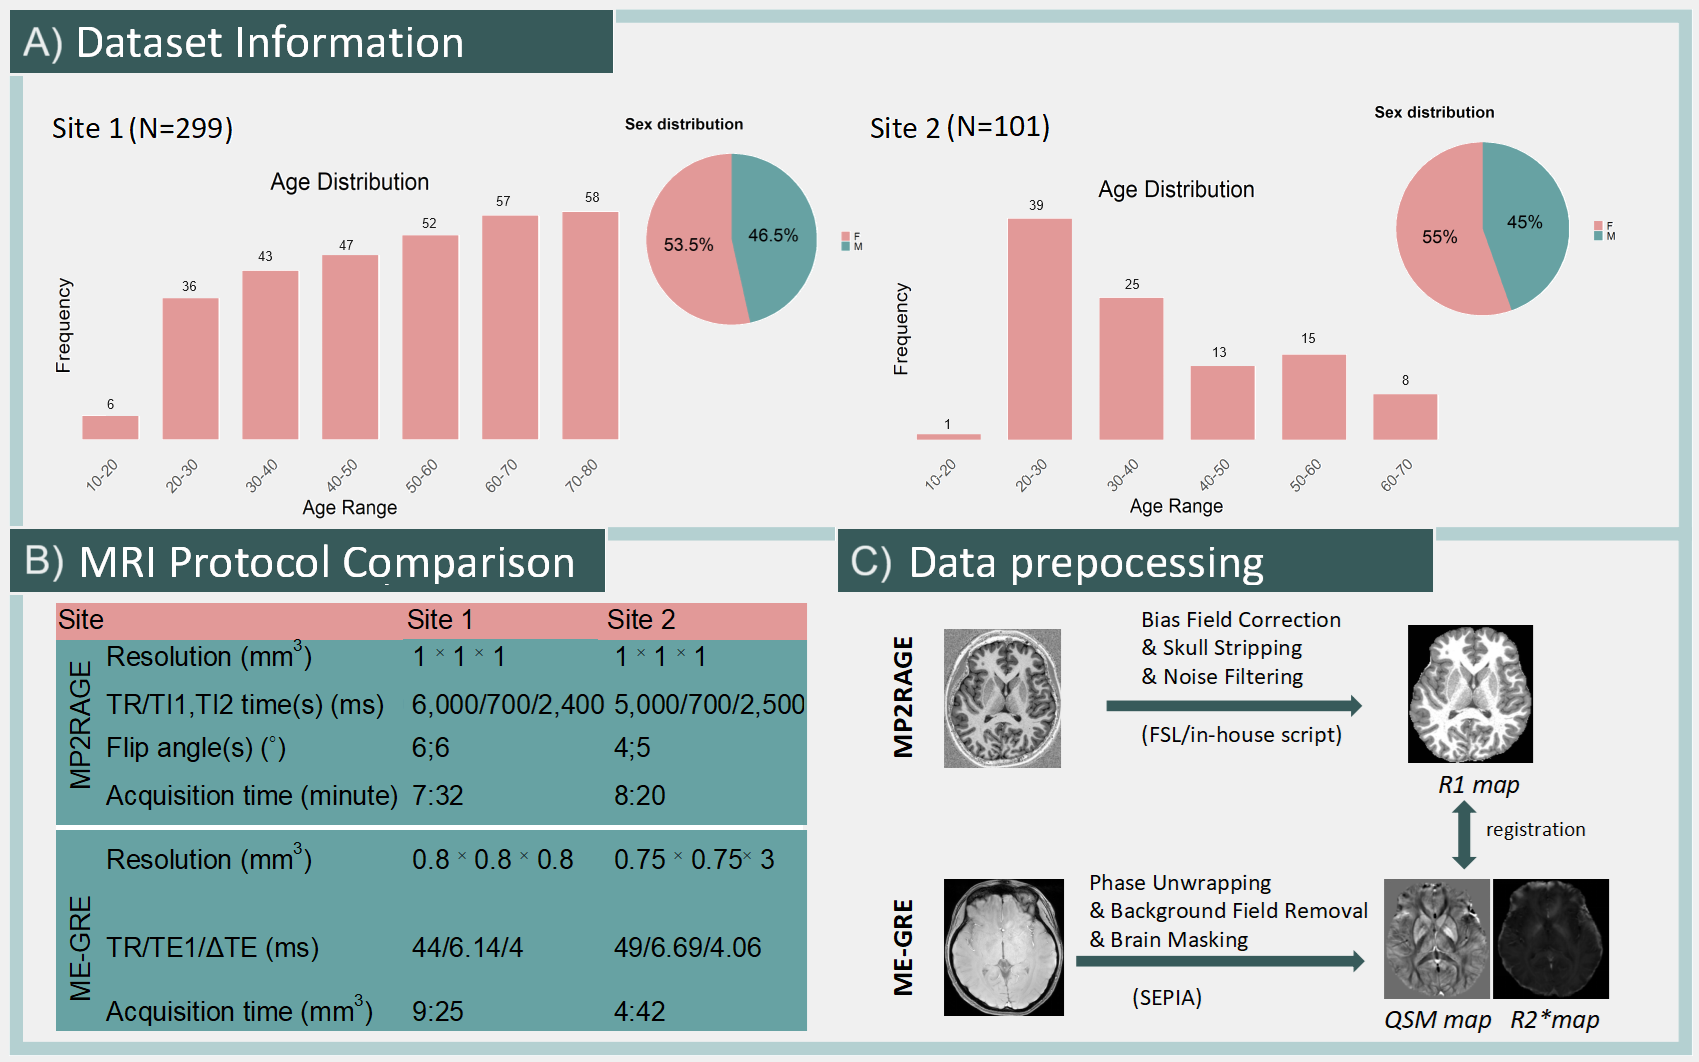
Figure 1 MRI Data and Pre-processing Pipeline
Figure 1 displays the data information, MRI protocol from dual-sites, and shows the data preprocessing workflow. QSM, Quantitative Susceptibility Mapping.
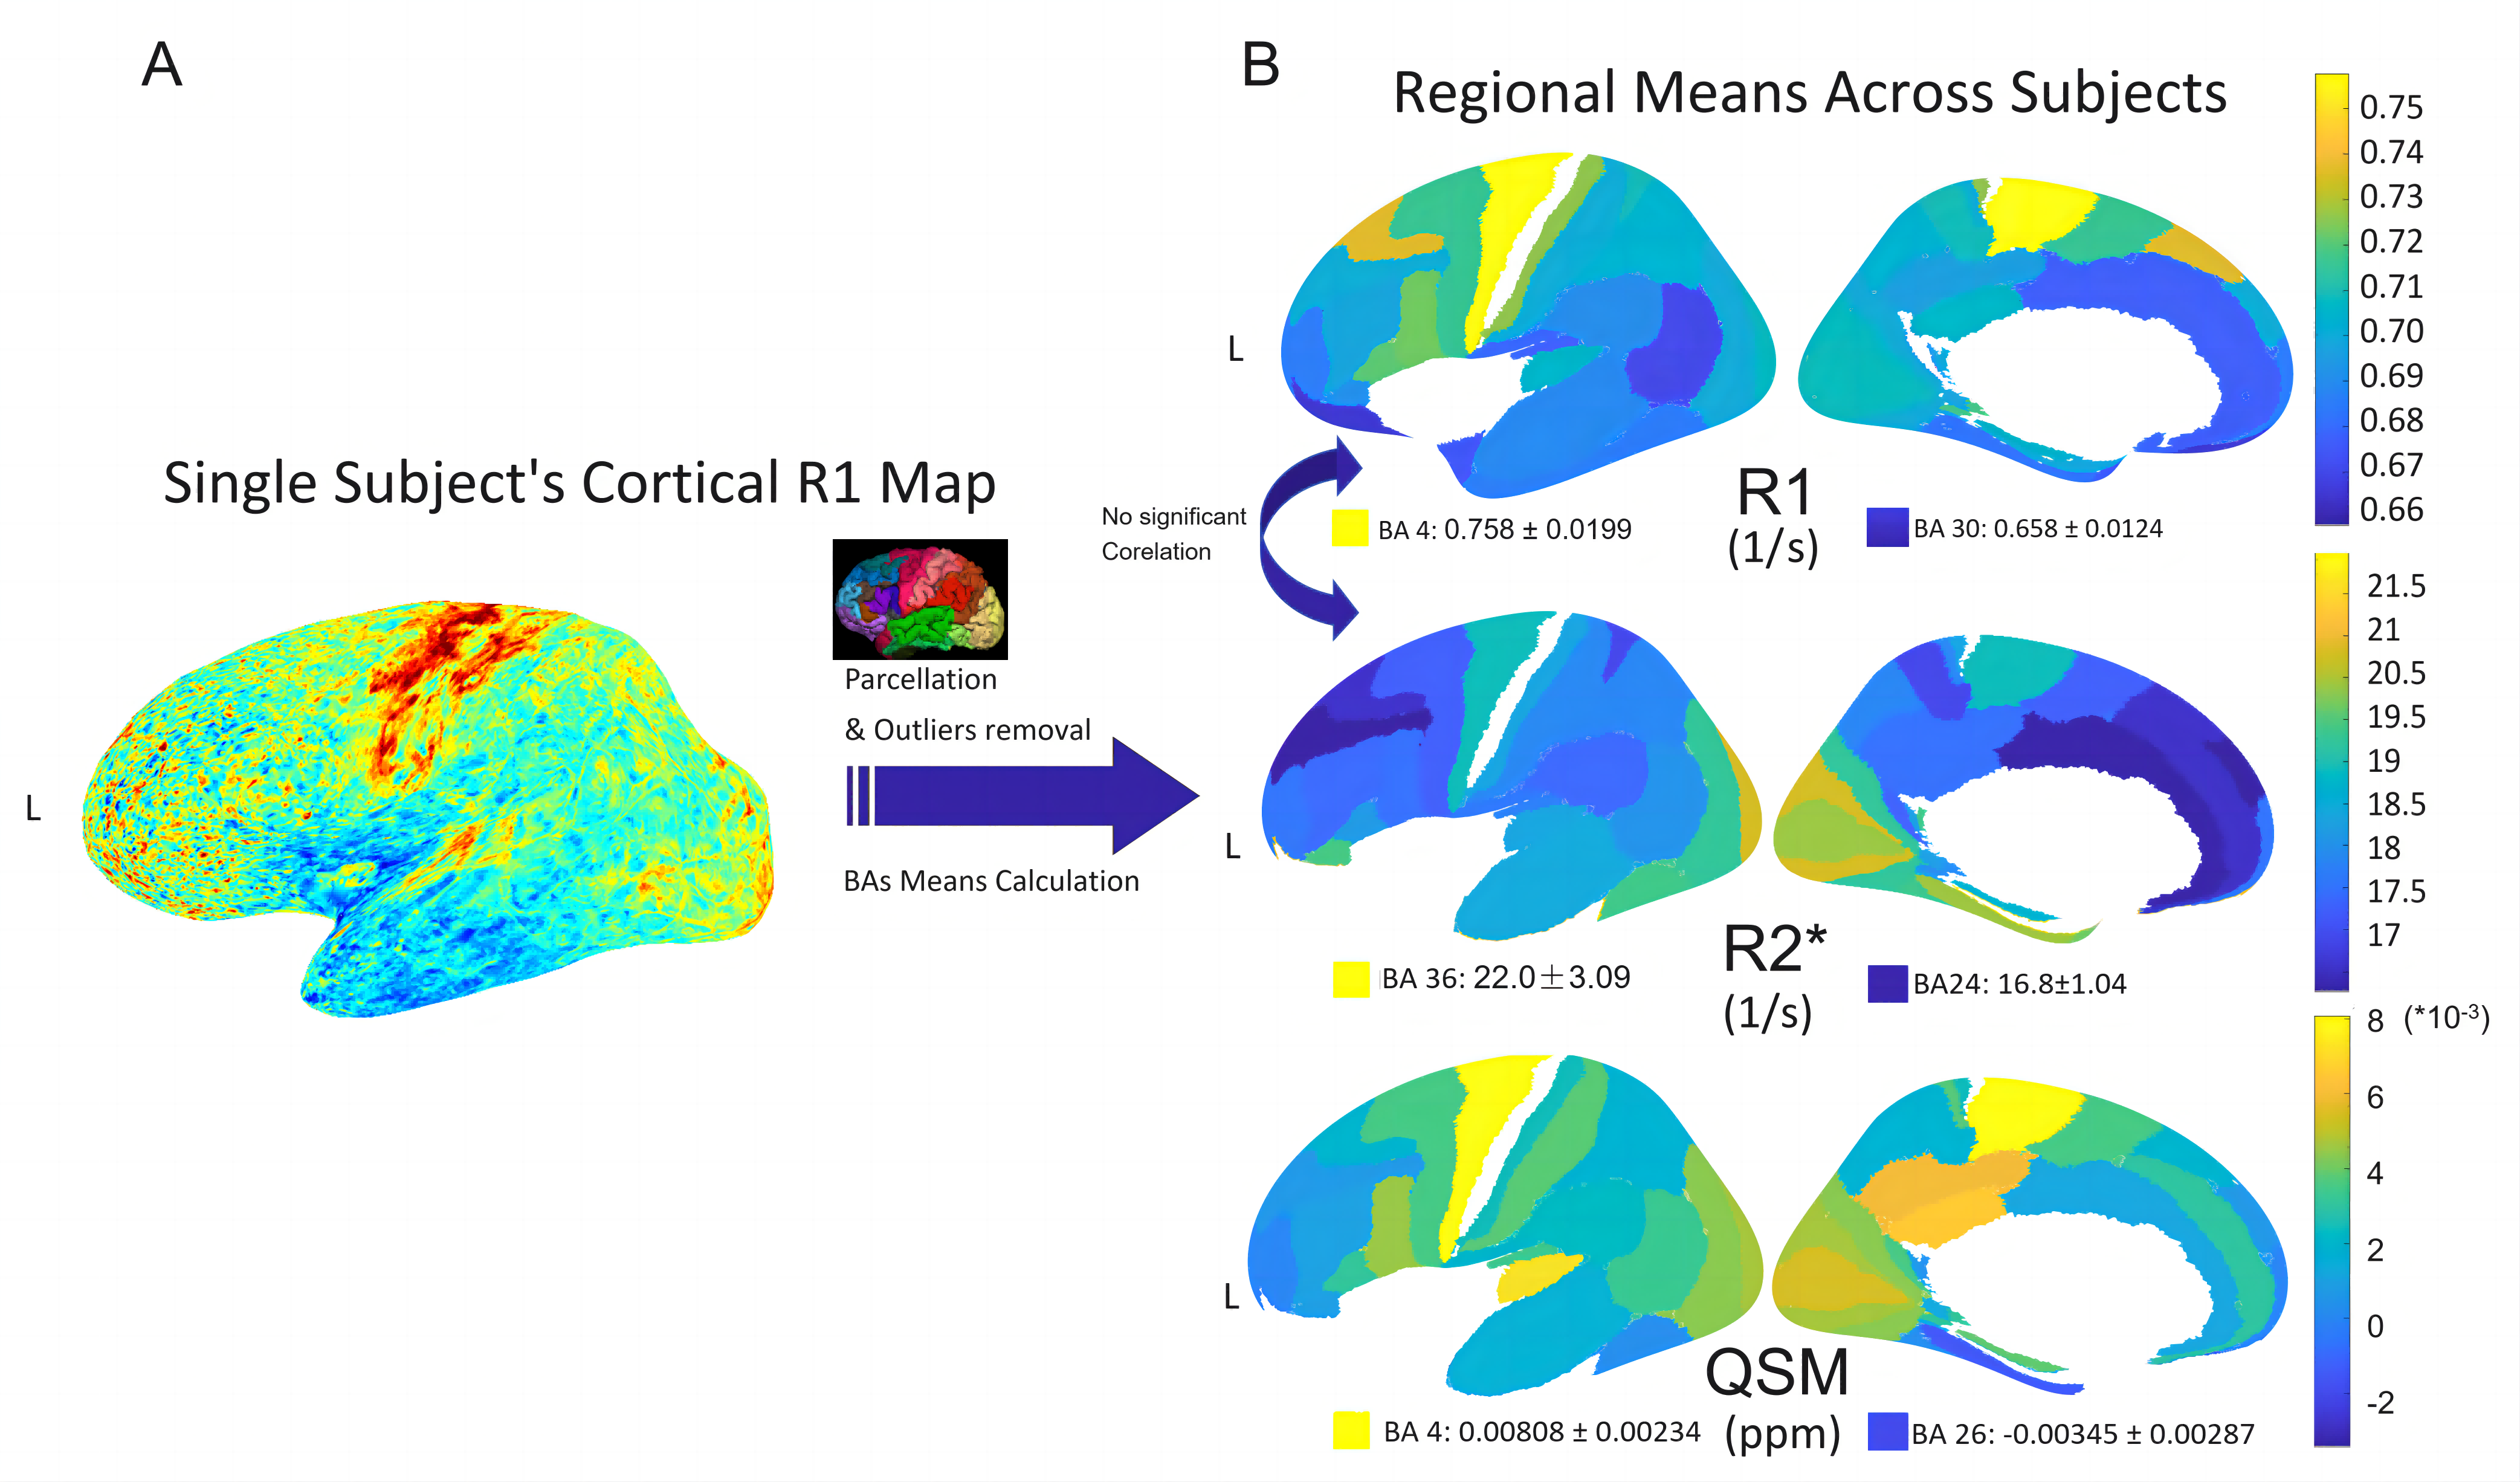
Figure 2 Mapping Quantitative Cortex: Reconstruction and Regional Averages
Panel A: An example R1 surface-map at the middle cortical layer. Outliers beyond three times the averages were removed before calculating regional averages based on brain parcellation to account for vessels or miss segmentation. Panel B showed unified means across selected Brodmann areas for R1, R2*, and QSM, with annotations showing the highest and lowest means with standard deviations. No correlation between mean R1 and R2*. QSM, Quantitative Susceptibility Mapping; L, Left; BA, Brodmann area.
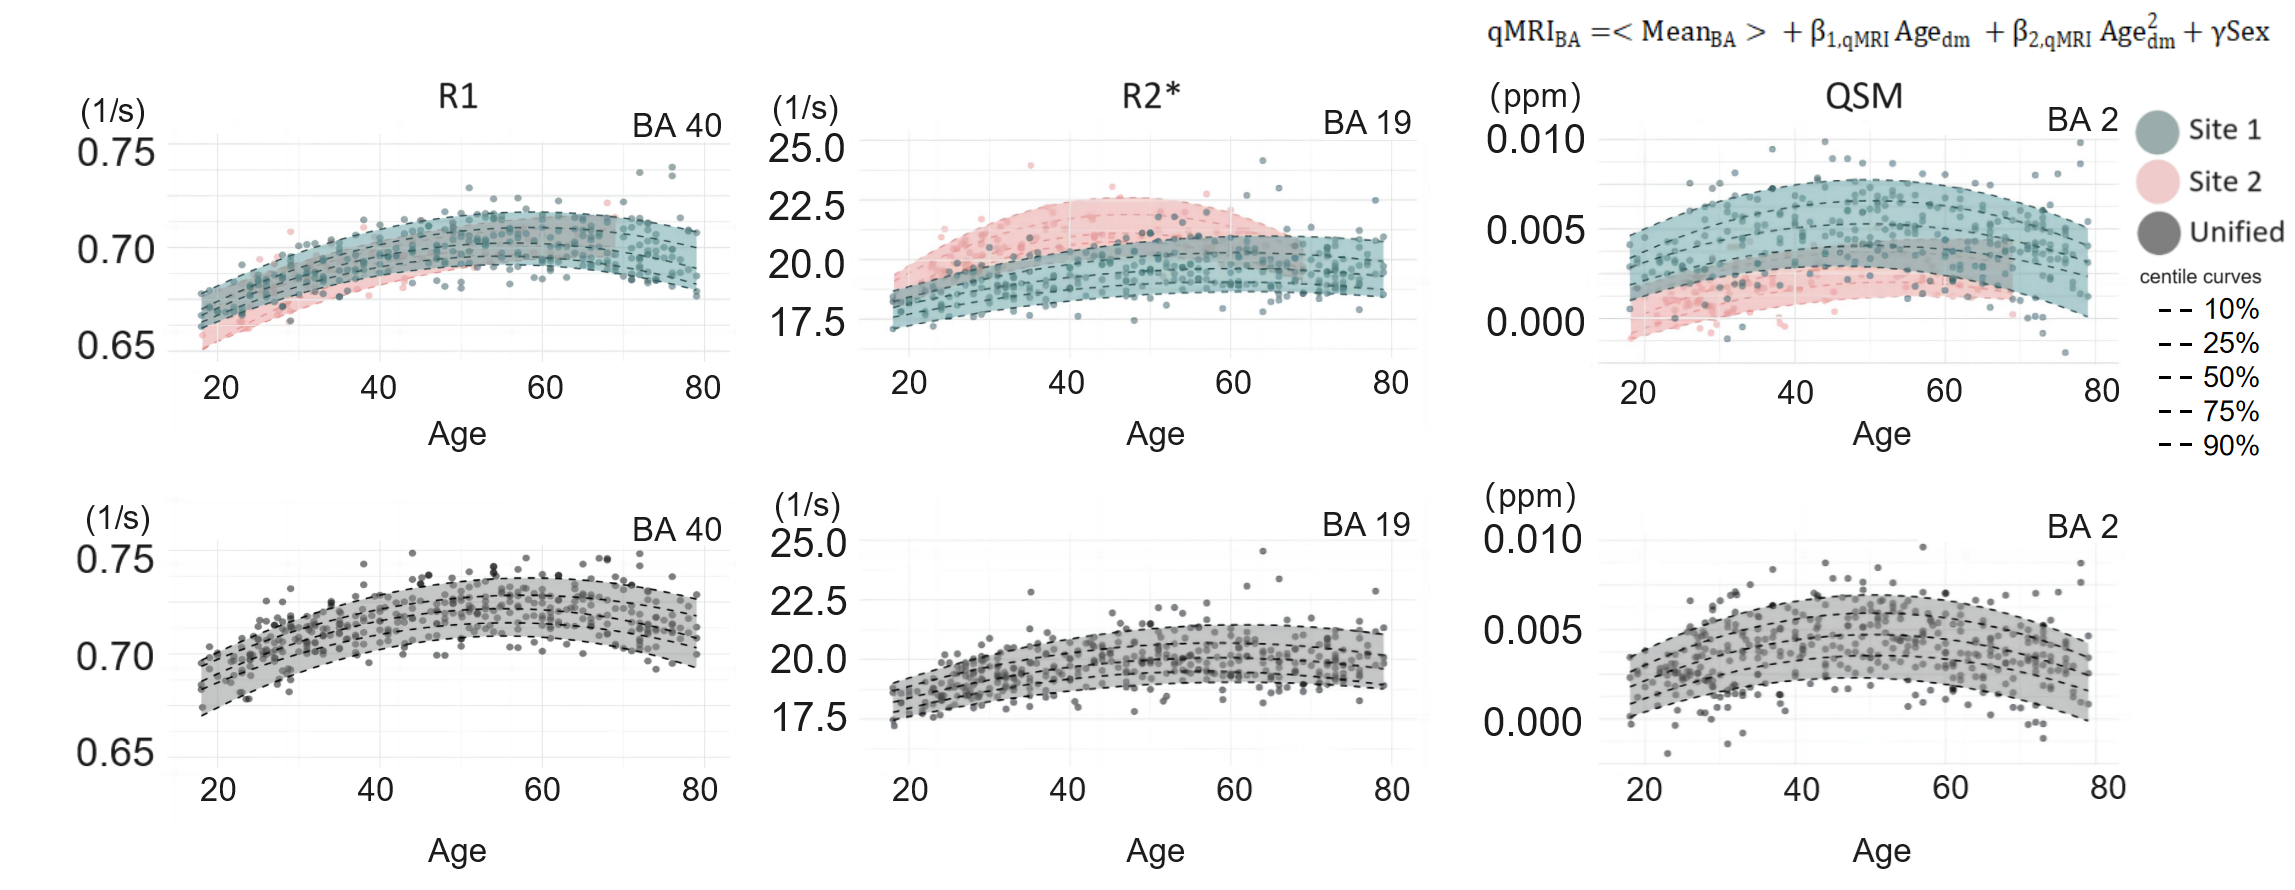
Figure 3 Harmonizing Data and Modeling Aging Effect Across Brain Regions
Figure 3 highlights the initial age dependency modeling for the 3 example quantitative maps (R1, R2* and QSM) from two separate datasets before (top row) and after (bottom row) data harmonization. Different site data have larger differences in MEGRE-derived quantitative maps than in MP2RAGE-derived quantitative maps. Full lines are the quadratic model fit results shown at the top: <qMRI>, qMRI values; Age_dm/ Age2_dm, demeaned Age/ Age2; β1/2 qMRI, age/age2 coefficients factors of qMRI metric.
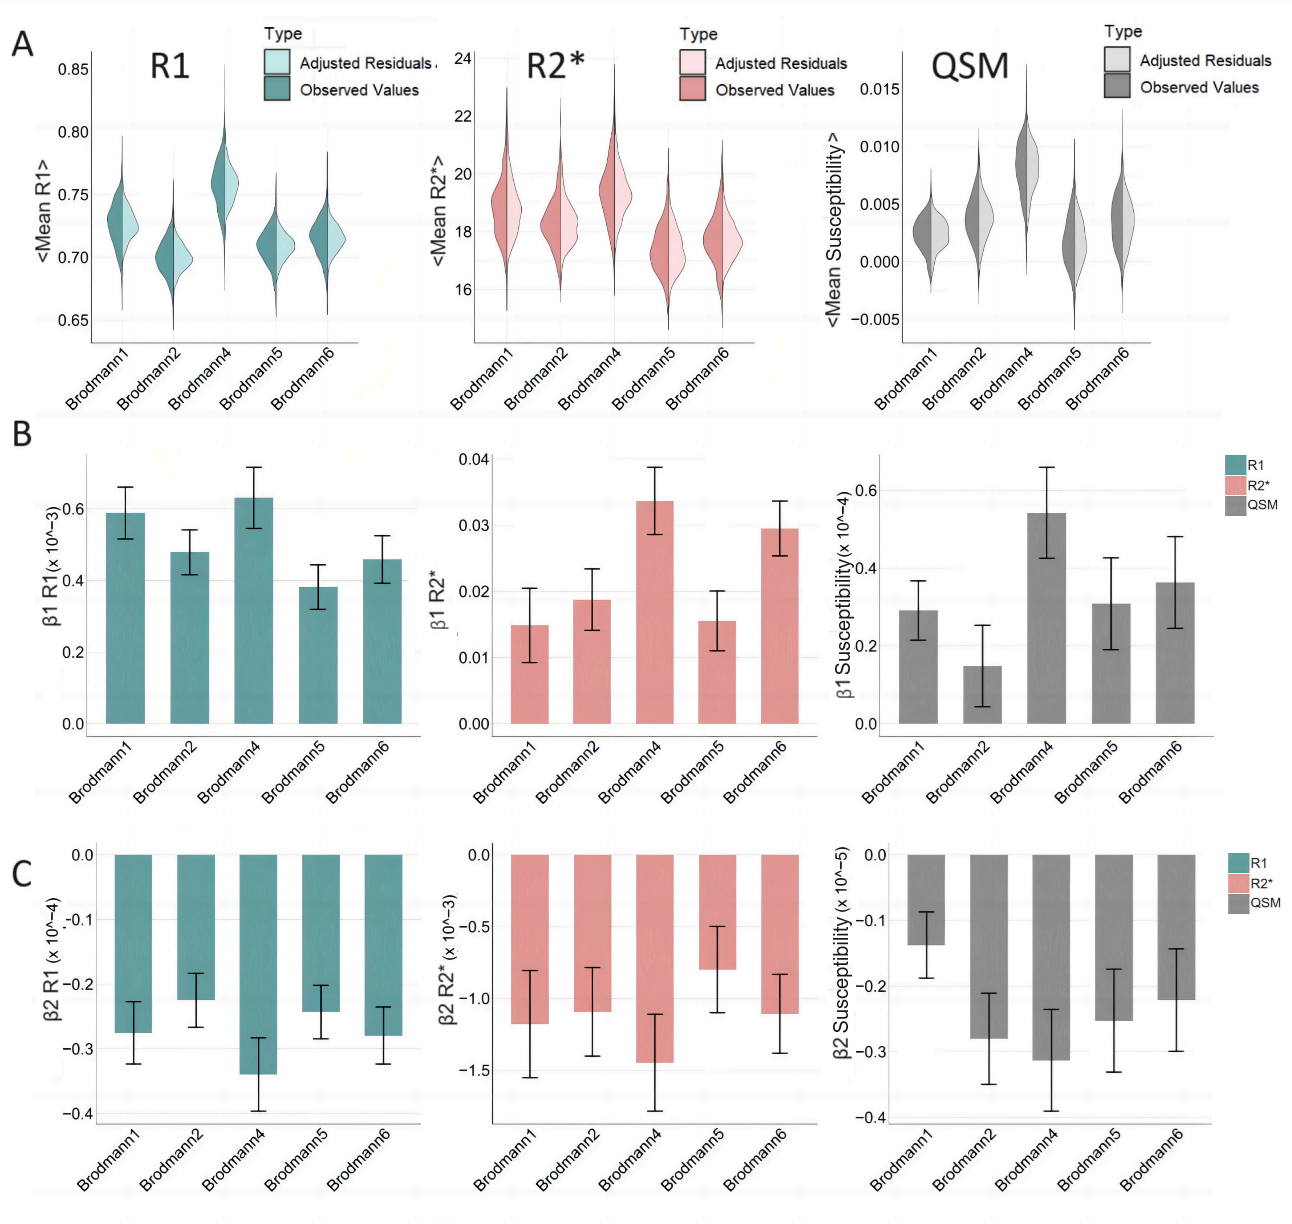
Figure 4 Polynomial Regression Models on Age Dependency
Polynomial regression results for the first 5 Brodmann areas on the PALS atlas. Panel A: Split violin plots of observed values (R1/R2*/Susceptibility), and adjusted residuals distribution (after removing age effects described in Eq1). Age effects on means of R1/R2*/QSM were assessed with age, age2, and sex. Panels B & C show coefficients for linear () and quadratic () age terms, respectively, with their confidence intervals. QSM, Quantitative Susceptibility Mapping.
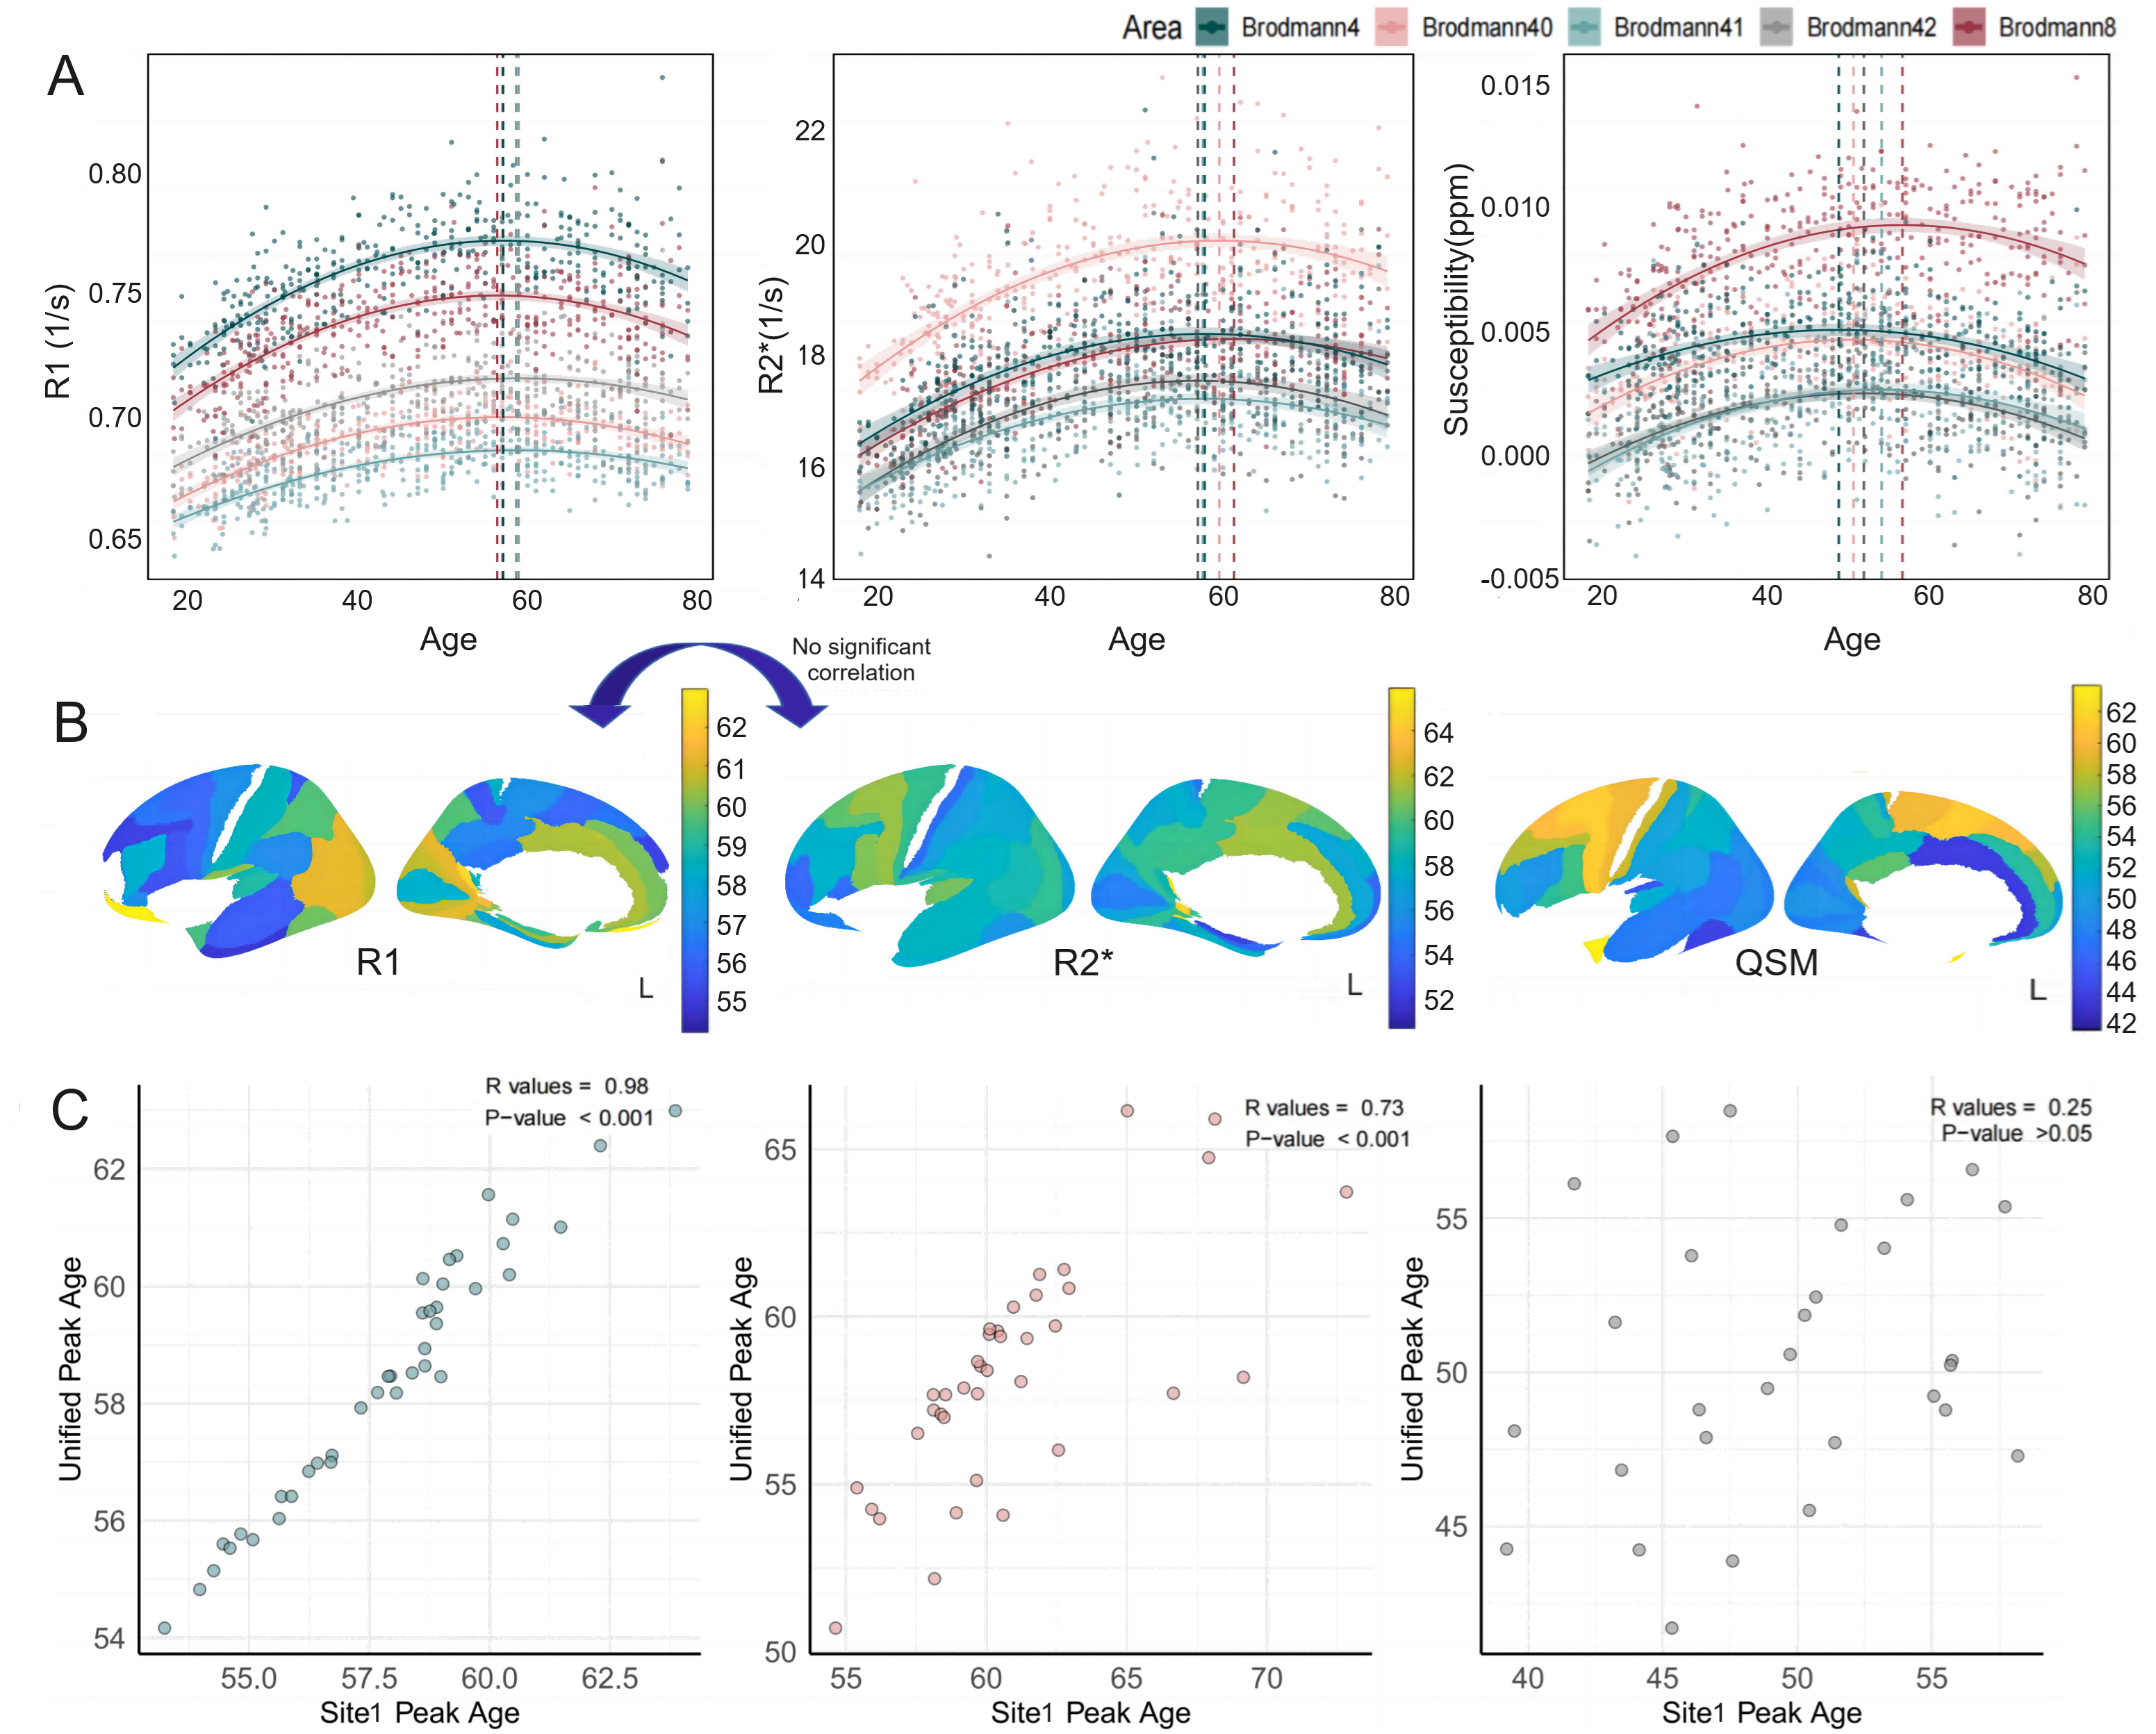
Figure 5 Brain Map of Peak Ages from Age Dependency
Panel A provided some of the most significant polynomial models in R1, R2* and QSM, with dash lines indicating derived age peaks. Panel B shows Left Hemisphere surface maps illustrating peaks derived from quadratic regression models. Panel C shows correlations on peak ages between site 1 and harmonized data, with R1 and R2* showing no significant correlation. Regions lacking significant age quadratic dependency were excluded from the analysis. QSM, Quantitative Susceptibility Mapping; L, Left.