0573
Whole Brain Multiparametric Mapping in Two Minutes Using a Dual-Flip-Angle Stack-of-Stars Blipped Multi-Gradient-Echo Acquisition1School of Biomedical Engineering, Shanghai Jiao Tong University, Shanghai, China
Synopsis
Keywords: Quantitative Imaging, Multi-Contrast, Multiparametric Mapping, Myelin Water Imaging, Relaxometry, Radial Stack-of-Stars Trajectory
Motivation: Multiparametric MRI of the brain can be used to improve the assessment of neurological diseases. However, the long scan time hinders its clinical applications.
Goal(s): This study aims to develop a technique for fast whole brain multiparametric mapping.
Approach: A dual-flip-angle stack-of-stars (SOS) blipped multi-gradient-echo sequence was developed to accelerate the acquisition. A novel joint-sparsity-constrained multicomponent T2*-T1 spectrum estimation algorithm was proposed to improve the quantification of myelin water fraction (MWF).
Results: The in vivo experiments have demonstrated good agreement between results of accelerated SOS and the reference, as well as good repeatability between two repeated accelerated SOS scans.
Impact: Our technique can provide robust whole brain multiparametric mapping of MWF, T1, proton density (PD), R2*, magnetic susceptibility (QSM), and B1 transmit field (B1+) with a two-minute scan, which has a great potential for neurological applications, such as multiple sclerosis.
Introduction
Multiparametric MRI of the brain can be used to improve the assessment of neurological diseases [1]. However, the long scan time hinders its clinical applications. In this study, we developed a new imaging technique for fast simultaneous 3D multiparametric mapping of whole brain myelin water fraction (MWF), T1, proton density (PD), R2*, magnetic susceptibility (QSM), and B1 transmit field (B1+) with a two-minute scan. Besides, a novel joint-sparsity-constrained multicomponent T2*-T1 spectrum estimation (JMSE) algorithm was proposed to correct for the T1 saturation effect and B1+/B1− inhomogeneities in the quantification of MWF.Theory
A commonly used multi-exponential decay model [2] is extended into a dual-parameter (T2*-T1) model to account for the T1 saturation effect:$$y\left({{TE}_{i},\alpha_{j}}\right)={\iint{s\left({T_{2}^{*},T_{1}}\right)}}\frac{\left\lbrack{1-{\exp\left({-{{TR}/T_{1}}}\right)}}\right\rbrack{\sin\left.\left(\alpha\right._{j}\right.)}}{1-{\cos{\left(\alpha_{j}\right){\exp\left({-{{TR}/T_{1}}}\right)}}}}{{\exp}\left({-{{TE}_{i}/T_{2}^{*}}}\right)}dT_{2}^{*}dT_{1},\tag{1}$$
where $$$y\left({{TE}_{i},\alpha_{j}}\right)$$$ is the DFA-mGRE datasets of a voxel at echo time $$${TE}_{i}$$$ with flip angle $$$\alpha_{j}$$$, $$$s\left({T_{2}^{*},T_{1}}\right)$$$ denotes the fraction of the water component with a known $$$T_{2}^{*}$$$ and $$$T_{1}$$$ value.
After discretizing $$$\left.\left(T\right._{2}^{*},T_{1}\right)$$$ into $$$n$$$ different value pairs $$$\left.\left(T\right._{2p}^{*},T_{1p}\right.)$$$, Eq. (1) can be simplified into a linear model:
$$\begin{matrix}{\mathbf{y}=\mathbf{A}*\mathbf{x}+\boldsymbol{\varepsilon},\tag{2}}\end{matrix}$$
where $$$\mathbf{y}$$$ is a vector representing the DFA-mGRE datasets of a voxel. $$$\mathbf{x}$$$ is a vector representing the fractions of different water components to be solved, $$$\boldsymbol{\varepsilon}$$$ represents the measurement noise. $$$\mathbf{A}\in\mathbb{R}^{md*n}$$$ is the T2*-T1 bases matrix:
$$\mathbf{A}\left({i+mj-m,p}\right)=\frac{\left\lbrack{1-{\exp\left({-{{TR}/T_{1p}}}\right)}}\right\rbrack{\sin\left.\left(\alpha\right._{j}\right.)}}{1-{\cos{\left(\alpha_{j}\right){\exp\left({-{{TR}/T_{1p}}}\right)}}}}{\exp\left({-{{TE}_{i}/T_{2p}^{*}}}\right)},\tag{3}$$
where $$$i$$$ ranges from 1 to $$$m$$$, $$$j$$$ ranges from 1 to $$$d$$$, $$$p$$$ ranges from 1 to $$$n$$$. $$$m$$$ is the number of acquired echoes and $$$d$$$ is the number of flip angles.
Instead of estimating the spectrum voxel-by-voxel, we incorporate a joint sparsity constraint of the T2*-T1 spectrum of all voxels to reduce the degrees of freedom of the solution. The optimization problem can be described by:
$${\min\limits_{\mathbf{X}}\left\|\mathbf{X}\right\|_{2,1}}\triangleq~~{\sum\limits_{p=1}^{n}\left\|\mathbf{X}^{p}\right\|_{2}},~s.t.\mathbf{A}\mathbf{X}=\mathbf{Y},\mathbf{X}\geq0,\tag{4}$$
where $$$\mathbf{X}\in\mathbb{R}^{n*l}$$$ represents the joint sparse solution of all voxels, $$$l$$$ is the number of voxels. $$$\left\|\mathbf{X}\right\|_{2,1}$$$ is the L2,1-norm of $$$\mathbf{X}$$$. $$$\mathbf{X}^{p}\in\mathbb{R}^{l}$$$ is the p-th row vector of $$$\mathbf{X}$$$, and regarded as an independent group representing a particular water component. $$$\mathbf{Y}\in\mathbb{R}^{md*l}$$$ is a matrix representing the stacked DFA-mGRE datasets of all voxels. Problem (4) can be solved using an alternating direction method [3].
To correct for B1+/B1− inhomogeneities, the image intensity $$$y$$$ need to be corrected before running the JMSE algorithm:
$$\hat{y}=~y\cdot{B_{cor}},\begin{matrix}{B_{cor}=~\frac{{\sin(\alpha)}\left\lbrack{1-{\cos{\left({B_{1}^{+}\alpha}\right){\exp\left({-{{TR}/T_{1}}}\right)}}}}\right\rbrack}{B_{1}^{-}{\sin{\left({B_{1}^{+}\alpha}\right)\left\lbrack{1-{\cos{(\alpha){\exp\left({-{{TR}/T_{1}}}\right)}}}}\right\rbrack}}}.\tag{5}}\end{matrix}$$
where $$$\hat{y}$$$ is the image intensity with B1 correction. B1+ map was estimated using Fatouros’ approximation [4] and local quadratic fitting. B1− map was estimated by FSL [5].
Methods
The dual-flip-angle multi-gradient-echo (DFA-mGRE) sequence with an SOS trajectory is shown in Fig. 1(a). Nine healthy subjects were scanned on a 3T scanner (uMR790, United Imaging Healthcare, Ltd., Shanghai, China) using the DFA-mGRE sequence with Cartesian (15.4 minutes), fully-sampled SOS (full-SOS, 24.3 minutes), and prospectively under-sampled SOS (pr-SOS, 2 minutes) sampling. Cartesian measurements were treated as the reference. The pr-SOS was repeated twice (pr1-SOS, pr2-SOS) for the test-retest analysis. The protocol was approved by the Institutional Human Ethics Committee. Written consents were obtained before each scan. The FOV was 240 mm × 240 mm × 132 mm with the voxel size of 1 mm × 1 mm × 3 mm. The flip angles were 5° and 26°. The TR was 43.8 ms. Twenty echoes were acquired with the first echo time of 2 ms. The echo space was 2 ms. Images acquired by retrospectively under-sampled SOS (re-SOS) and pr-SOS were reconstructed using a subspace-based algorithm [6, 7] with a locally low-rank constraint [8] to explore the global and local similarities of the DFA-mGRE datasets, as shown in Fig. 1(c).Results
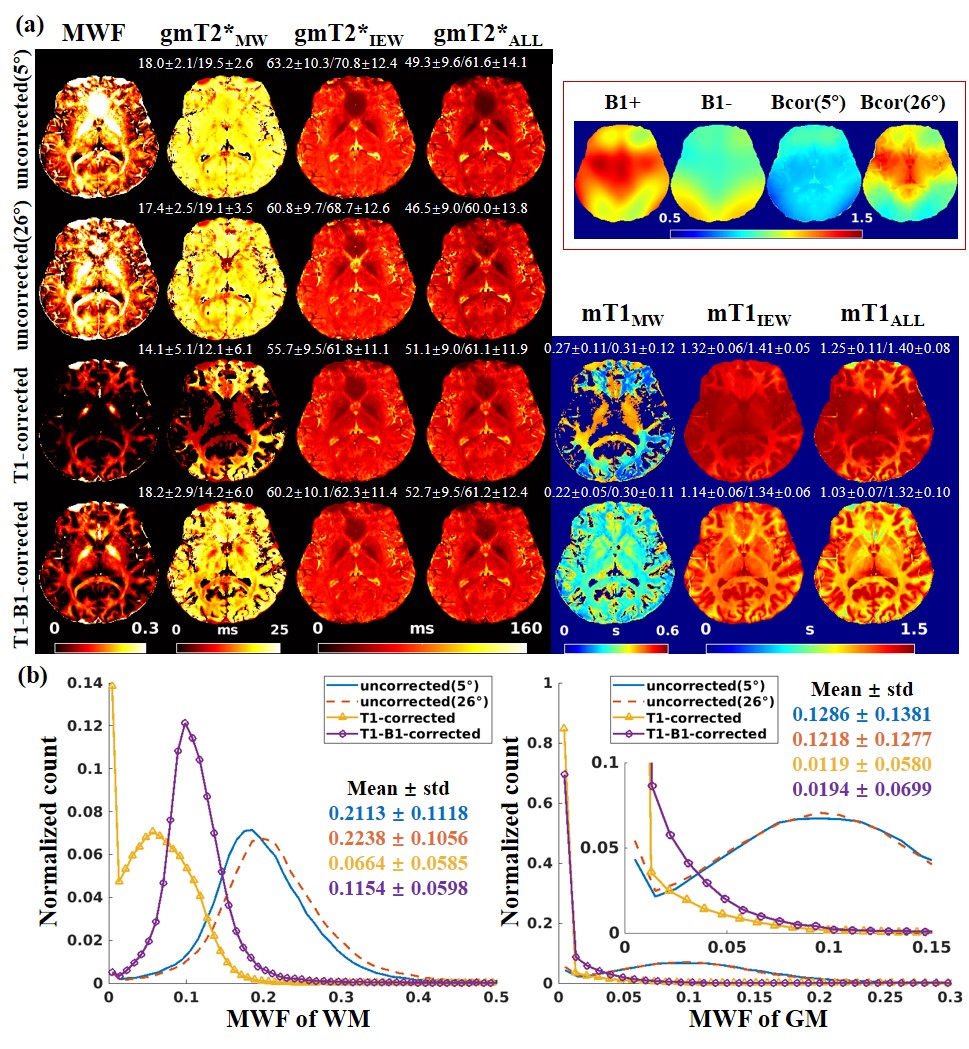
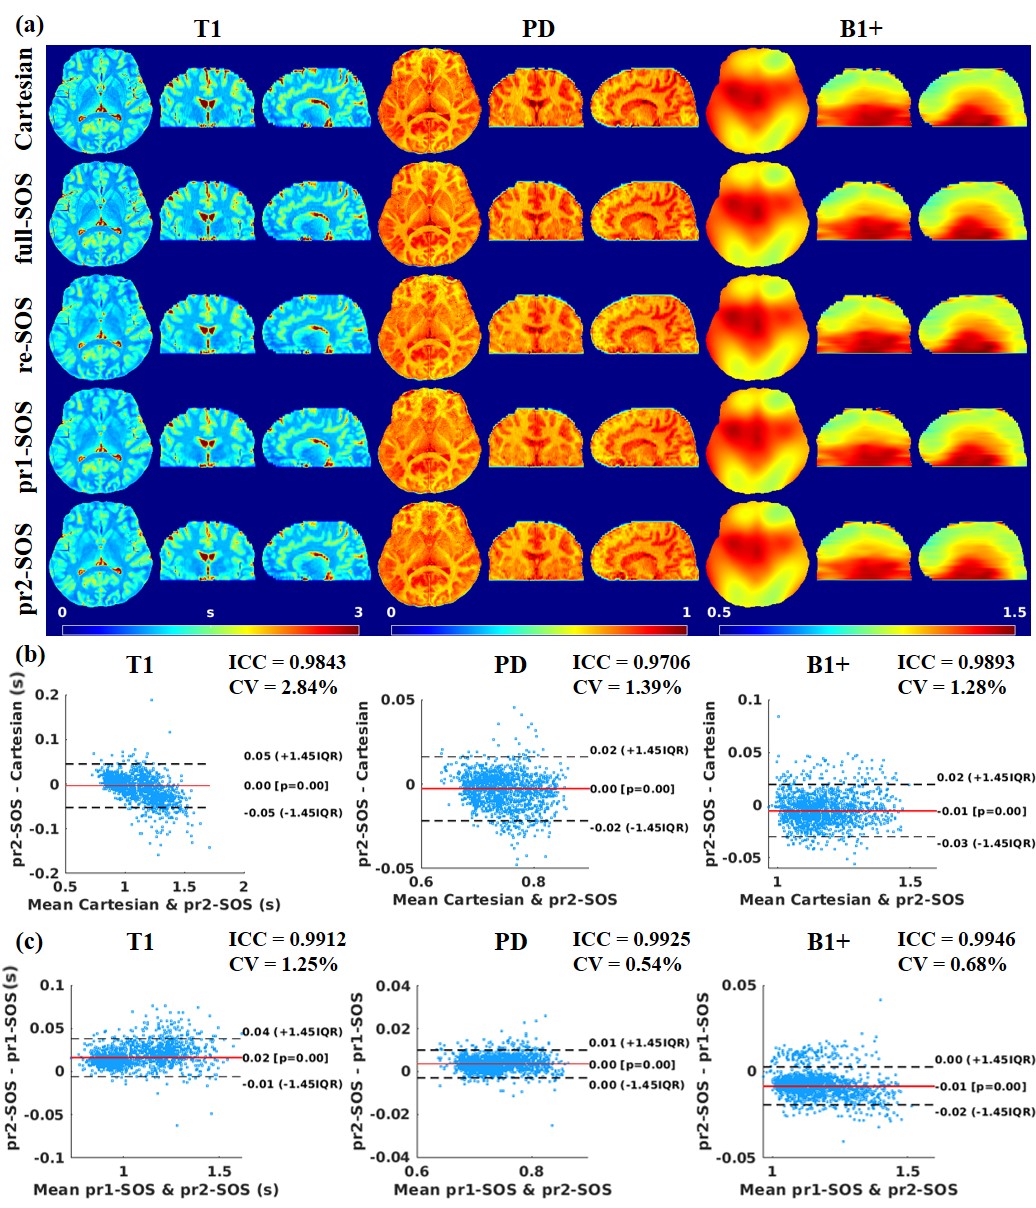
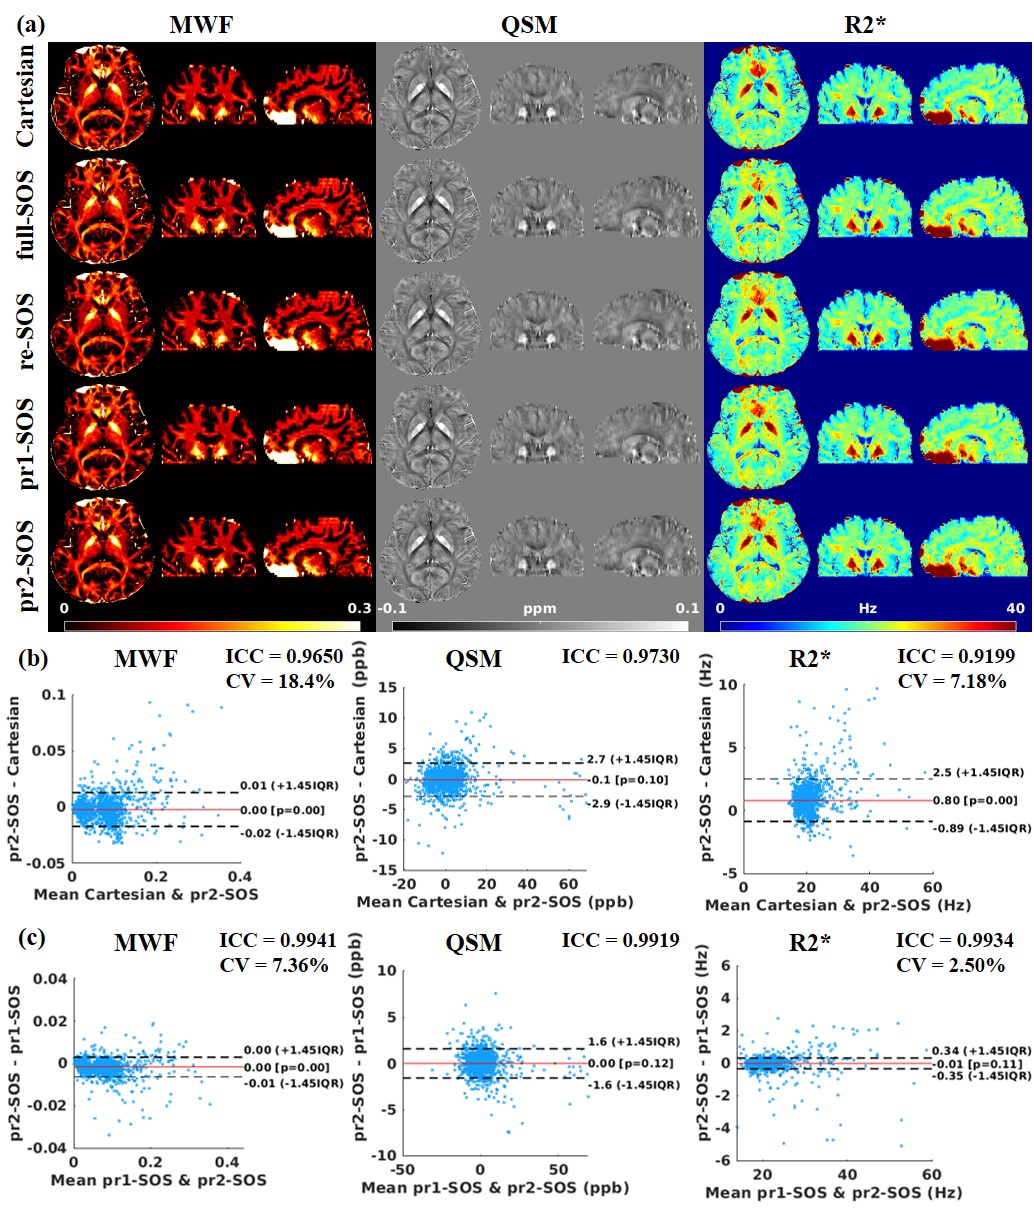
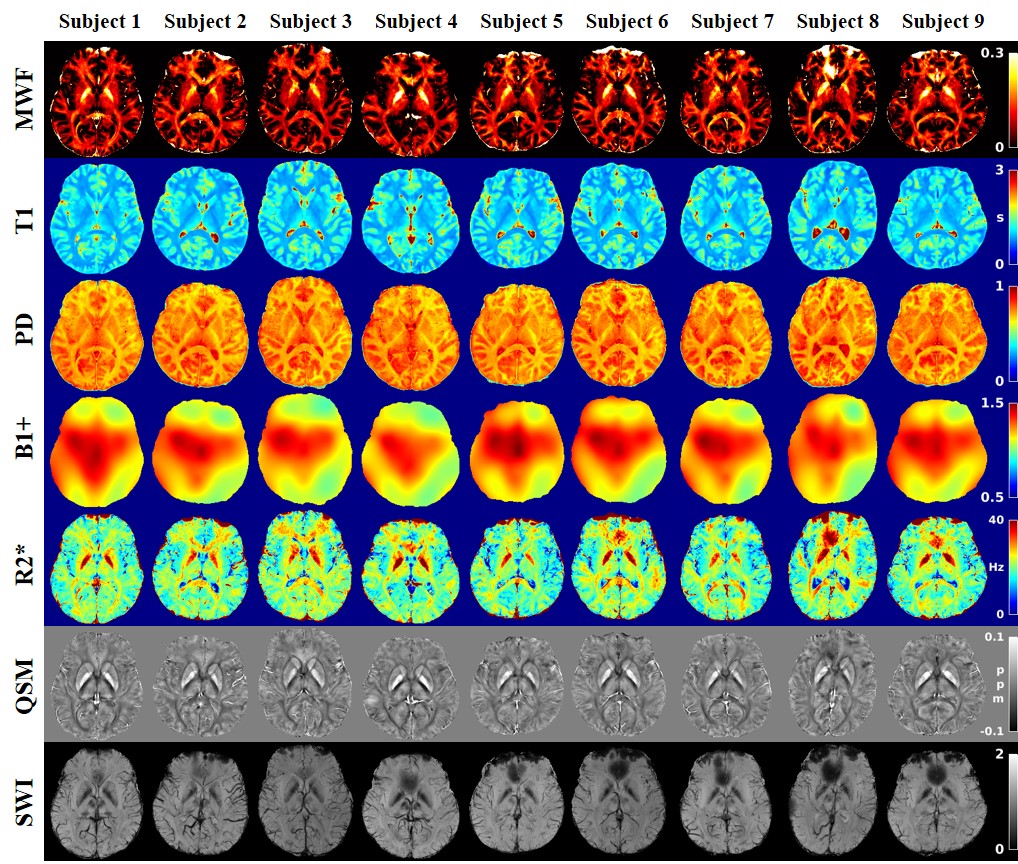
The uncorrected MWF was higher overall than the T1-B1-corrected MWF. The T1-corrected MWF was lower than the T1-B1-corrected MWF in regions where B1+ value was greater than one, as shown in Fig. 2. The mean MWF values of white matter (WM)/gray matter (GM) after T1-B1 correction (0.1154/0.0194) were closer to literature values (0.100/0.028) [9], (0.113/0.031) [10]. In the in vivo study, 155 ROIs were obtained after segmentation using Freesurfer [11] for each subject. Results of pr-SOS showed good agreement (intraclass correlation coefficient ICC > 0.91) with Cartesian reference, and good robustness (coefficient of variation CV < 7.4%) in the test-retest analysis, as shown in Fig. 3 and Fig. 4. The multiparametric maps and SWI images of nine healthy subjects with pr-SOS sampling acquired in two minutes are shown in Fig. 5.Discussion and Conclusions
The proposed JMSE algorithm can improve the quantification of MWF by correcting for the T1 saturation effect and B1+/B1− inhomogeneities. Our technique can provide robust mapping of 3D whole brain MWF, T1, PD, R2*, QSM, and B1+ in two minutes using the DFA-mGRE SOS sequence and subspace-based reconstruction, which has a great potential for clinical applications.Acknowledgements
This work was supported in part by the National Natural Science Foundation of China under Grant 81627901, in part by the Ministry of Science and Technology under Grant 2022YFB4702702, and in part by the Shanghai Science and Technology Commission Explorer Program under Grant 22TS1400300.References
[1] Seiler A, Nöth U, Hok P, Reiländer A, Maiworm M, Baudrexel S, Meuth S, Rosenow F, Steinmetz H, Wagner M, Hattingen E, Deichmann R, Gracien RM. Multiparametric Quantitative MRI in Neurological Diseases. Front Neurol. 2021;12:640239.
[2] Du YP, Chu R, Hwang D, Brown MS, Kleinschmidt-DeMasters BK, Singel D, Simon JH. Fast multislice mapping of the myelin water fraction using multicompartment analysis of T2* decay at 3T: a preliminary postmortem study. Magn. Reson. Med. 2007;58(5):865-870.
[3] Deng W, Yin W, Zhang Y. Group sparse optimization by alternating direction method. SPIE; 2013.
[4] Baudrexel S, Reitz SC, Hof S, Gracien RM, Fleischer V, Zimmermann H, Droby A, Klein JC, Deichmann R. Quantitative T1 and proton density mapping with direct calculation of radiofrequency coil transmit and receive profiles from two-point variable flip angle data. NMR Biomed. 2016;29(3):349-360.
[5] Zhang Y, Brady M, Smith S. Segmentation of brain MR images through a hidden Markov random field model and the expectation-maximization algorithm. IEEE Trans. Med. Imaging 2001;20(1):45-57.
[6] Tamir JI, Uecker M, Chen W, Lai P, Alley MT, Vasanawala SS, Lustig M. T2 shuffling: Sharp, multicontrast, volumetric fast spin-echo imaging. Magn. Reson. Med. 2017;77(1):180-195.
[7] He J, Liu Q, Christodoulou AG, Ma C, Lam F, Liang ZP. Accelerated High-Dimensional MR Imaging With Sparse Sampling Using Low-Rank Tensors. IEEE Trans. Med. Imaging 2016;35(9):2119-2129.
[8] Zhang T, Pauly JM, Levesque IR. Accelerating parameter mapping with a locally low rank constraint. Magn. Reson. Med. 2015;73(2):655-661.
[9] Chen Q, She H, Du YP. Improved quantification of myelin water fraction using joint sparsity of T2* distribution. J. Magn. Reson. Imaging 2020;52(1):146-158.
[10] Whittall KP, MacKay AL, Graeb DA, Nugent RA, Li DK, Paty DW. In vivo measurement of T2 distributions and water contents in normal human brain. Magn. Reson. Med. 1997;37(1):34-43.
[11] Reuter M, Rosas HD, Fischl B. Highly accurate inverse consistent registration: a robust approach. Neuroimage 2010;53(4):1181-1196.
[12] Alonso-Ortiz E, Levesque IR, Pike GB. Multi-gradient-echo myelin water fraction imaging: Comparison to the multi-echo-spin-echo technique. Magn. Reson. Med. 2018;79(3):1439-1446.
Figures
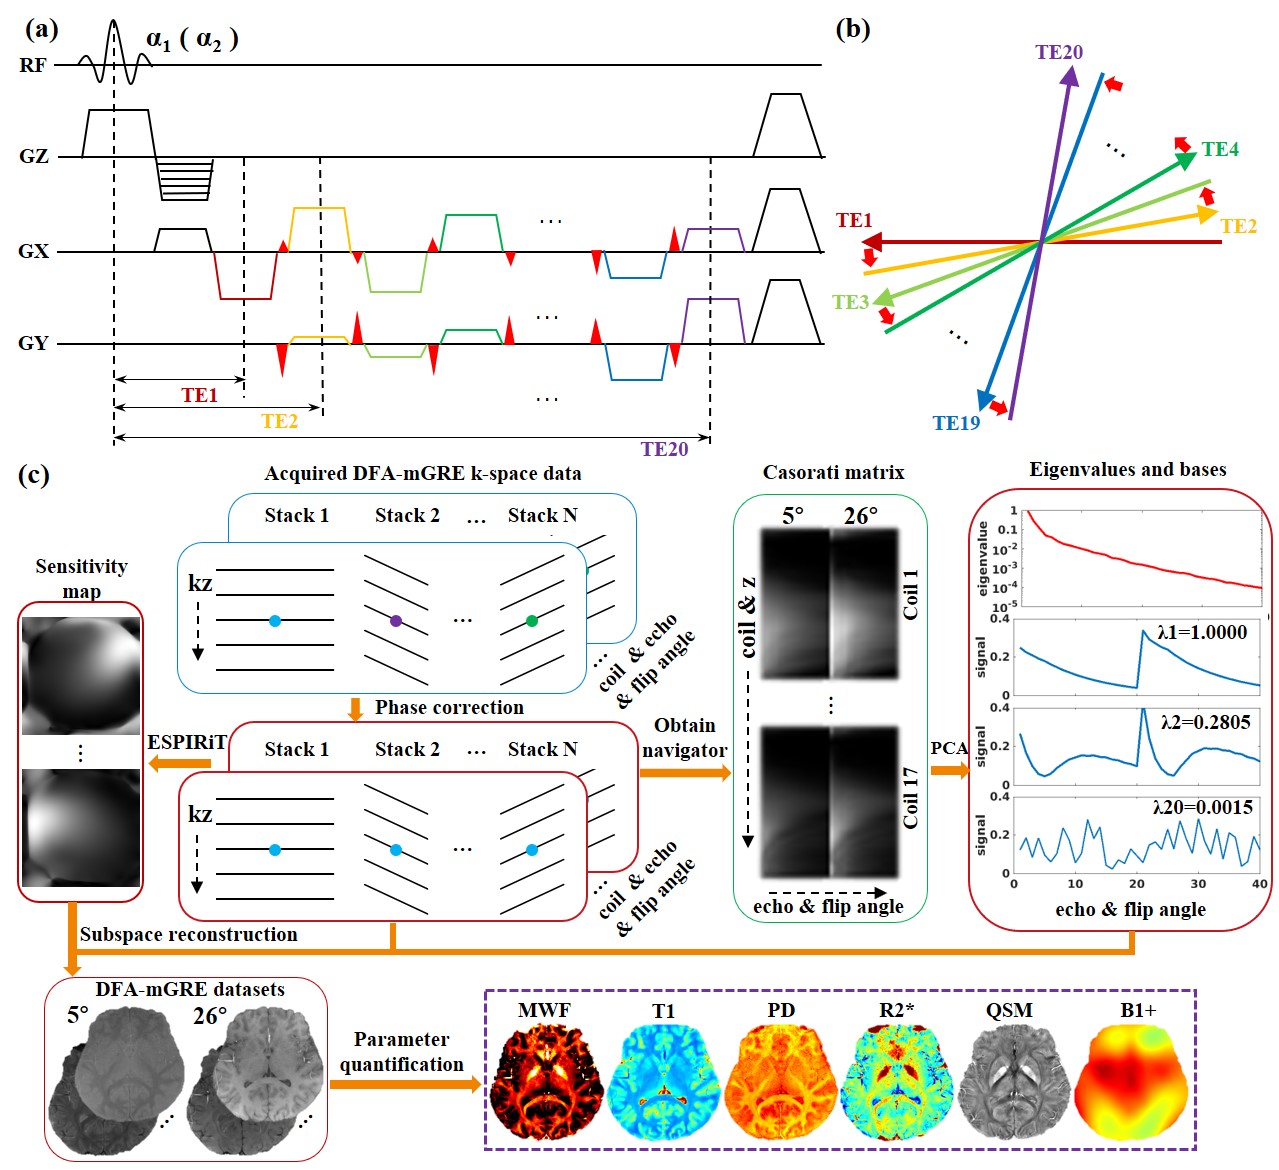
Fig. 1. (a) Diagram of the DFA-mGRE sequence with an SOS trajectory. Blip gradients represented by red triangles were inserted between readout gradients. (b) Spokes between adjacent echoes were rotated by 2°. (c) Image reconstruction pipeline of re-SOS and pr-SOS.