0572
Influence of fat droplet size on liver R2* relaxometry by Monte Carlo simulation and phantom studies1School of Biomedical Engineering, Anhui Medical University, Hefei, China, 2Department of Radiology, the First Affiliated Hospital of Anhui Medical University, Hefei, China, 3Anhui Public Health Clinical Center, Hefei, China, 4Department of Radiology, University of Wisconsin, Madison, WI, United States, 5Department of Medical Physics, University of Wisconsin, Madison, WI, United States, 6Department of Biomedical Engineering, University of Wisconsin, Madison, WI, United States, 7Department of Medicine, University of Wisconsin, Madison, WI, United States, 8Department of Emergency Medicine, University of Wisconsin, Madison, WI, United States
Synopsis
Keywords: Quantitative Imaging, Liver, R2*; fat droplet size; Monte Carlo simulations; phantom
Motivation: Liver fat (hepatic steatosis) can confound R2*-based iron quantification in chemical shift encoded MRI, while the size of fat droplets may also affect liver R2*. However, it is infeasible to experimentally investigate the influence of fat droplet size in vivo on liver R2* due to tissue complexity.
Goal(s): To investigate the influence of fat droplet size on liver R2* at both 1.5T and 3.0T.
Approach: Monte Carlo simulation and phantom studies.
Results: Liver R2* demonstrates a positive linear relationship with proton density fat fraction and remains relatively unaffected by fat droplet size.
Impact: These findings may benefit phantom design and understanding of the underlying mechanisms of R2* characteristics in the presence of hepatic steatosis.
Introduction
Liver fat (hepatic steatosis) is a common pathological manifestation of many diffuse liver diseases, and may lead to fibrosis, cirrhosis and even liver cancer1. Chemical shift encoded (CSE) techniques have been widely applied to liver fat and iron quantification, and a mild dependence, with strong correlation between proton density fat fraction (PDFF) and R2* is reported for obese patients without iron overload2. Fat droplet size shows differences in human liver3, and hepatic steatosis can be classified as microsteatosis or macrosteatosis according to fat droplet size4. The size of fat droplets theoretically affects R2*, however, it is impracticable to experimentally explore this effect in vivo due to tissue complexity. As an alternative, Monte Carlo simulations have been developed to predict liver R2* and PDFF by constructing virtual liver model and synthesizing MRI signals for hepatic steatosis5. In addition, fat-water phantoms are usually designed to mimic fat deposition6, and a promising method to study this effect by modulating fat droplet size. Therefore, the purpose of this work was to investigate the influence of fat droplet size on liver R2* by Monte Carlo simulation and phantom studies at both 1.5T and 3.0T.Methods
Monte Carlo simulation studySimilar to a previous study5, virtual liver models (Figure 1) were developed for various combinations of FF (2% to 40%) and fat droplet size (5 µm, 10 µm and 15 µm). Fat droplets were uniformly distributed within the model in a nonoverlapping manner. Monte Carlo simulations were performed by incorporating the virtual liver model, fat droplet distribution, magnetic field generation, proton movement, phase accrual, in order to synthesize MRI signals5. Finally, a validated signal model for CSE-MRI was adopted for predicting R2* and PDFF5,7.
Phantom study
Phantoms were constructed by modulating the volume ratio of water and fat solutions8. In water solution, 0.3 g sodium benzoate, 0.6 mL water-soluble surfactant (Tween 20), 0.24 mL gadopentetate dimeglumine and 9.0 g agar were added to 300 mL deionized water. 3.0 mL of oil-soluble surfactant (Span 80) was added to 300 mL peanut oil. Fifteen phantoms were created with combinations of five FFs (10%, 20%, 30%, 40% and 50%) and three fat droplet sizes (small size, medium size and large size). Fat droplet size was modulated by homogeneous emulsifier or magnetic stirring apparatus. Micrographs of phantoms were acquired using inverted fluorescence microscope, and fat droplet sizes were measured by Nano Measurer 1.2.5.
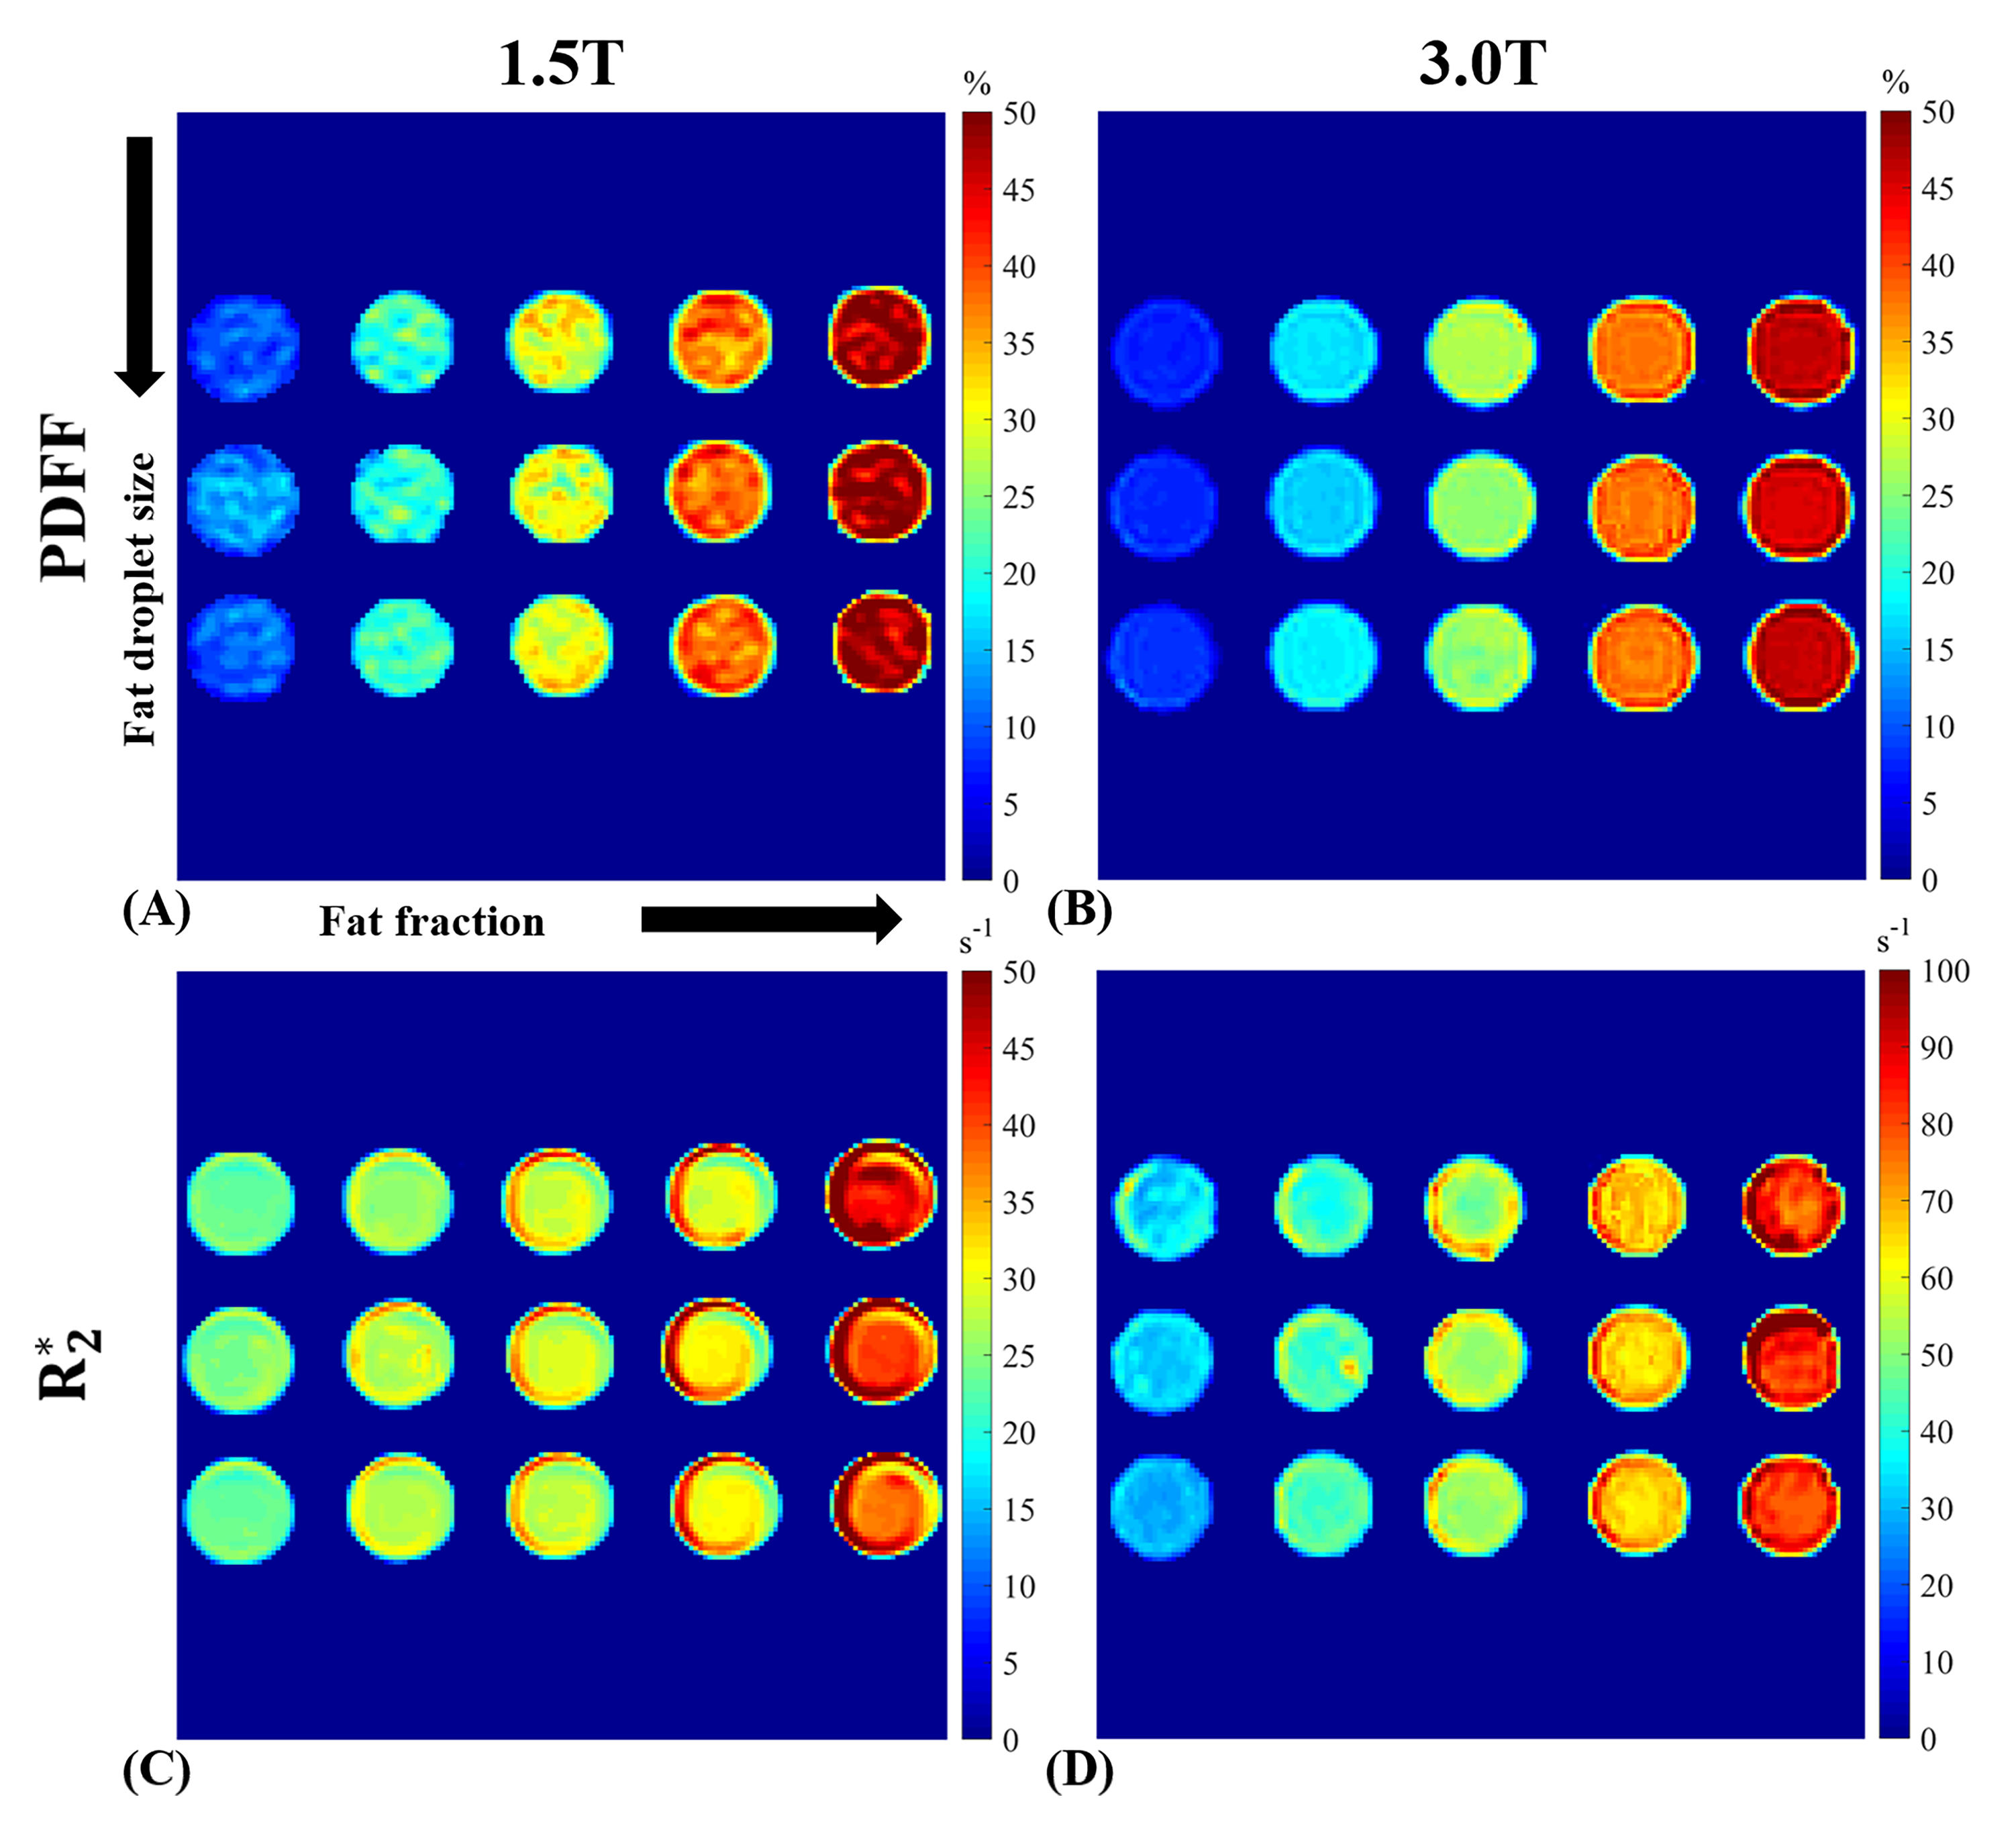
Phantoms were imaged at 1.5T (MAGNETOM Aera, Siemens Healthcare, Erlangen, Germany) and 3.0T (MAGNETOM Vida, Siemens Healthcare, Erlangen, Germany). CSE-MRI (LiverLab package) acquisition parameters included: slices=20, slice thickness=5 mm, FOV=36×36 cm2, matrix=160×160, echo number=6, TE1=2 ms (1.5T)/1.22 ms (3.0T), ∆TE=2 ms (1.5T)/1.24 ms (3.0T), TR=13.3 ms (1.5T)/10 ms (3.0T), flip angle=5º (1.5T)/3º (3.0T). R2* and PDFF maps were automatically generated on-line, and representative R2* and PDFF measurements for each phantom were calculated as the average over region of interest.
Statistical analysis
For Monte Carlo simulation and phantom studies, linear regression analysis was performed for R2* versus PDFF (i.e., predictions by simulations or measurements by MRI) and PDFF versus FF (i.e., truth FF in simulations or phantom ground truth). One-way repeated measures analysis of variance was used to evaluate the difference in R2* across different fat droplet sizes as well as PDFF across different fat droplet sizes. Results were considered statistical significance when p<0.05. Simulation and statistical analysis experiments were implemented using MATLAB.
Results
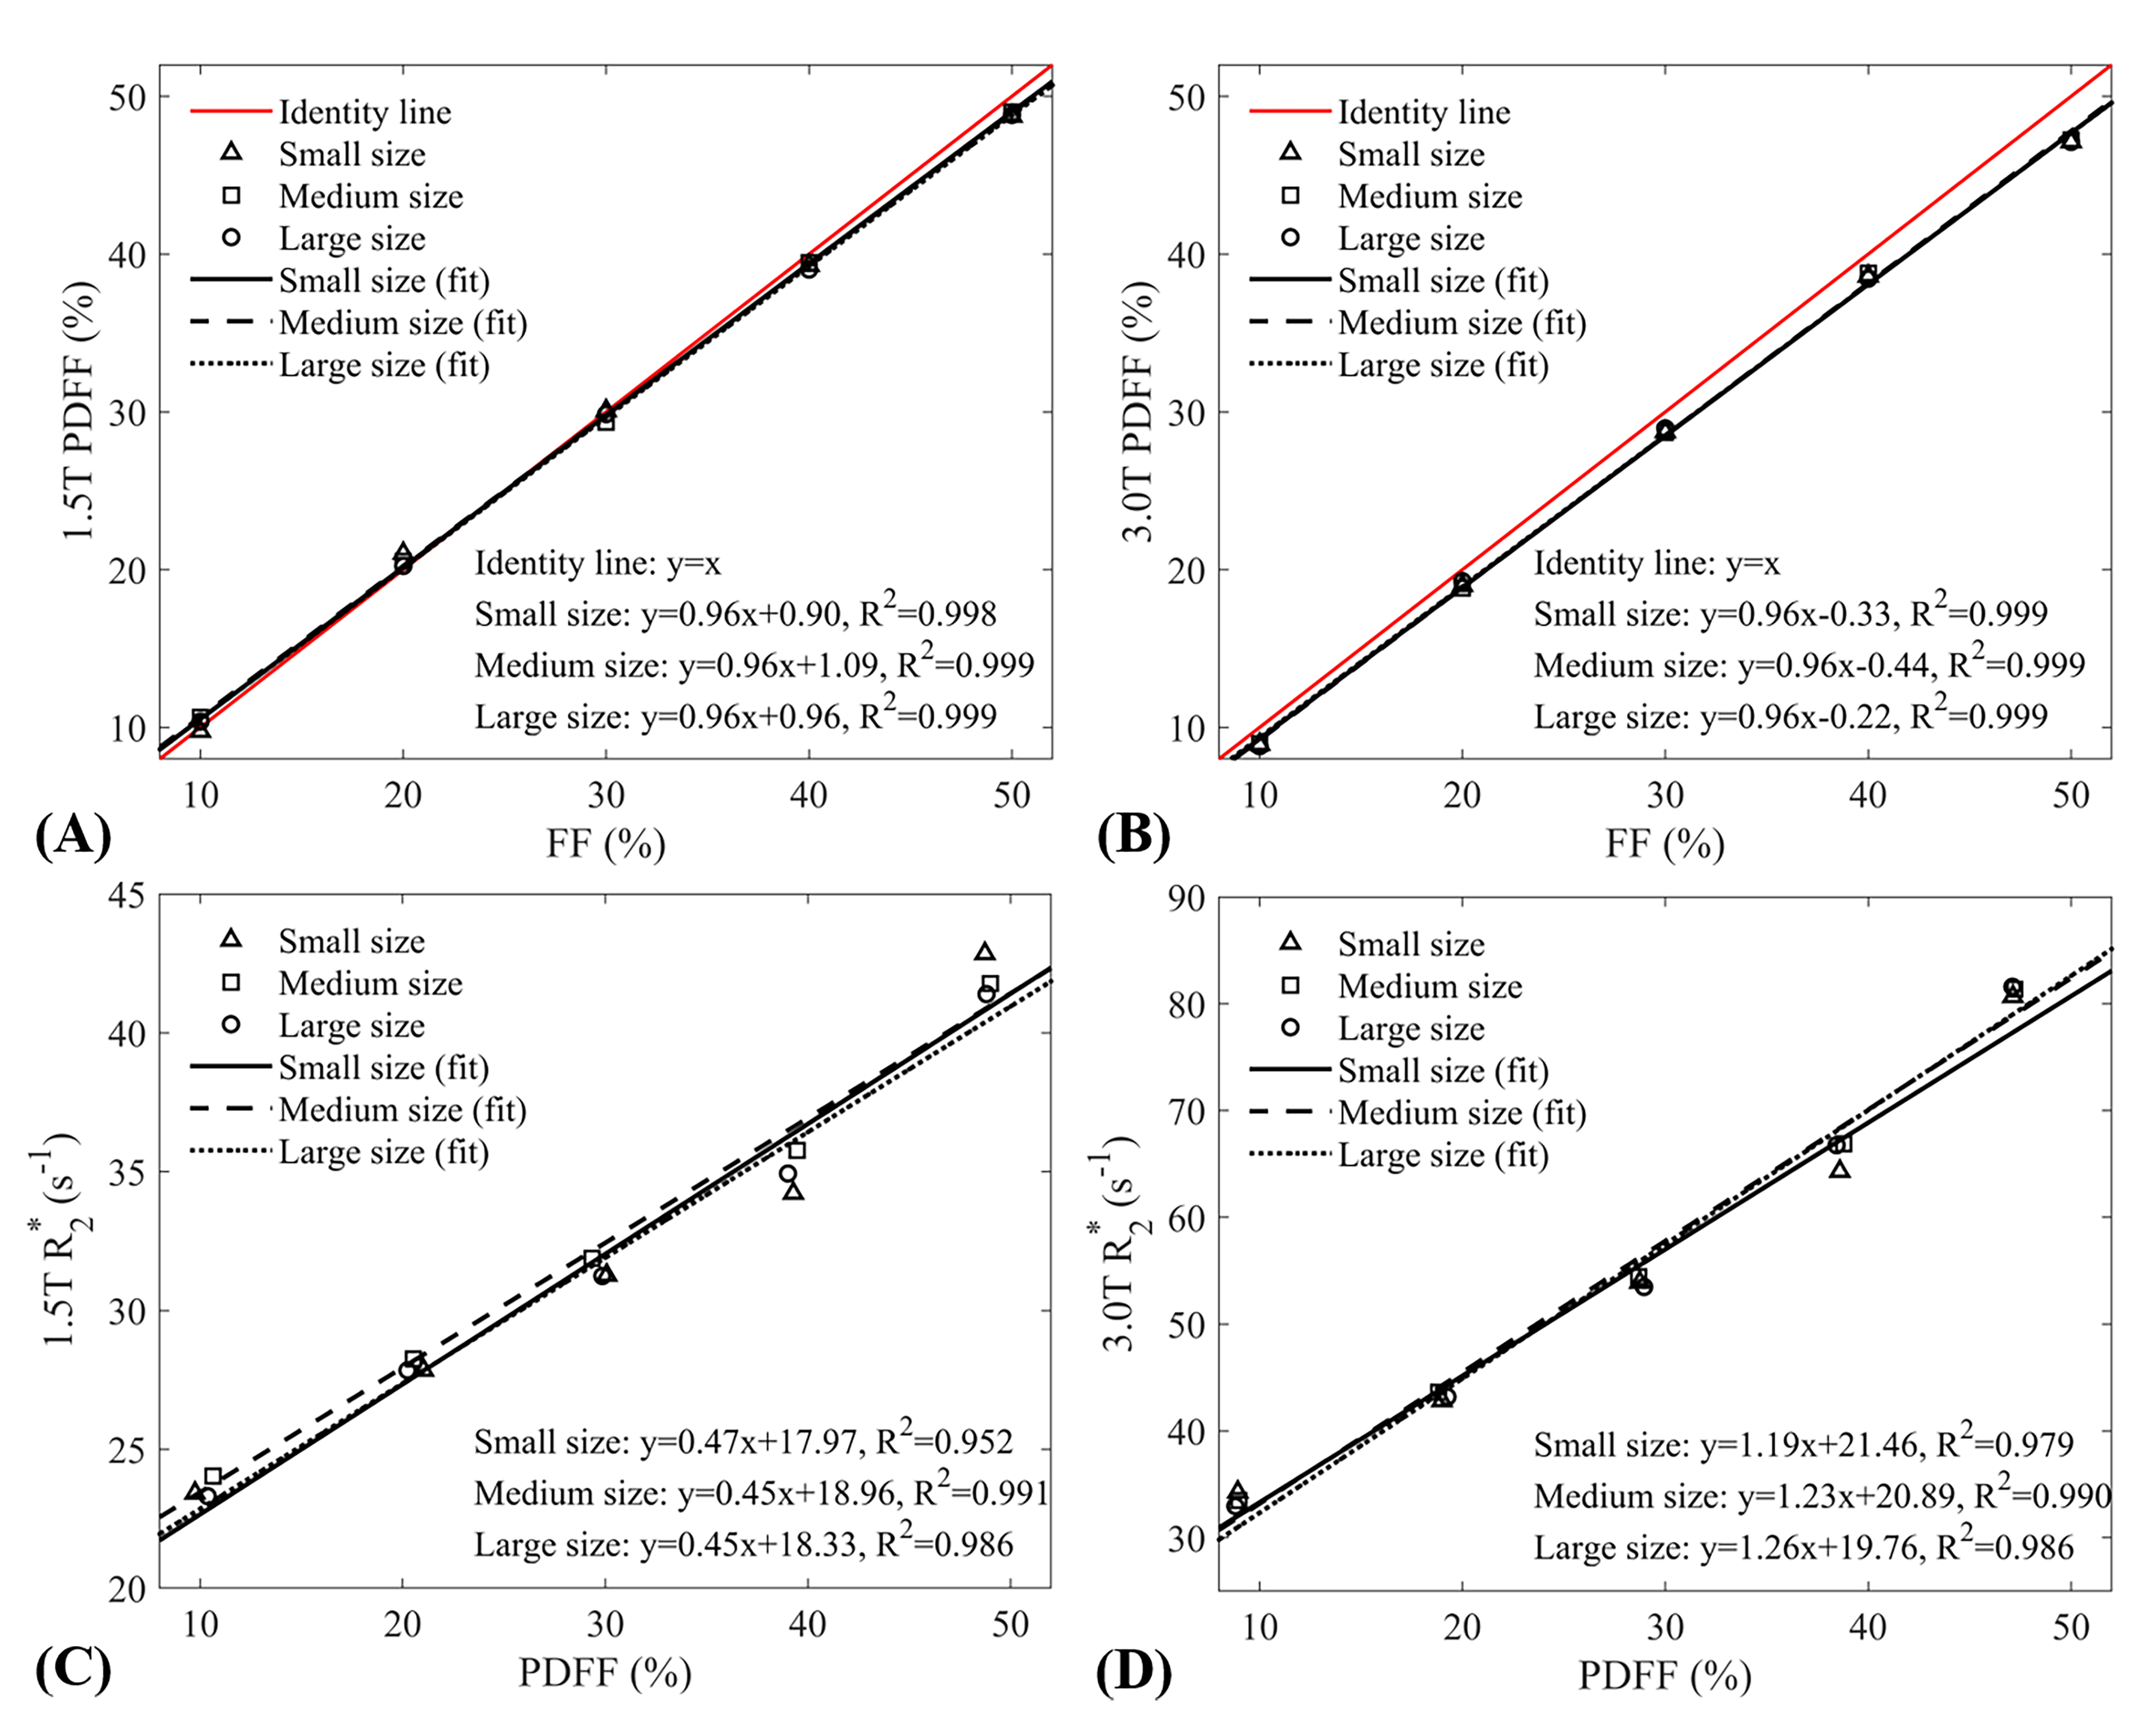
For Monte Carlo simulations, Figure 2 demonstrates that PDFF-FF and R2*-PDFF relationships were highly linear (R2≥0.976) and the slopes of these relationships were unaffected by fat droplet size (p≥0.617). Figure 3 shows micrographs of three phantoms with identical FF of 20% and different fat droplet sizes, and this indicates that fat droplet size was well modulated. Figure 4 demonstrates that PDFF and R2* maps were visually consistent across different fat droplet sizes. For phantom study, Figure 5 shows that PDFF-FF and R2*-PDFF relationships were highly linear (R2≥0.952) and the slopes of these relationships were also unaffected by fat droplet size (p≥0.223).Discussion & Conclusion
In this work, the influence of fat droplet size on liver R2* was investigated by Monte Carlo simulation and phantom studies at both 1.5T and 3.0T. Our work demonstrates that fat droplet size has no influence on liver R2*, which is consistent with previous experiments9. This study has two limitations. First, only simple random fat droplet distribution is considered in the simulation study. Second, fat droplet sizes in the phantoms are not entirely uniform. These findings may benefit phantom design and understanding of the underlying mechanisms of R2* behaviors in the presence of hepatic steatosis.Acknowledgements
This work receives support from the National Natural Science Foundation of China (62001005), the Anhui Provincial Natural Science Foundation (2008085QH425), the Grants for Scientific Research of BSKY (XJ201811) from Anhui Medical University, as well as the NIH (R01-EB031886, R01 DK083380, R01 DK088925, R01 DK100651 and K24 DK102595). The authors also wish to acknowledge support from GE Healthcare who provides research support to UW-Madison and the Medical Big Data Supercomputing Center System of Anhui Medical University for their assistance with numerical calculations. Further, Dr. Reeder is the John H. Juhl Endowed Chair of Radiology.
References
1. Yokoo T, Browning JD. Fat and iron quantification in the liver: past, present, and future. Top Magn Reson Imaging, 2014, 23(2): 73-94.
2. Hernando D, Haufe WM, Hooker CA, et al. Relationship between liver proton density fat fraction and R2* in the absence of iron overload. In proceedings of the 23rd Annual Meeting of ISMRM, 2015, Toronto, Canada. p. 4118.
3. Wang J, Li X, Ma M, et al. Monte Carlo modeling of hepatic steatosis based on stereology and spatial distribution of fat droplets. Comput Meth Prog Bio, 2023, 233(5): 107494.
4. Neil DAH, Minervini M, Smith ML, et al. Banff consensus recommendations for steatosis assessment in donor livers. Hepatology, 2022, 75(4): 1014-1025.
5. Wang C, Ratliff BA, Sirlin CB, et al. Monte Carlo modeling of liver MR signal in the presence of fat. In proceedings of the 27th Annual Meeting of ISMRM, 2018, Paris, France. p. 2264.
6. Bernard CP, Liney GP, Manton DJ, et al. Comparison of fat quantification methods: A phantom study at 3.0T. J Magn Reson Imaging, 2008, 27(1): 192-197.
7. Hernando D, Kramer JH, Reeder SB. Multipeak fat-corrected complex R2* relaxometry: Theory, optimization, and clinical validation. Magn Reson Med, 2013, 70(5): 1319-1331.
8. Bush EC, Gifford A, Coolbaugh CL, et al. Fat-water phantoms for magnetic resonance imaging validation: A flexible and scalable protocol. J Vis Exp, 2018, (139): e57704.
9. Weisskoff RM, Zuo CS, Boxerman JL, et al. Microscopic susceptibility variation and transverse relaxation: theory and experiment. Magn Reson Med, 1994, 31(6): 601-610.
Figures
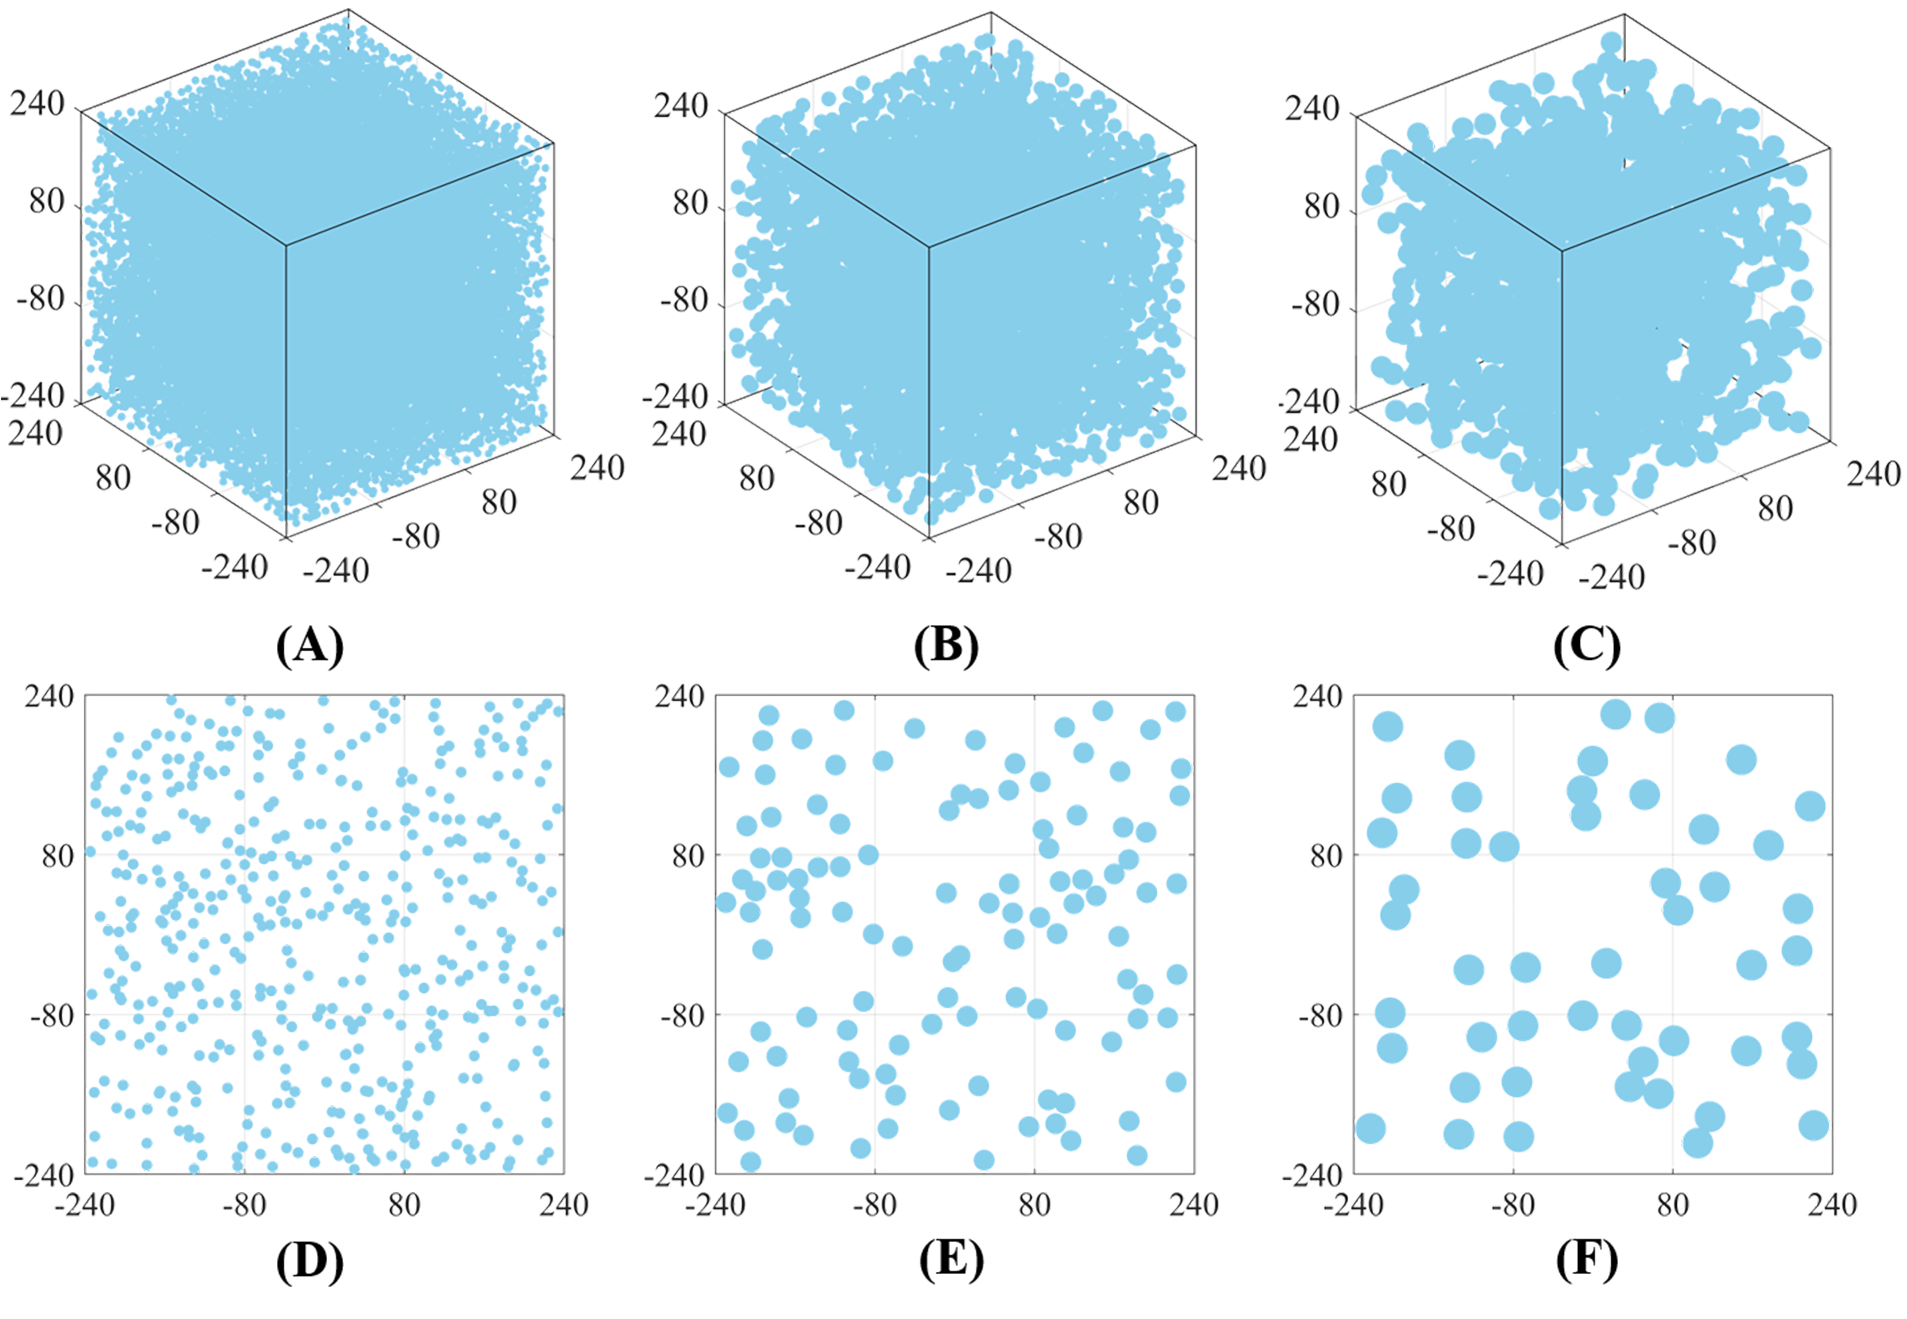
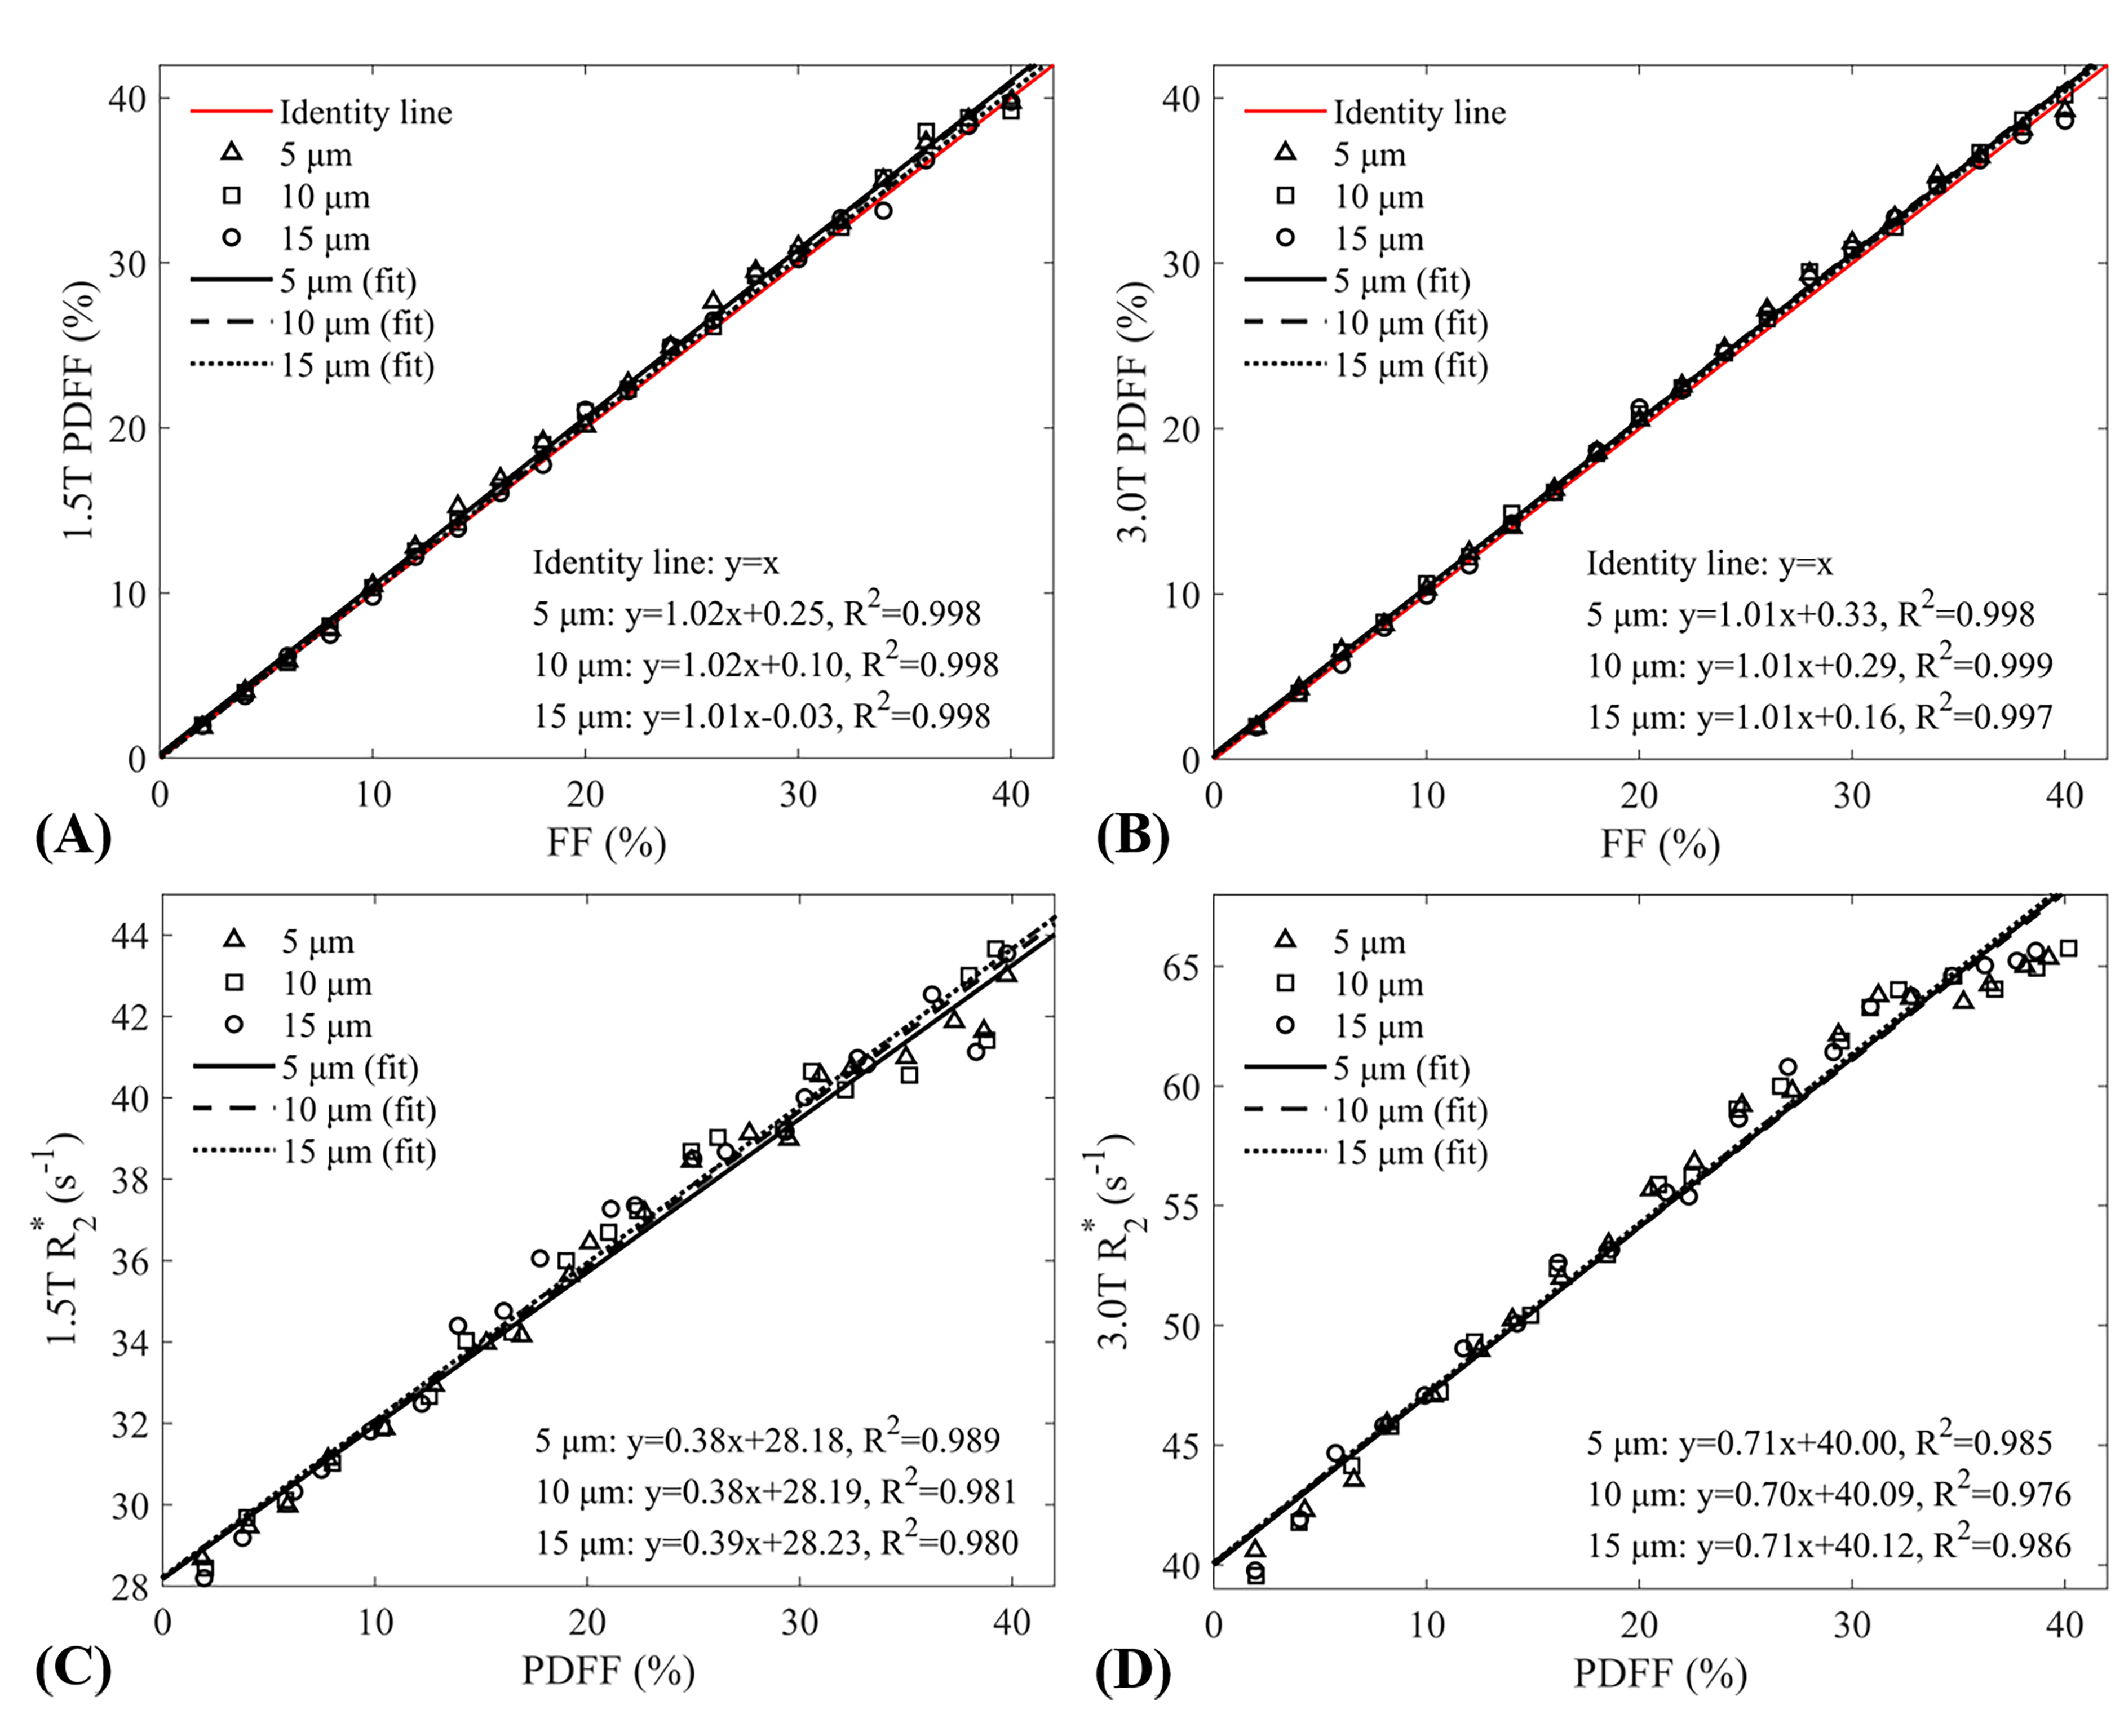
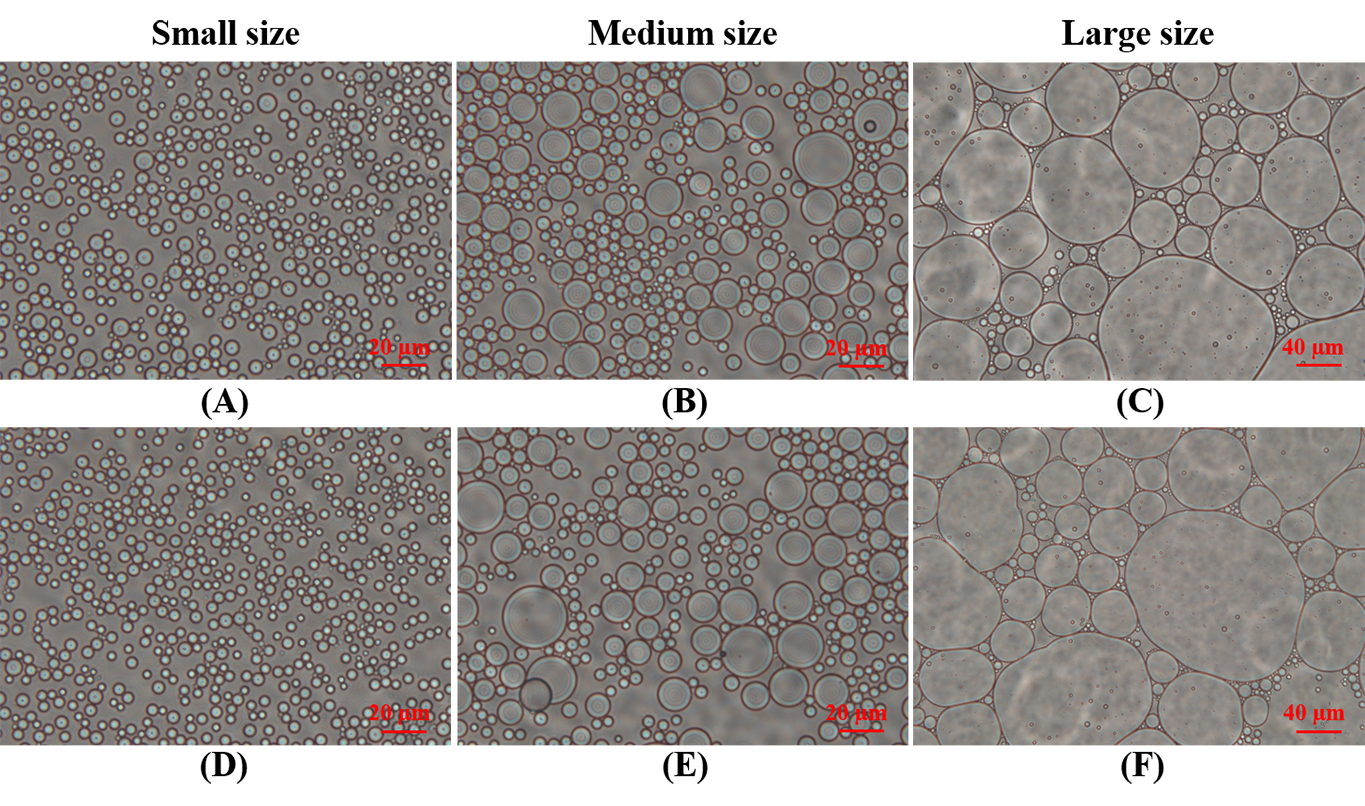
Figure 3. Micrographs of three phantoms with identical FF of 20% and different fat droplet sizes. Fat droplet sizes in each phantom were respectively controlled using homogenous emulsifier at rotational speed of 15000 rpm for two minutes (A, D) and 8000 rpm for one minute (B, E), as well as using magnetic stirring apparatus at rotational speed of 1000 rpm (C, F). Fat droplet sizes of the three phantoms were 2.01±0.61 μm, 3.71±1.97 μm and 10.28±12.12 μm, respectively.