0571
Magnetization transfer explains most variablity of T1-estimates in the MRI literature1Bernard and Irene Schwartz Center for Biomedical Imaging, Department of Radiology, New York University Grossman School of Medicine, New York NY, NY, United States, 2Center for Advanced Imaging Innovation and Research (CAI2R), Department of Radiology, New York University Grossman School of Medicine, New York, NY, United States
Synopsis
Keywords: Quantitative Imaging, Relaxometry, T1, MT, magnetization transfer
Motivation: T1-estimates vary substantially throughout the literature.
Goal(s): To provide evidence that magnetization transfer (MT) explains most of this variability.
Approach: We simulated 16 literature T1-mapping approaches with an MT model and fitted a T1-value to each simulated dataset. We then modified a global set of MT parameters to best explain the T1-variability.
Results: We found that MT explains 71% of the literature's T1-variability. The largest reduction and minimal Bayesian and Akaike information criteria were achieved when incorporating two recent advances in MT modeling: describing the semi-solid pool's spin dynamics with the generalized Bloch model and removing commonly-used constraints on the semi-solid pool's T1.
Impact: Our results suggest that T1 should be considered a semi-quantitative metric in biological tissue, meaning comparisons between different T1-mapping methods and validations in doped-water phantoms are of limited value.
Introduction
Quantitative $$$T_1$$$-mapping promises objective assessment of the biochemical environment. However, decades of research have failed to provide a consensus $$$T_1$$$-mapping approach and reported values vary substantially throughout the literature, ranging from 0.6–1.1s in brain white matter (WM). This variability has previously been recognized1–4 and various explanations were hypothesized, including $$$B_1$$$-inhomogeneities,1 incomplete RF-spoiling,1 and magnetization transfer (MT).2,4 Previous studies analyzed the MT effect in individual $$$T_1$$$-mapping approaches.2,4,5 Here, we analyze a diverse set of approaches and demonstrate that MT explains 71% of the literature's $$$T_1$$$-variability. We show that the variability is best explained when incorporating two recent advances in MT modeling: the generalized Bloch model to describe the spin dynamics of the semi-solid pool6 and the discovery that $$$T_1$$$ differs substantially between the two spin pools.7–11Methods
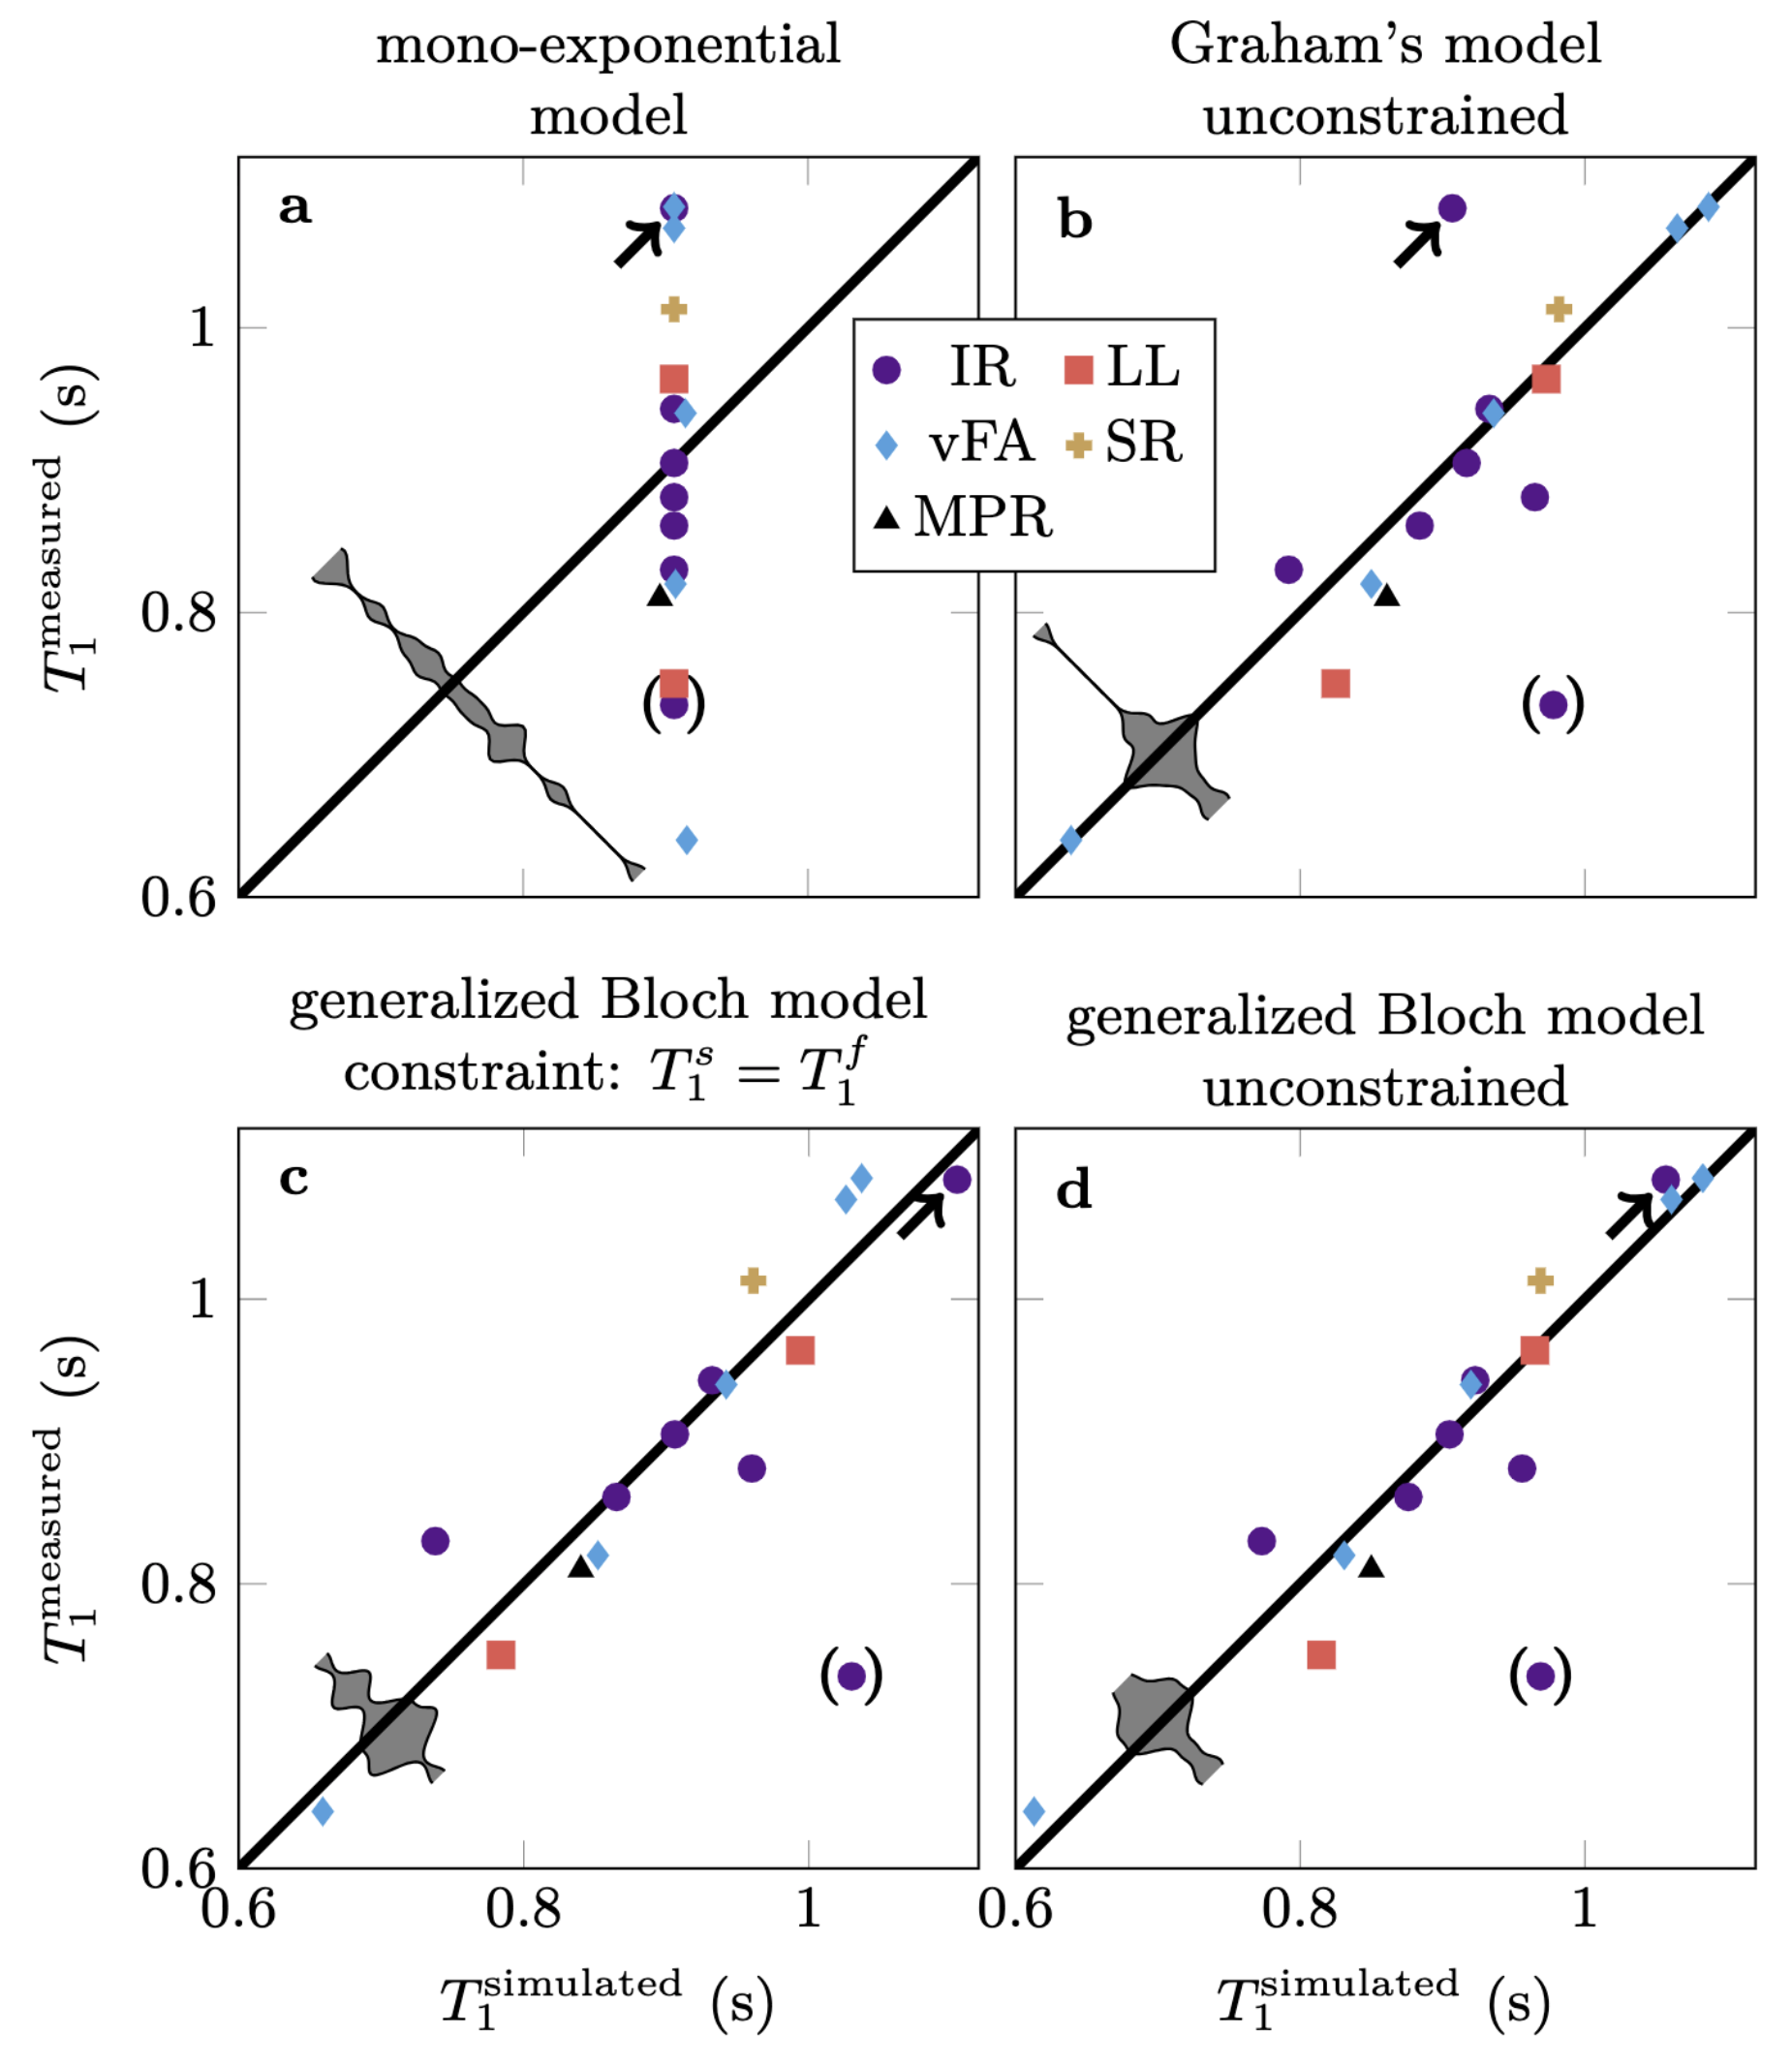
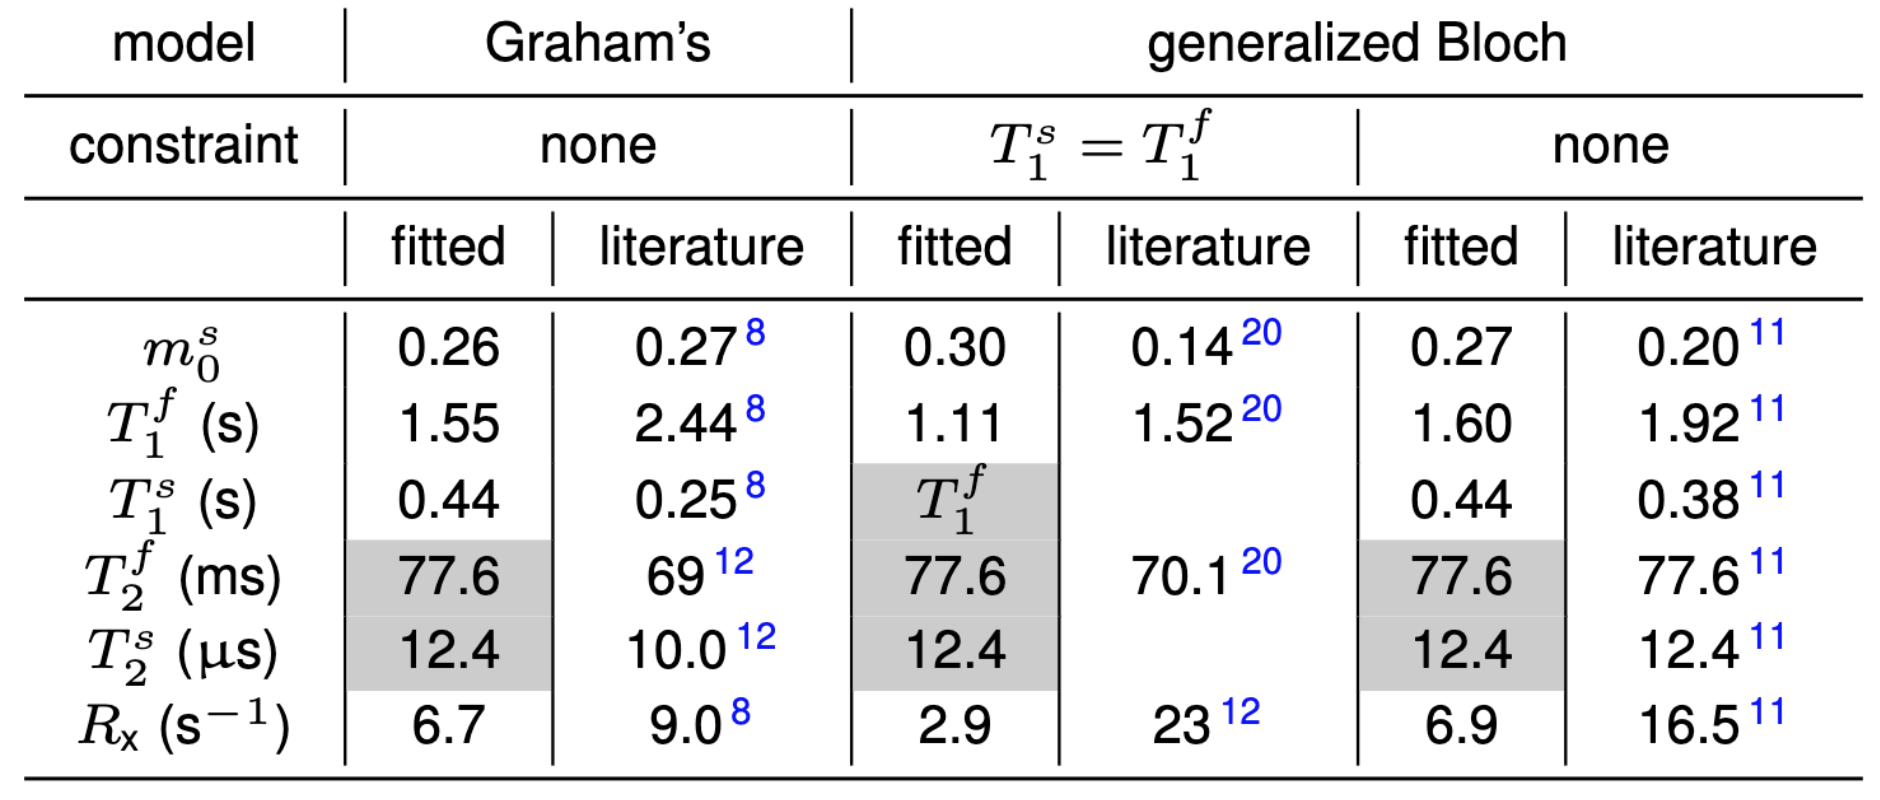
We focus here on $$$T_1$$$-mapping of brain WM at 3T. We selected 16 $$$T_1$$$-mapping approaches described in the literature, including different implementations of inversion-recovery,1,5,12–15 Look-Locker,1,14 saturation-recovery,5 variable flip angle,1,4,13,16 and MP2RAGE.17 We used various MT models to simulate the dynamics of a coupled 2-pool system during each pulse sequence, neglecting imaging gradients and assuming complete spoiling and perfect $$$B_0$$$ and $$$B_1^+$$$ fields. We estimated $$$T_1$$$ from the simulated data with the fitting procedures described in respective publications. Considering all $$$T_1$$$-mapping approaches jointly, we used least-squares fitting to estimate a global set of MT parameters that best explains the $$$T_1$$$-variability. We considered one approach15 an outlier (brackets in Fig. 1) and excluded it from all analyses.We simulated each pulse sequence with 4 models: a mono-exponential model, Graham's spectral MT model,6,18 and the generalized Bloch MT model.6 The latter was simulated twice, with the commonly-used constraint $$$T_1^s=T_1^f$$$, i.e., assuming equal relaxation times for both pools, and without this constraint. Further, we fixed the transversal relaxation times in all fits (Tab. 2).
Results
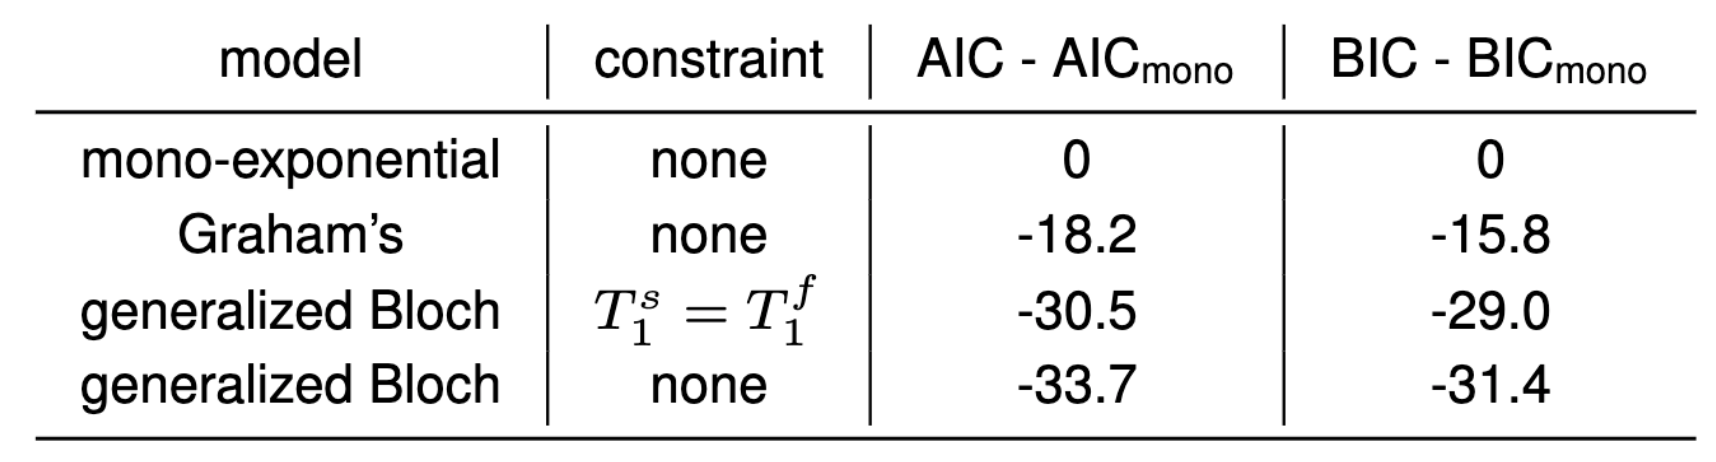
The variability of $$$T_1$$$-estimates across the literature is illustrated by the spread along the y-axis in Fig. 1a, which has a 14% coefficient of variation. The small span along the x-axis indicates that a mono-exponential model fails to explain the $$$T_1$$$-variability and the fit effectively returned the mean $$$T_1$$$, apart from minor deviations that relate to approximate fitting procedures and $$$T_2$$$-relaxation during finite RF-pulses. In contrast, all MT models are capable of explaining most $$$T_1$$$-variability (b–d). However, some differences remain: Graham's spectral model18 does not adequately describe the spin dynamics during a 10µs inversion-pulse6,10,12 (arrows in Fig. 1), which is overcome by the generalized Bloch model (c-d). Further, the common constraint $$$T_1^s=T_1^f$$$ results in larger residuals compared to the unconstrained fit (c vs. d). Comparing the residuals of the mono-exponential to the unconstrained generalized Bloch fit, we observe a 71% reduction of the root-mean-squared sum of the residuals.The Akaike and Bayesian information criteria in Tab. 1 indicate that an unconstrained fit with the generalized Bloch model best explains the $$$T_1$$$-variability. This is also supported by a comparison of the fitted MT parameters to literature values (Tab. 2). We observe a substantial mismatch when enforcing the constraint $$$T_1^s=T_1^s$$$, which is substantially reduced when removing this constraint. However, a mismatch in $$$R_\text{x}$$$ remains.
Discussion
A link between MT and $$$T_1$$$-relaxation was already suggested by Koenig et al.19 However, mono-exponential $$$T_1$$$-mapping dominates the relaxometry literature, likely driven by time constraints in clinical imaging. Our analysis suggests that the reported $$$T_1$$$-variability is dominated by fundamental model over-simplifications rather than experimental imperfections. This suggests that $$$T_1$$$ in biological tissue is a semi-quantitative metric that fundamentally depends on the imaging technique and questions both the search for common ground and validations of $$$T_1$$$-mapping techniques in simplistic spin systems such as doped-water phantoms.Our findings are consistent with recent literature7–11 that identified MT as a key driver of longitudinal relaxation by pointing at the substantial difference of $$$T_1$$$ between the two spin pools. In such a model, the native $$$T_1$$$ of the observed spins is approximately 2s,8,11 rather than the commonly observed 0.6–1.1s, and the difference between these values largely stems from MT. The MT effect sensitively depends on the applied RF pulses, which explains the dependency of the observed $$$T_1$$$ on the pulse sequence.
The drawbacks of $$$T_1$$$'s semi-quantitative nature can be addressed in different ways: Teixeira et al. proposed a modified variable flip angle approach and suggested qualifying $$$T_1$$$-estimates with the applied RF power,4 which identifies comparable $$$T_1$$$-estimates. However, further work is required to identify connections across the diverse zoo of $$$T_1$$$-mapping methods. An alternative path is the exploration of quantitative MT in search of quantitative biomarkers that depend less on acquisition details.
Acknowledgements
The author would like to thank Drs. Stanisz, Marques, Teixeira, Malik, Michal, Reynolds, Boudreau, Leppert, Stikhov, van Zijl, and Shin for providing details about the implementation of their pulse sequences and fitting routines.
This work was performed under the rubric of the Center for Advanced Imaging Innovation and Research (CAI2R), an NIBIB National Center for Biomedical Imaging and Bioengineering (NIH P41 EB017183).
References
1. N Stikov, et al., On the accuracy of T1 mapping: Searching for common ground. Magn. Reson. Medicine 73, 514–522 (2015).
2. X Ou, DF Gochberg, MT effects and T1 quantification in single-slice spoiled gradient echo imaging. Magn. Reson. Medicine 59, 835–845 (2008).
3. JZ Bojorquez, et al., What are normal relaxation times of tissues at 3T? Magn. Reson. Imaging 35, 69–80 (2017).
4. RPA Teixeira, SJ Malik, JV Hajnal, Fast quantitative MRI using controlled saturation magnetization transfer. Magn. Reson. Medicine 81, 907–920 (2019).
5. LA Reynolds, et al., Nonaqueous magnetization following adiabatic and selective pulses in brain: T1 and cross-relaxation dynamics. NMR Biomed. 36, e4936 (2023).
6. J Assländer, C Gultekin, S Flassbeck, SJ Glaser, DK Sodickson, Generalized Bloch model: A theory for pulsed magnetization transfer. Magn. Reson. Medicine 87, 2003–2017 (2022).
7. G Helms, GE Hagberg, In vivo quantification of the bound pool T1 in human white matter using the binary spin–bath model of progressive magnetization transfer saturation. Phys. Medicine Biol. 54, N529–N540 (2009).
8. P van Gelderen, X Jiang, JH Duyn, Effects of magnetization transfer on T1 contrast in human brain white matter. NeuroImage 128, 85–95 (2016).
9. A Samsonov, AS Field, Confounding of Macromolecular and Paramagnetic Tissue Content in Quantitative MTI Remedied by Explicit Estimation of Bound Pool Relaxation in Proc. Intl. Soc. Mag. Reson. Med. p. 0716 (2021).
10. AP Manning, AL MacKay, CA Michal, Understanding aqueous and non-aqueous proton T1 relaxation in brain. J. Magn. Reson. 323, 106909 (2021).
11. J Assländer, et al., On multi-path longitudinal spin relaxation in brain tissue. arXiv p. arXiv ID: 2301.08394 (2023).
12. GJ Stanisz, et al., T1, T2 relaxation and magnetization transfer in tissue at 3T. Magn. Reson. Medicine 54, 507–512 (2005).
13. C Preibisch, R Deichmann, Influence of RF spoiling on the stability and accuracy of T1 mapping based on spoiled FLASH with varying flip angles. Magn. Reson. Medicine 61, 125–135 (2009).
14. W Shin, H Gu, Y Yang, Fast high-resolution T1 mapping using inversion-recovery look-locker echo-planar imaging at steady state: Optimization for accuracy and reliability. Magn. Reson. Medicine 61, 899–906 (2009).
15. H Lu, et al., Routine clinical brain MRI sequences for use at 3.0 Tesla. J. Magn. Reson. Imaging 22, 13–22 (2005).
16. HM Cheng, GA Wright, Rapid high-resolution T1 mapping by variable flip angles: Accurate and precise measurements in the presence of radiofrequency field inhomogeneity. Magn. Reson. Medicine 55, 566–574 (2006).
17. JP Marques, et al., MP2RAGE, a self bias-field corrected sequence for improved segmentation and T1-mapping at high field. NeuroImage 49, 1271–1281 (2010).
18. SJ Graham, RM Henkelman, Understanding pulsed magnetization transfer. J. Magn. Reson. Imaging 7, 903–912 (1997).
19. SH Koenig, RD Brown, M Spiller, N Lundbom, Relaxometry of brain: Why white matter appears bright in MRI. Magn. Reson. Medicine 14, 482–495 (1990).
20. J Assländer, et al., Rapid quantitative magnetization transfer imaging: utilizing the hybrid state and the generalized Bloch model. arXiv p. arXiv ID: 2207.08259 (2022).
Figures