0568
Rapid, open-source, cross-platform 3D multiparametric mapping for multisite neuroimaging1Athinoula A. Martinos Center for Biomedical Imaging, Massachusetts General Hospital, Boston, MA, United States, 2Department of Radiology, Harvard Medical School, Boston, MA, United States, 3Department of Radiology, Juntendo University, Tokyo, Japan, 4Department of Radiology, The University of Tokyo, Tokyo, Japan, 5Fetal-Neonatal Neuroimaging & Developmental Science Center, Boston Children’s Hospital, Boston, MA, United States, 6Department of Biomedical Engineering, University of Michigan, Ann Arbor, MI, United States, 7Division of Medical Physics, Department of Radiology, Faculty of Medicine, Medical Center–University of Freiburg, Freiburg, Germany, 8Key Laboratory for Biomedical Engineering of Ministry of Education, Department of Biomedical Engineering, College of Biomedical Engineering & Instrument Science, Zhejiang University, Zhejiang, China, 9GE HealthCare, Boston, MA, United States, 10Department of Radiology, Vanderbilt University, Nashville, TN, United States, 11Department of Psychiatry, Brigham and Women’s Hospital, Boston, MA, United States, 12Department of Radiology, Brigham and Women’s Hospital, Boston, MA, United States, 13Harvard/MIT Health Sciences and Technology, Massachusetts Institute of Technology, Cambridge, MA, United States
Synopsis
Keywords: Quantitative Imaging, Precision & Accuracy, Validation; Cross-vendor
Motivation: To address the unmet need for a cross-platform, multiparametric technique to facilitate data harmonization across different sites.
Goal(s): To implement and evaluate a fully transparent 3D multiparametric mapping for multisite neuroimaging.
Approach: A multiparametric mapping technique, 3D-QALAS, was implemented in Pulseq. The acquired T1 and T2 maps were compared within-scanner, cross scanners, software versions, sites, and vendors.
Results: The Pulseq implementation exhibited significantly higher reproducibility than vendor-native implementations, particularly for T2 values, in both phantom and in vivo studies. This approach enabled ADNI-compliant field-of-view sizes with 1mm isotropic resolution within 5 minutes, while maintaining a cross-platform coefficient of variation below 4%.
Impact: An open-source implementation across different vendors and scanners, along with a consistent reconstruction and fitting pipeline, improved measurement reproducibility. This approach facilitates data harmonization, version control and error-propagation assessment, making it also suitable for extracting quantitative information for downstream analysis.
Introduction
Open-source science is desirable for enhancing transparency and reproducibility in neuroimaging studies, particularly since multi-site studies require consistent data acquisition, reconstruction, and analysis across various platforms1. Traditional closed-source, vendor-specific environments may hinder this consistency2, 3. To increase the cohort size, and thereby the statistical power, multi-site studies such as ABCD4, HBCD5, and HBN6 collect MRI data from different scanner vendors and models. However, multi-site data cannot be naively pooled together for analysis due to large inter-scanner differences. This variability in vendor-specific acquisition sequences and reconstruction algorithms contribute to the “reproducibility crisis” in neuroimaging.Towards addressing this open problem, we introduce a rapid, open-source, cross-platform multiparametric technique, aiming to optimize control over the entire MRI acquisition to reconstruction process. We hypothesized that using identical wave shapes, gradient timing, and consistent reconstruction and parameter fitting procedures will improve reproducibility across different platforms.
Methods
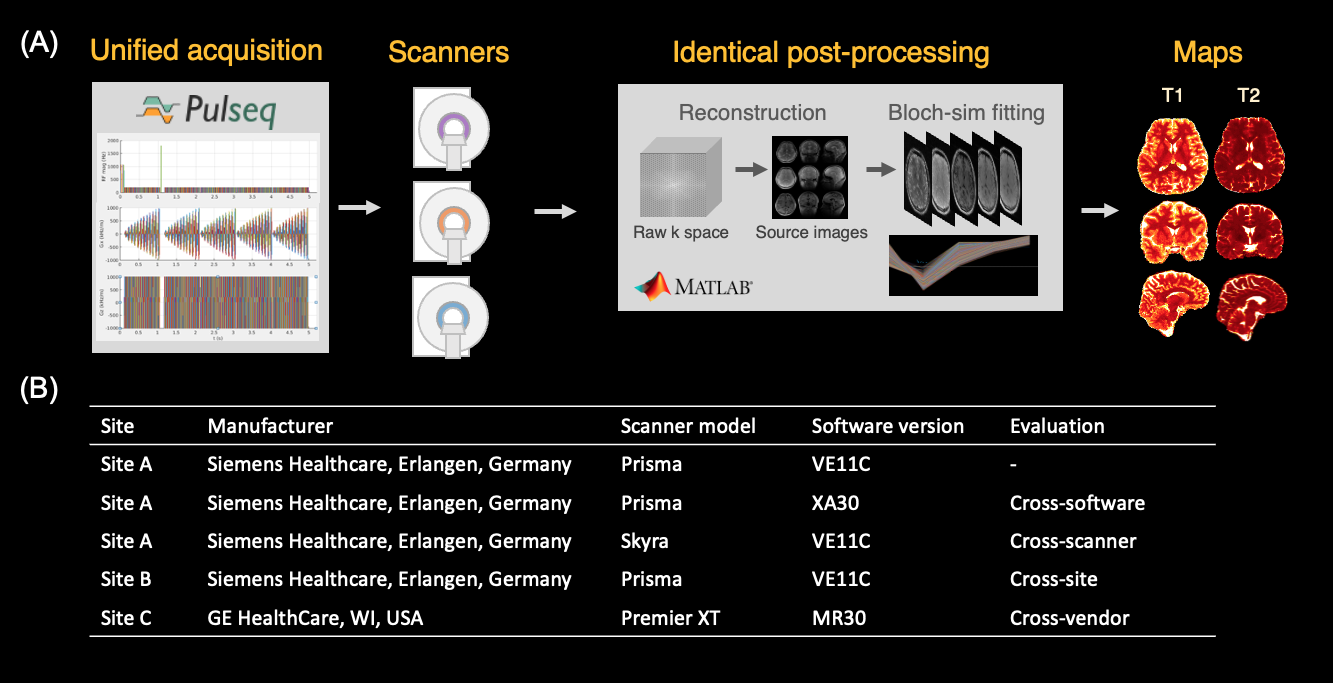
Process overview and study setupFigure 1A shows the workflow overview. Pulse sequence was implemented with Pulseq7 (v1.4.0) in MATLAB. The sequence was executed on Siemens scanners using the Siemens Pulseq interpreter7, and on the GE scanner using the TOPPE interpreter8. Adjustments were made to the gradient raster timing, delays, and waveforms to enable all scanners to execute the sequence near identically. The raw k-space data were reconstructed offline using identical procedures in MATLAB. Data were acquired using various 3T MRI scanners from multiple sites and manufacturer as listed in Figure 1B. A NIST/ISMRM phantom (serial number: 136-0001) and a healthy volunteer underwent scanning sessions on each of these scanners.
Sequence and data acquisition
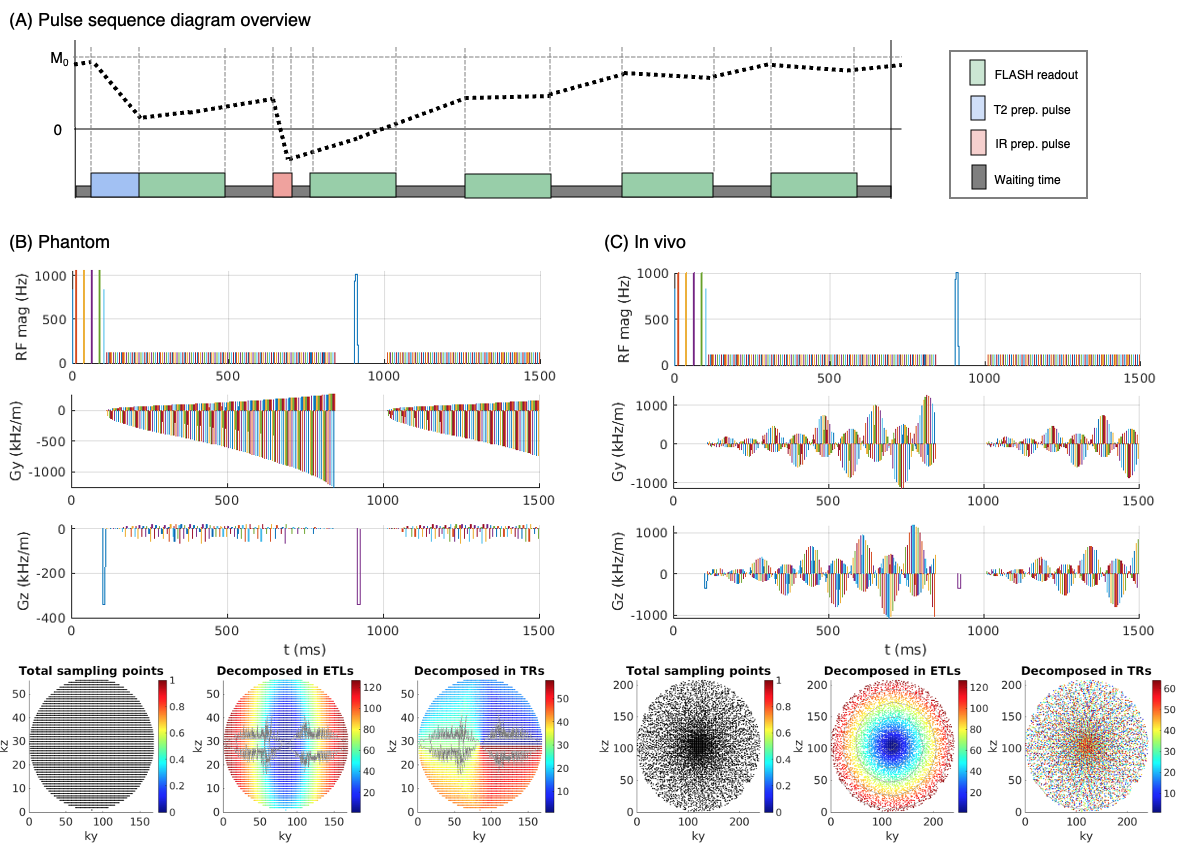
We used a multiparametric technique called 3D-quantification using an interleaved Look–Locker acquisition sequence with a T2 preparation pulse (3D-QALAS)9, 10 as shown in Figure 2. 3D-QALAS incorporates five FLASH readouts, interleaved with a T2 preparation pulse and an inversion pulse. Acquisition parameters were as follows: orientation, sagittal; TR, 4500ms; TE, 2.29ms; TI, 110/1010/1910/2810/3710ms; echo spacing, 5.8 ms; flip angle, 4 degrees; echo train length, 127; and bandwidth, 326 Hz/pixel.
For phantom (Figure 2B): FOV, 192x168x168; Matrix, 192x168x56; TA, 4min 21sec. Phantom temperature was measured using MRI readable thermometer11.
For invivo (Figure 2C): FOV, 256x240x208 (ADNI-compliant); Matrix, 256x240x208; R≈6;TA, 4min 48sec. After normalizing k space data, L1 penalized non-linear conjugate gradient reconstruction with wavelet and TV regularization was performed12, 13. The five source images were passed to voxel-wise Bloch simulations with B1 correction and inversion efficiency estimation14, and the T1 and T2 values were obtained. Vendor-native 3D-QALAS acquisitions were also acquired. Inversion recovery T1 and single-echo spin echo T2 mapping was also performed on phantom.
Evaluation
For phantom data, spherical ROIs were placed in the spheres to measure relaxation times for each sphere. For in vivo data, SynthSeg implemented on Freesurfer v7.4 was used to segment images and estimate the regional T1 and T2 values for each scan15, 16. Coefficient of variation (CV), Bland-Altman plots were used to assess within-scanner repeatability and reproducibility across scanner models, software versions and vendors.
Data sharing
We adhere to the guidelines set by the ISMRM Reproducibility Committee. Pulse sequence, reconstruction and analysis code and raw data can be accessed from https://anonymous.4open.science/r/Pulseq-qalas-0E64.
Results
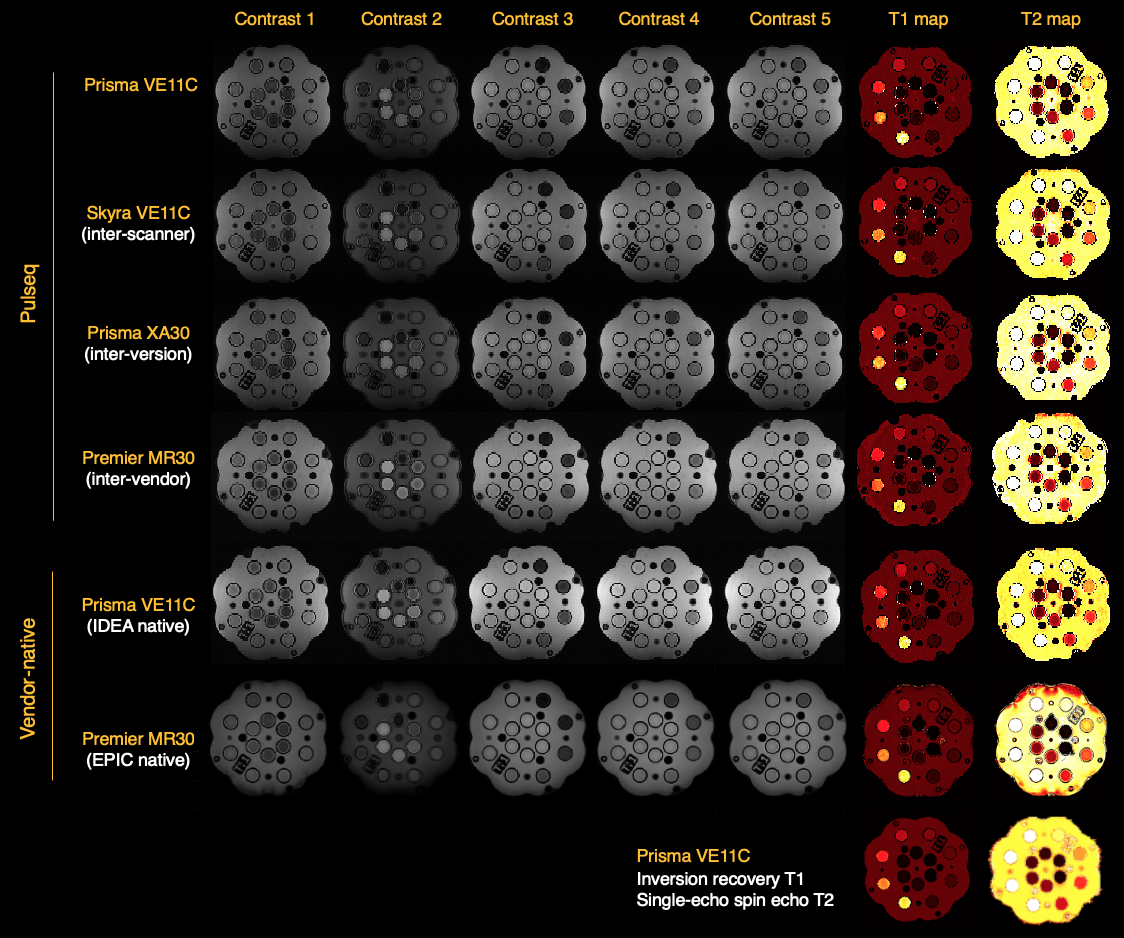
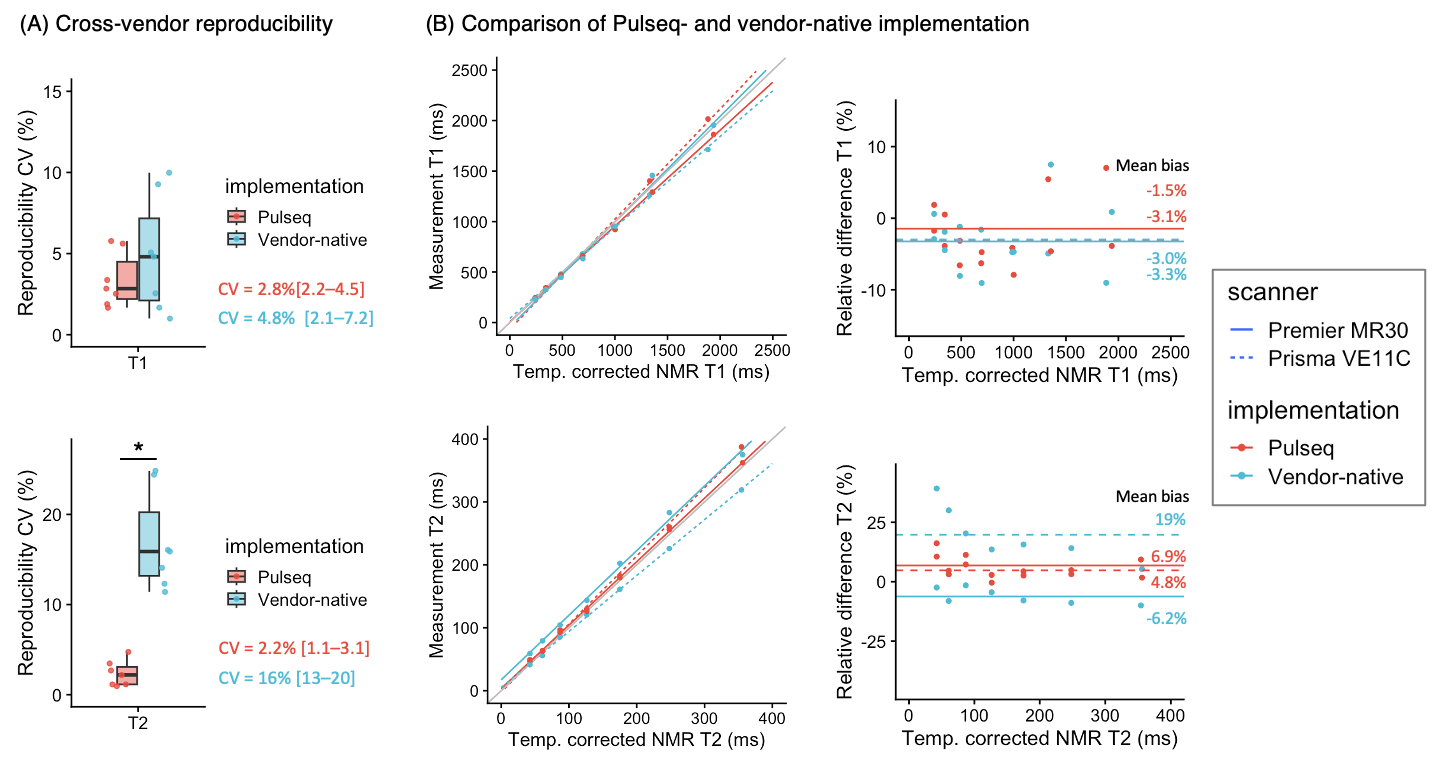
Phantom studyFigure 2 displays representative images and maps from each scanner, with ROI analysis presented in Figure 3. The Pulseq implementation demonstrated significantly higher reproducibility in T2 values, as indicated by lower CVs, compared to the vendor-native implementation (4.9% vs. 3.4%, p=.71 for T1; 17% vs. 2.3%, p<.001 for T2).
In vivo study
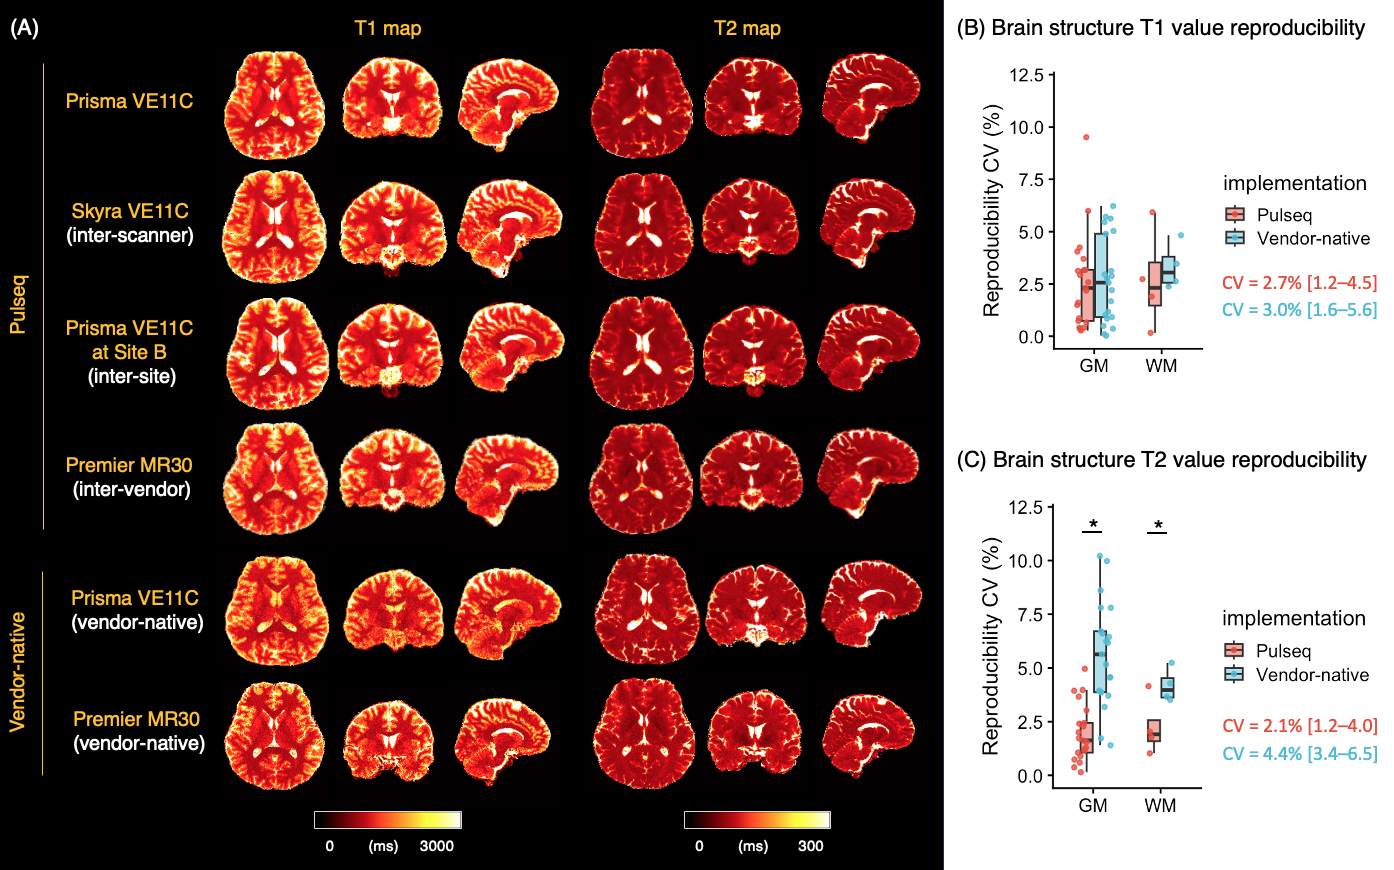
Figure 4 presents the representative maps from each scanner and provides a brain region-wise analysis. Pulseq showed cross-platforms CVs of 3.0% for T1 and 1.7% for T2. The Pulseq implementation again showed higher reproducibility than the vendor-native implementation (8.5% vs. 4.0%, p=.29 for T1; 5.0% vs. 3.8%, p=.0052 for T2).
Discussion
Consistency in measurement steps was achieved across sites and vendors, not only at a high level (FOV, matrix, TR, TE, etc.) but also at a more detailed level (wave shape, pulse timing, etc.). Such uniform and fully transparent implementation across different vendors and scanners, along with a consistent reconstruction and fitting pipeline, ensures comprehensive control over the measurements. The achieved significant improvement in reproducibility should boost the statistical power of future large-scale neuroimaging studies. In later stages of this project, we aim to incorporate additional vendors such as Philips, Canon, and United Imaging.Conclusion
Open-source, vendor-agnostic, rapid 3D multiparametric mapping provided relaxation times with less than a 4.0% variation across different scanners, software, and vendors, with improved cross-vendor reproducibility for both in phantom and in vivo data compared to vendor-native implementations.Acknowledgements
This work was supported by research grants NIH R01 EB028797, U01 EB025162, P41 EB030006, U01 EB026996, R03 EB031175, R01 EB032378, UG3 EB034875 and Nvidia Corporation for computing support.References
- Van Horn JD, Toga AW: Multisite neuroimaging trials. Curr Opin Neurol 2009; 22:370–378.
- Stikov N, Trzasko JD, Bernstein MA: Reproducibility and the future of MRI research. Magn Reson Med2019; 82:1981–1983.
- Karakuzu A, Biswas L, Cohen-Adad J, Stikov N: Vendor-neutral sequences and fully transparent workflows improve inter-vendor reproducibility of quantitative MRI. Magn Reson Med 2022; 88:1212–1228.
- Volkow ND, Koob GF, Croyle RT, et al.: The conception of the ABCD study: From substance use to a broad NIH collaboration. Dev Cogn Neurosci 2018; 32:4–7.
- The HEALthy brain and child development study [https://nida.nih.gov/research/nida-research-programs-activities/healthy-brain-child-development-study]
- Child Mind Institute: Magnetic Resonance Imaging of Healthy and Diseased Brain Networks. Frontiers SA Media; 2015.
- Layton KJ, Kroboth S, Jia F, et al.: Pulseq: A rapid and hardware-independent pulse sequence prototyping framework. Magn Reson Med 2017; 77:1544–1552.
- Nielsen J-F, Noll DC: TOPPE: A framework for rapid prototyping of MR pulse sequences. Magn Reson Med 2018; 79:3128–3134.
- Kvernby S, Warntjes M, Carlhäll C-J, Engvall J, Ebbers T: 3D-Quantification using an interleaved Look-Locker acquisition sequence with T2-prep pulse (3D-QALAS). J Cardiovasc Magn Reson 2014; 16:O82.
- Fujita S, Hagiwara A, Hori M, et al.: Three-dimensional high-resolution simultaneous quantitative mapping of the whole brain with 3D-QALAS: An accuracy and repeatability study. Magn Reson Imaging2019; 63:235–243.
- Keenan KE, Stupic KF, Russek SE, Mirowski E: MRI-visible liquid crystal thermometer. Magn Reson Med2020; 84:1552–1563.
- Lustig M, Donoho D, Pauly JM: Sparse MRI: The application of compressed sensing for rapid MR imaging. Magn Reson Med 2007; 58:1182–1195.
- Pruessmann KP, Weiger M, Scheidegger MB, Boesiger P: SENSE: sensitivity encoding for fast MRI. Magn Reson Med 1999; 42:952–962.
- Cho J, Gagoski B, Kim TH, et al.: Time‐efficient, high‐resolution 3T whole‐brain relaxometry using 3D‐QALAS with wave‐CAIPI readouts. Magn Reson Med 2023.
- Billot B, Greve DN, Puonti O, et al.: SynthSeg: Segmentation of brain MRI scans of any contrast and resolution without retraining. Med Image Anal 2023; 86:102789.
- Fischl B: FreeSurfer. Neuroimage 2012; 62:774–781.
Figures