0567
Simultaneous T1 and T2 mapping of the brain with accelerated QuantoRAGE using optimized sequence parameters and fast neural network fitting1Advanced Clinical Imaging Technology, Siemens Healthineers International AG, Bern, Switzerland, 2Magnetic Resonance Methodology, Institute of Diagnostic and Interventional Neuroradiology, University of Bern, Bern, Switzerland, 3Translational Imaging Center (TIC), Swiss Institute for Translational and Entrepreneurial Medicine, Bern, Switzerland, 4Advanced Clinical Imaging Technology, Siemens Healthineers International AG, Lausanne, Switzerland, 5Department of Radiology, University Hospital (CHUV) and University of Lausanne (UNIL), Lausanne, Switzerland, 6LTS5, École Polytechnique Fédérale de Lausanne, Lausanne, Switzerland, 7Donders Institute for Brain Cognition and Behaviour, Radboud University, Nijmegen, Netherlands, 8Department of Diagnostic, Interventional and Pediatric Radiology (DIPR), Inselspital, Bern University Hospital, University of Bern, Bern, Switzerland, 9Graduate School for Cellular and Biomedical Sciences, University of Bern, Bern, Switzerland
Synopsis
Keywords: Quantitative Imaging, Brain, CRLB optimization, Machine Learning, Fast-Fitting, QuantoRAGE
Motivation: T1 and T2 relaxometry provide valuable information for early pathology detection but require long scan and fitting times for high-resolution whole-brain mapping.
Goal(s): To reduce acquisition and map generation times for simultaneous T1 and T2 mapping.
Approach: The proposed accelerated sequence uses two scans instead of the original four, with parameters optimized using the Cramér-Rao lower bound (CRLB). A neural network fast fitting model is employed to drastically reduce parameter quantification times.
Results: The optimized technique reduced total acquisition time from 18:20 to 9:10 minutes and fitting time from several hours to 2 min for the entire brain.
Impact: Using QuantoRAGE, simultaneous T1 and T2 relaxometry of the whole brain with high isotropic resolution can be acquired in 9 minutes with quantitative maps generated within few seconds per slice. Both aspects bring quantitative MRI closer to clinical applications.
Introduction
T1 and T2 mapping have demonstrated sensitivity to various pathologies and could become important clinical biomarkers1. However, quantitative high-resolution whole-brain parametric mapping typically requires long scan times, which limits its application in clinical practice.QuantoRAGE was recently introduced for whole-brain isotropic simultaneous T1 and T2 mapping2. Nonetheless, its four T2-prepared inversion scans required 18:20 minutes to acquire and the large dictionary3 prevented rapid fitting to be performed directly at the scanner console.
Here, we present a faster QuantoRAGE acquisition with fewer T2-prepared inversion scans and sequence parameters optimized using the Cramér-Rao lower bound (CRLB)4. Furthermore, we employed a fully connected neural network to drastically reduce fitting time for multi-parameter estimation5. The optimized QuantoRAGE was tested both in a phantom and preliminarily in the brain.
Methods
After an adiabatic T2-prepared inversion8,9 of duration TEp, QuantoRAGE acquires two FLASH6 blocks with an undersampled 3D-Cartesian center-out trajectory7 at different inversion times (TI1/2) (Figure 1). Thus, two images are reconstructed with each scan using compressed sensing10. The initially suggested QuantoRAGE protocol heuristically used four scans (TA=4:35 min/scan) with various TEp and TI2 (Table 1) to map the expected ranges of T1 and T2 values in the brain. Additionally, a fast B1+ map is measured (TA=12s).T1 and T2 are then quantified using voxel-wise dictionary fitting by concatenating the signal of the resulting images and the relative B1+ deviation. The dictionary is generated using EPG simulations11 for $$$(B1^+,T_1,T_2) \in [0.7,1.2]\times[150,4346 ms]\times[15,434 ms]$$$.
The CRLB loss is $$$Tr(I^{-1})$$$ where $$$I = \sum_n J_n^TJ_n$$$ is the Fischer Information matrix, with $$$J_n = \frac{\partial m(n)}{\partial (T_1,T_2,M_0)}$$$ the Jacobian of the signal $$$m$$$ at the $$$n^{th}$$$ inversion time with respect to T1, T2 and M04. The loss was then optimized with respect to TEp and TI2 for two and three scans on white and grey matter conjointly (T1WM/GM=1110/1470 ms, T2WM/GM=56/71 ms).
Our fast-fitting neural network consisted of five fully connected hidden layers with ReLU activation (Table 1C), mapping the QuantoRAGE signal magnitude and the associated B1+ to T1 and T2 values. The architecture was chosen for each protocol to minimize the Mean Square Error (MSE) in a random 20%/80% split test and training using the same dictionary used for fitting.
IRB-approved experiments were performed at 3T (MAGNETOM Prisma, Siemens Healthcare AG, Erlangen, Germany) with a 64-channel Rx head/neck coil in a healthy volunteer (28-year-old, male) and on a standardized phantom (Model 106 Essential System, CALIBER MRI). The QuantoRAGE research application sequence was scanned using the originally proposed parameters, as well as with the optimized three and two scans, and reconstructed both with dictionary- and fast-fitting (ff). A 2D multi-echo spin echo (MESE) and an MP2RAGE sequences were used for T2 and T1 references, respectively (Table 1A).
In the phantom images, the average T1 and T2 values were measured in ROIs of the respective compartments; all sequences were compared with the nominal values provided by the phantom vendor.
Results
The CRLB-optimized TEp and TI2, as well as the adopted neural network architectures and corresponding RMSE are reported in Table 1B-C.In the phantom data (Fig. 2,3), the optimized two-scan QuantoRAGE showed good agreement with nominal T1 and T2 values, similarly or better than any other QuantoRAGE protocol or reference method. All fast-fitted variants agreed well with nominal values in the trained T1 and T2<80 ms range, but their accuracy decreased for higher T2. The resulting fitting time using neural network decreased from 100-200s to 1-2s per slice.
The in-vivo experiment confirmed the results obtained in the phantom, with optimized two-scan and three-scan QuantoRAGE showing good visual agreement with the original sequence (Fig. 4A). QuantoRAGE T1 maps showed blurrier depiction of the anatomy (possibly due to a different readout trajectory) and decreased GM/WM contrast in comparison to MP2RAGE. However, it estimated higher T1 values in CSF, which were underestimated by MP2RAGE, by explicitly using B1+ information. QuantoRAGE T2 maps showed good anatomical detail and sharp contrast in comparison to MESE, which estimated higher T2 values in the white matter12 (Figure 4B).
Discussion & Conclusion
The acquisition time of the original QuantoRAGE of 18:20 min decreased to 9:10 min for the two-scan configuration without a decrease in mapping accuracy nor precision. The fitting time decreased 100-fold by using a neuronal network for fitting, but at the cost of accuracy. Future work will focus on addressing remaining PSF artifacts associated with the currently used trajectory.While the proposed improvements warrant further validation, two-scan QuantoRAGE with fast fitting has the potential to map T1 and T2 simultaneously within 9 minutes and bring this technique closer to clinical applicability.
Acknowledgements
No acknowledgement found.References
- Deoni SCL. “Quantitative relaxometry of the brain. Top Magn Reson imaging.” TMRI 21(2):101, 2010.
- Bonanno G, et al. (2021) “Simultaneous T1 and T2 mapping with QuantoRAGE: a new MP2RAGE variant using T2-prepared inversion,” ISMRM, 2023
- Cloos, Martijn A., et al. “Multiparametric imaging with heterogeneous radiofrequency fields.” Nature communications 7.1 (2016): 1-10.
- Lee PK, et al. Flexible and efficient optimization of quantitative sequences using automatic differentiation of Bloch simulations. Magn Reson Med. 2019 Oct;82(4):1438-1451.
- Cohen O, et al. MR fingerprinting Deep RecOnstruction NEtwork (DRONE). Magn Reson Med. 2018; 80: 885–894.
- Haase A, Frahm J, Matthaei D, Hänicke W, Merboldt K‐D. FLASH imaging: rapid NMR imaging using low flip angle pulses. J Magn Reson 1986; 67: 258–266.
- Forman C, et al. High-resolution 3D whole-heart coronary MRA: a study on the combination of data acquisition in multiple breath-holds and 1D residual respiratory motion compensation. Magn Reson Mater Phy 2014;27:435-443.
- Visser F et al., High-resolution magnetization-prepared 3D-FLAIR imaging at 7.0 Tesla. Magnetic Resonance in Medicine 64:194–202 (2010)
- Gras V et al., Robust nonadiabatic T2 preparation using universal parallel transmit kT‐point pulses for 3D FLAIR imaging at 7 T. Magn Reson Med. 2019;81:3202–3208.
- Wetzl J, Forman C, Wintersperger BJ, et al. High‐resolution dynamic CE‐MRA of the thorax enabled by iterative TWIST reconstruction. Magn Reson Med. 2017;77:833–840.
- Malik, Shaihan J., Rui Pedro AG Teixeira, and Joseph V. Hajnal. "Extended phase graph formalism for systems with magnetization transfer and exchange." Magnetic resonance in medicine 80.2 (2018): 767-779.
- Lukzen N.N. et al., The generating functions formalism for the analysis of spin response to the periodic trains of RF pulses. Echo sequences with arbitrary refocusing angles and resonance offsets. Journal of Magnetic Resonance. 196:2 (2009) 164-169.
Figures
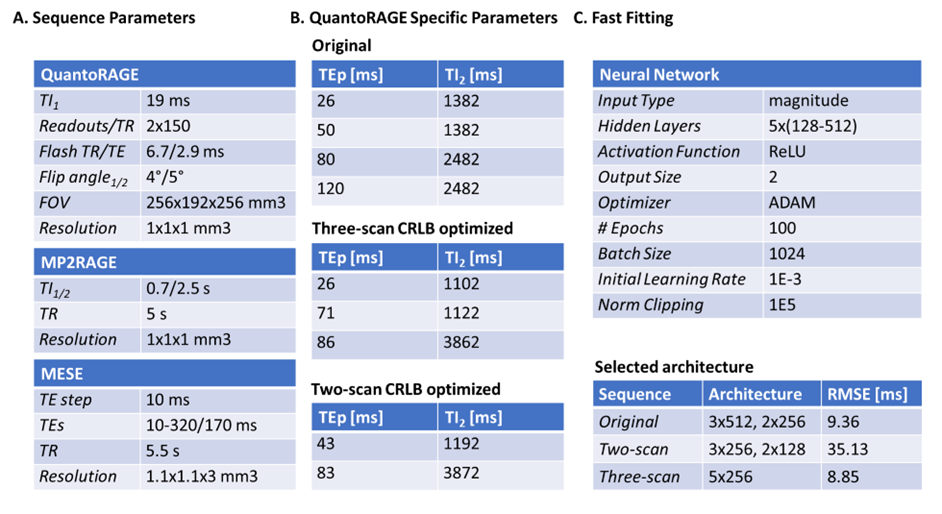
Table 1. (A) Relevant sequence parameters of QuantoRAGE, MP2RAGE and MESE. (B) Original QuantoRAGE and CRLB optimized TEp and TI2 for three- and two-scan QuantoRAGE. (C) Neural network parameters and selected architecture for each sequence with respective Root Mean Square Error (RMSE).
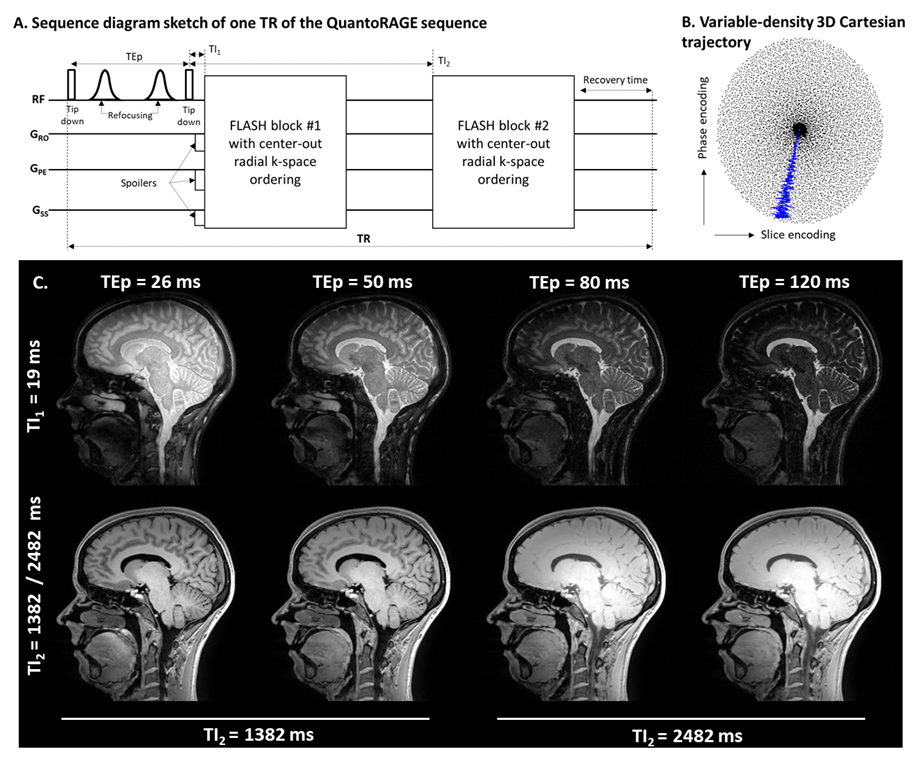
Figure 1. (A) Diagram of one TR of the QuantoRAGE sequence, with two FLASH blocks acquired at different inversion times (TI1,2) with center-out radial-like ordering (B) following a T2 preparation (TEp) of two rectangular tip-down pulses separated by two hyperbolic-secant refocusing pulses. (C) In-vivo images (one selected slice) obtained from the original QuantoRAGE method with four scans obtained using different TEp and TI2. Those images and the B1+ map are used to fit both T1 and T2 maps.
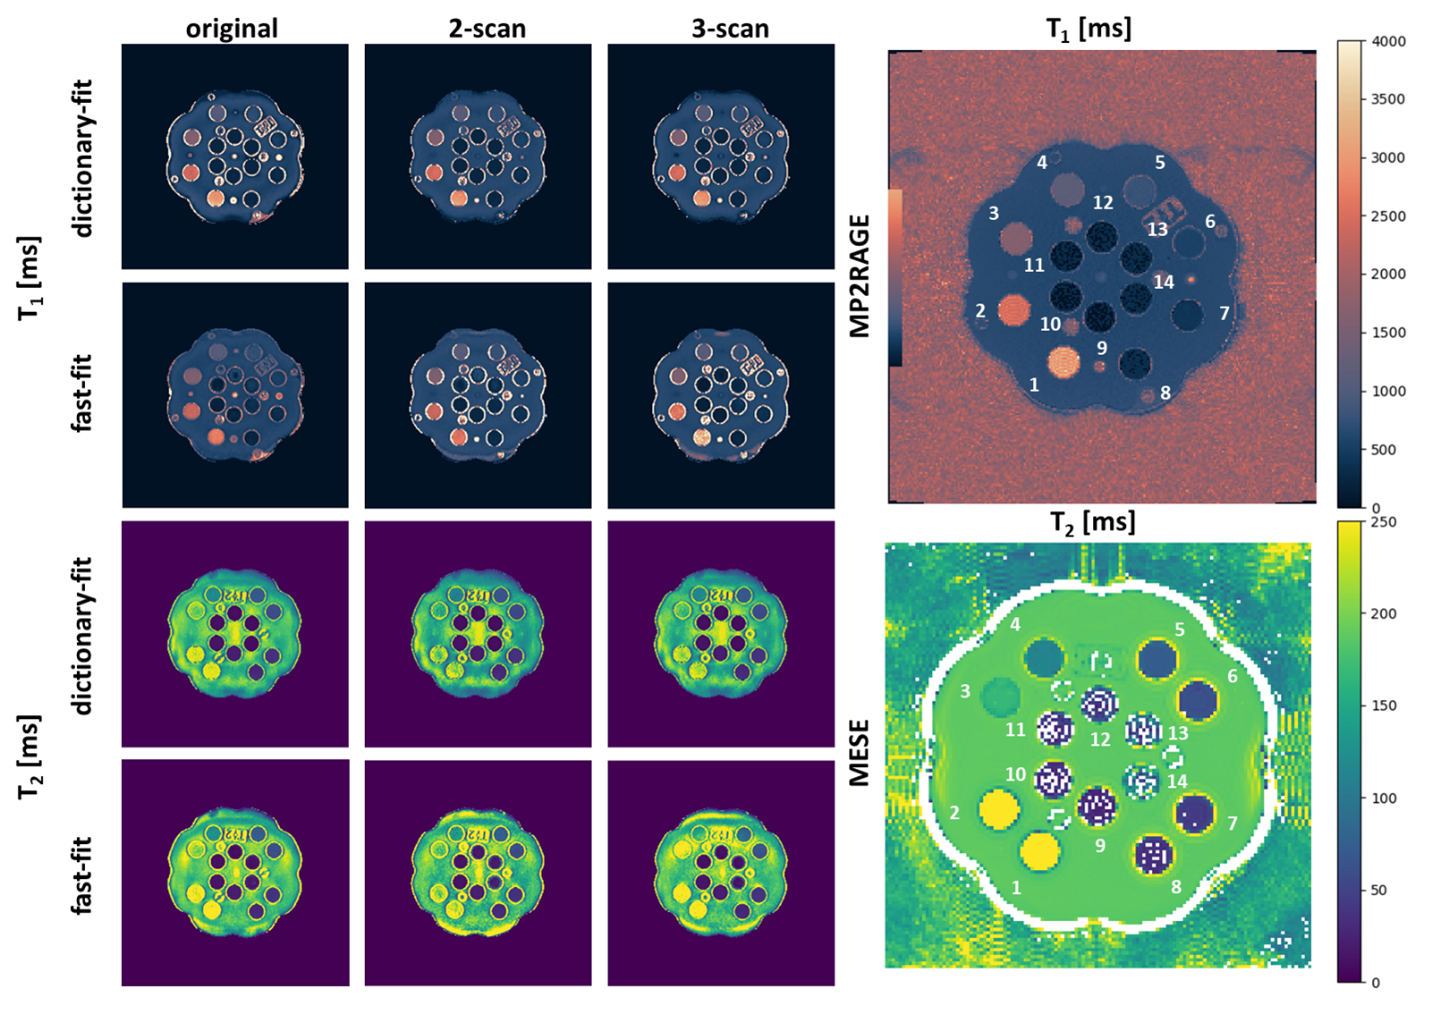
Figure 2. T1 & T2 maps for the different QuantoRAGE sequences with dictionary- or fast-fitting, reference MP2RAGE and MESE. The compartments considered for quantitative analysis (Figure 3) are #3-9 for T1 and #5-11 for T2. For the T2 maps, a strong inhomogeneity exists in the T2 of the background sample for all the QuantoRAGE maps. This is likely a side effect of the QuantoRAGE PSF associated with the centric ordering. The inconsistency between the dictionary and the data results in different appearances of these fluctuations on the dictionary and network fits, respectively.
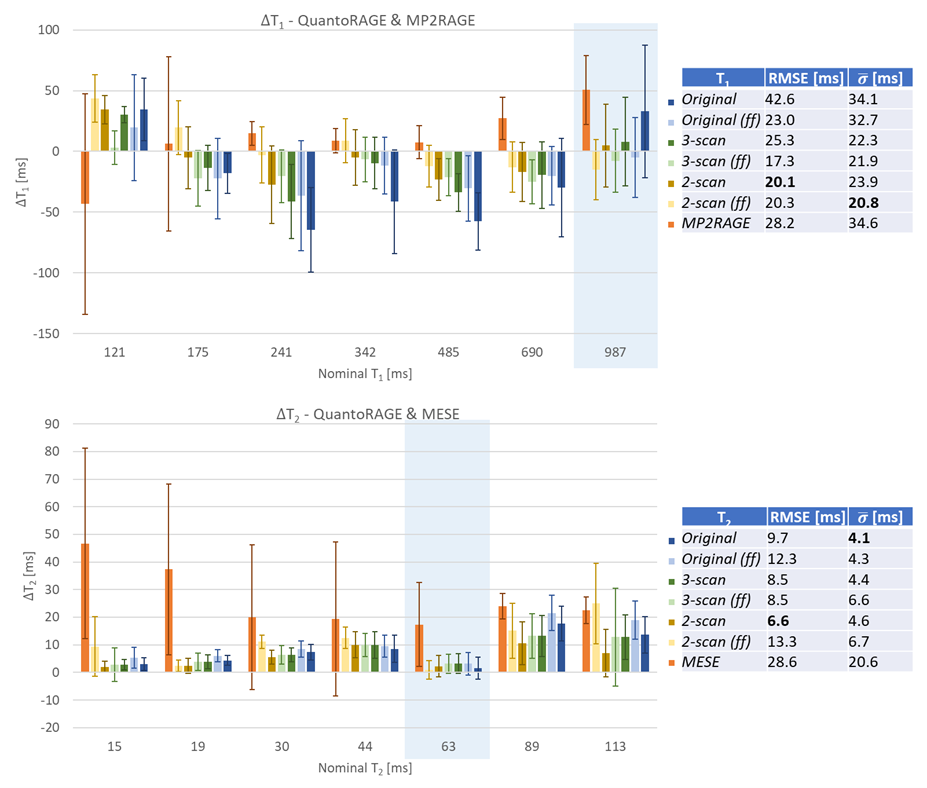
Figure 3. Phantom validation of QuantoRAGE and reference sequences deviation from the nominal T1 (∆T1) and T2 (∆T2) compartment values (that are within the dictionary range and to be expected in the brain). Target T1 and T2 ranges of the CRLB optimization are highlighted in light blue. Tables contain RMSE against the nominal values and average standard deviation  across compartments. The two-scan acquisition showed good agreement with the nominal values also in comparison to the original QuantoRAGE and reference methods, particularly when combined with Fast-Fitting (ff).
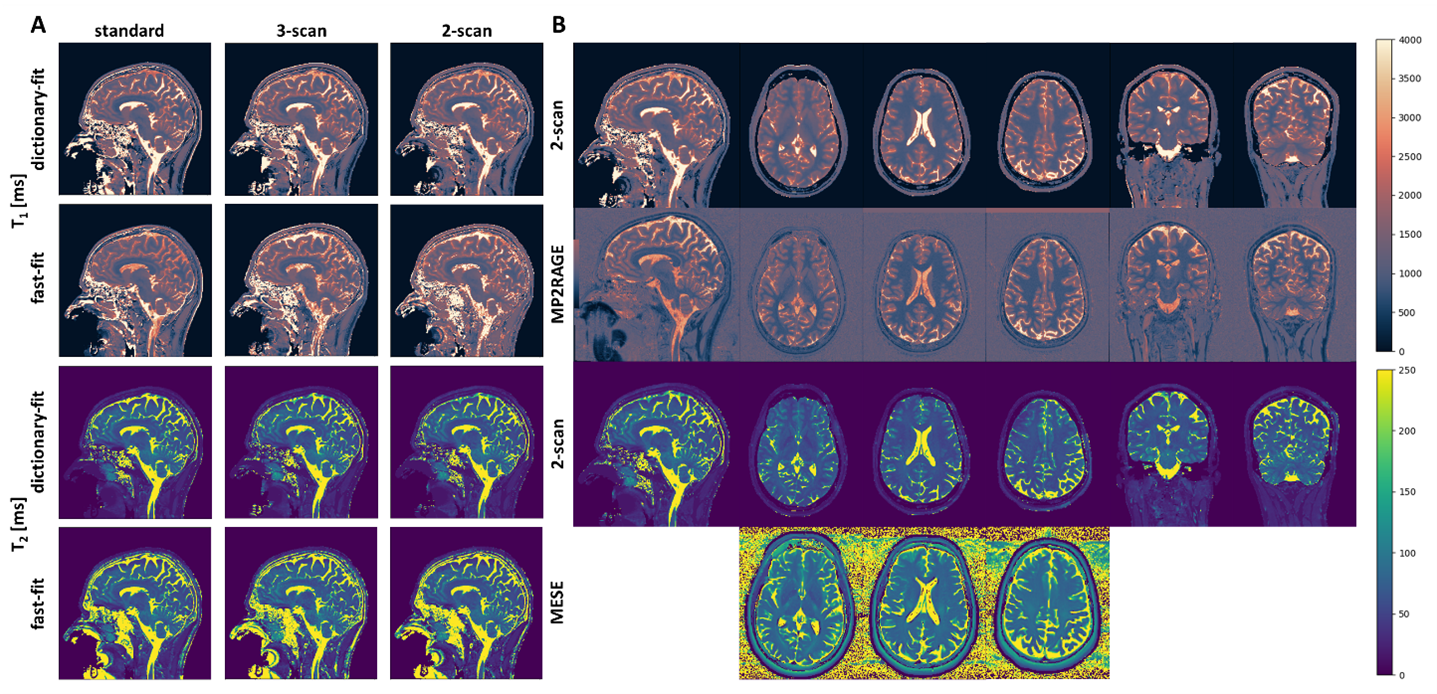
Figure 4. (A) Sagittal T1 & T2 maps for the different QuantoRAGE sequences with dictionary- or fast-fitting. (B) Sagittal, axial, and coronal slices for two-scan QuantoRAGE, MP2RAGE and MESE. T1 & T2 maps between the QuantoRAGE sequences are very similar. MP2RAGE T1 and QuantoRAGE T2 maps have sharp contrast and clear anatomical structures. White matter has higher T1 and lower T2 values in QuantoRAGE in comparison to MP2RAGE and MESE, while grey matter appears similar.