0564
In Vivo Glutamate CEST MR Fingerprinting (GluCEST-MRF)1Memorial Sloan Kettering Cancer Center, New York, NY, United States
Synopsis
Keywords: Quantitative Imaging, CEST & MT, MRF, Amine, Glutamate
Motivation: To obtain quantitative glutamate CEST and MT maps in the brain with higher resolution than spectroscopic imaging.
Goal(s): To develop a CEST-MRF pulse sequence and deep learning reconstruction approach for rapid quantitative glutamate imaging.
Approach: CEST-MRF pulse sequence with an acquisition schedule optimized by deep learning was developed to measure glutamate exchange rate and volume fractions. Quantitative maps were obtained using a neural network trained on physics-derived signals.
Results: The proposed approach yields water T1 and T2 relaxation maps, glutamate exchange and volume fraction maps and the semi-solid exchange and volume fraction maps in a scan time of less than 2 minutes.
Impact: The proposed quantitative glutamate-sensitive CEST-MRF technique can lead to improved diagnosis and treatment response evaluation in patients with brain tumors given that glutamate dysregulation is a key aspect of tumor growth.
Introduction
CEST MR fingerprinting (CEST-MRF) is a fast quantitative molecular imaging technique that provides simultaneous relaxation and chemical exchange maps [1]. CEST-MRF studies to date have focused on the amide protons due to their slow exchange rates and relatively large endogenous concentrations [2]–[4]. However, amine functional groups in neurotransmitters such as glutamate can also be targeted by appropriately varying the saturation resonance frequency and saturation powers [5]. Due to the heightened amino acid consumption often seen in tumors, quantitative mapping of the amine CEST properties can provide valuable insights for cancer diagnosis and treatment response evaluation. However, the faster amine exchange rate and lower in vivo concentrations impose significant challenges [6]. This work develops a pulse sequence and reconstruction approach to overcome these challenges and enable in vivo glutamate CEST-MRF (GluCEST-MRF) imaging.Methods
1. Pulse sequenceThe pulse sequence is shown in Figure 1. The magnetization is saturated with a Gaussian-shaped pulse train with resonance frequency set to that of glutamate (3ppm) [5]. The saturated magnetization exchanges with the water and the water signal read out with an EPI k-space sampling following fat suppression and excitation. The acquisition parameters were as follows: partial Fourier factor of 6/8, acceleration factor R=3, TE=20ms, matrix size=256×256, FOV=280×280 mm2, in-plane resolution 1.1mm2 and slice thickness=5mm. The saturation pulse train power (B1sat), and duration (Tsat), the excitation pulse flip angle (FA) and TR were varied according to a schedule that was optimized to minimize the reconstruction error as described in the next sections.
2. Schedule optimization
Deep learning optimization [7] was used to find a schedule of acquisition parameters tailored for glutamate imaging. A set of 1000 candidate schedules was sampled from the acquisition parameters ranges shown in Figure 2 and used to train a surrogate network to yield a mapping between the schedules and the associated reconstruction error. The surrogate network was then used with a pattern-search optimizer to find the schedule that yielded the minimum reconstruction error.
3. Tissue quantification and network training
Tissue quantification was performed using a deep reconstruction network (DRONE) [8]. The network was trained on a physics-derived dataset of signal magnetizations generated by sampling 110,000 entries from the tissue parameter ranges listed in Figure 2.
4. In vivo healthy subject
All experiments were conducted on a 3T Scanner (Signa Premier, GE Healthcare, Waukesha, WI) with a 48-channel head receiver coil. A healthy male volunteer was recruited and gave informed consent in accordance with our institutional IRB protocol. The subject was scanned with the optimized amine CEST-MRF pulse sequence and the data reconstructed with the trained DRONE network as described above. Regions-of-interest (ROI) corresponding to grey matter (GM) and white matter (WM) were delineated and used to calculate the mean values for each tissue map.
Results
The faster glutamate exchange rate demanded a higher power in the saturation pulse as determined by the pattern-search optimizer (Figure 3). The optimized B1sat schedule displayed hysteresis-like variations which is similar to what was observed in previous studies on MRF optimization [9], [10]. In vivo quantitative glutamate imaging presented adequate SNR despite the high spatial resolution of 1.1x1.1x5mm3 (Figure 4). While the GluCEST-MRF derived T1w was underestimated, the mean glutamate exchange rate obtained in this study (GM: 4746.9 ±952.3 Hz, WM: 4641.9 ±286.5) is similar to values obtained by other groups [12] (Figure 5).Discussion
This study is an initial proof-of-concept for glutamate CEST-MRF imaging. The fast exchange rate and small endogenous concentrations complicate glutamate CEST quantification. To overcome these challenges, the acquisition schedule was optimized to minimize the reconstruction error using a larger saturation power (B1sat) range in comparison to previous studies [7] to account for the faster glutamate exchange.Conclusion
A glutamate-sensitive CEST-MRF pulse sequence and quantification approach was demonstrated. Future work will focus on further improving the sensitivity, more extensive validation and applying this technique on cancer patients.Acknowledgements
This work was supported by NIH/NCI grant R37-CA262662.References
[1] O. Cohen, S. Huang, M. T. McMahon, M. S. Rosen, and C. T. Farrar, “Rapid and quantitative chemical exchange saturation transfer (CEST) imaging with magnetic resonance fingerprinting (MRF),” Magnetic resonance in medicine, vol. 80, no. 6, pp. 2449–2463, 2018.
[2] O. Cohen et al., “CEST MR fingerprinting (CEST-MRF) for brain tumor quantification using EPI readout and deep learning reconstruction,” Magnetic Resonance in Medicine, vol. 89, no. 1, pp. 233–249, 2023.
[3] O. Perlman, K. Herz, M. Zaiss, O. Cohen, M. S. Rosen, and C. T. Farrar, “CEST MR-Fingerprinting: practical considerations and insights for acquisition schedule design and improved reconstruction,” Magnetic resonance in medicine, vol. 83, no. 2, pp. 462–478, 2020.
[4] O. Perlman et al., “Quantitative imaging of apoptosis following oncolytic virotherapy by magnetic resonance fingerprinting aided by deep learning,” Nature biomedical engineering, vol. 6, no. 5, pp. 648–657, 2022.
[5] K. Cai et al., “Magnetic resonance imaging of glutamate,” Nature medicine, vol. 18, no. 2, pp. 302–306, 2012.
[6] N. S. Cho et al., “Amine-weighted chemical exchange saturation transfer magnetic resonance imaging in brain tumors,” NMR in Biomedicine, vol. 36, no. 6, p. e4785, 2023.
[7] O. Cohen and R. Otazo, “Global Deep Learning Optimization of CEST MR Fingerprinting (CEST-MRF) Acquisition Schedule,” NMR in Biomedicine, p. e4954, 2023.
[8] O. Cohen, B. Zhu, and M. S. Rosen, “MR fingerprinting deep reconstruction network (DRONE),” Magnetic resonance in medicine, vol. 80, no. 3, pp. 885–894, 2018.
[9] D. P. Kingma and J. Ba, “Adam: A method for stochastic optimization,” arXiv preprint arXiv:1412.6980, 2014.
[10] P. K. Lee, L. E. Watkins, T. I. Anderson, G. Buonincontri, and B. A. Hargreaves, “Flexible and efficient optimization of quantitative sequences using automatic differentiation of Bloch simulations,” Magnetic resonance in medicine, vol. 82, no. 4, pp. 1438–1451, 2019.
[11] O. Cohen and M. S. Rosen, “Algorithm comparison for schedule optimization in MR fingerprinting,” Magnetic resonance imaging, vol. 41, pp. 15–21, 2017.
[12] M. Zaiss and P. Bachert, “Chemical exchange saturation transfer (CEST) and MR Z-spectroscopy in vivo: a review of theoretical approaches and methods,” Physics in Medicine & Biology, vol. 58, no. 22, p. R221, 2013.
Figures
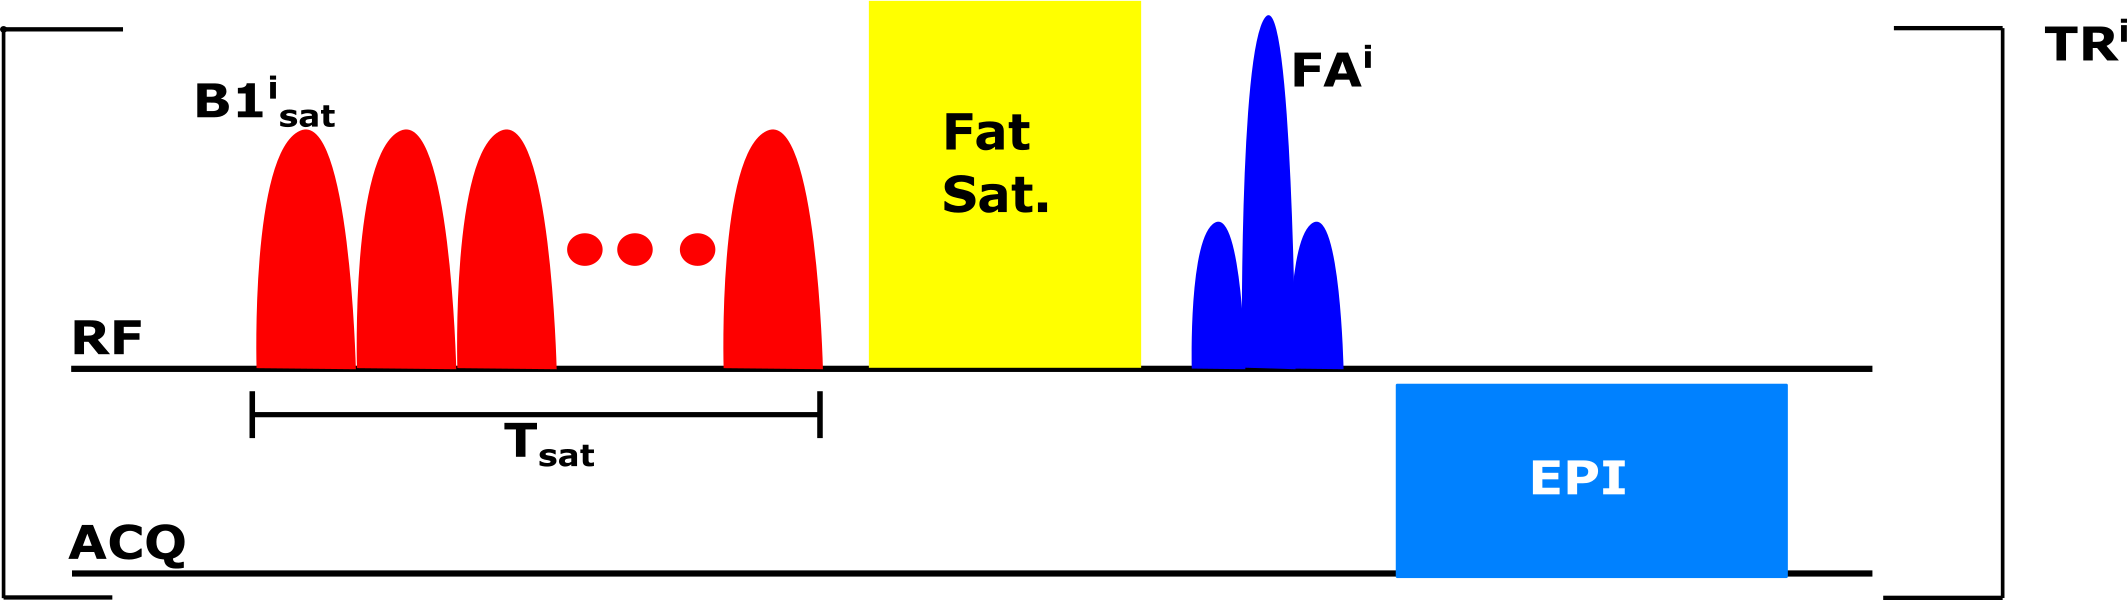
Figure 1: GluCEST-MRF pulse sequence. The saturation pulse train resonance offset was set to the glutamate chemical shift (3ppm). The remaining acquisition parameters were set according to the optimized schedule. Following saturation and fat suppression, the water magnetization is excited, and the signal read out by an EPI k-space sampling.
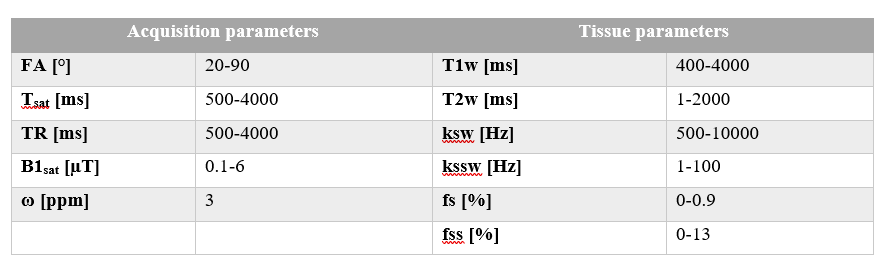
Figure 2: Acquisition and tissue parameter ranges used in the schedule optimization. The acquisition parameters are the following: FA=flip angle, Tsat= Saturation time, TR=repetition time, B1sat=Saturation power. The tissue parameters are the following: T1w=water T1 relaxation, T2w=water T2 relaxation, ksw=glutamate exchange rate, kssw=semi-solid exchange rate, fs=glutamate volume fraction, fss=semi-solid volume fraction.
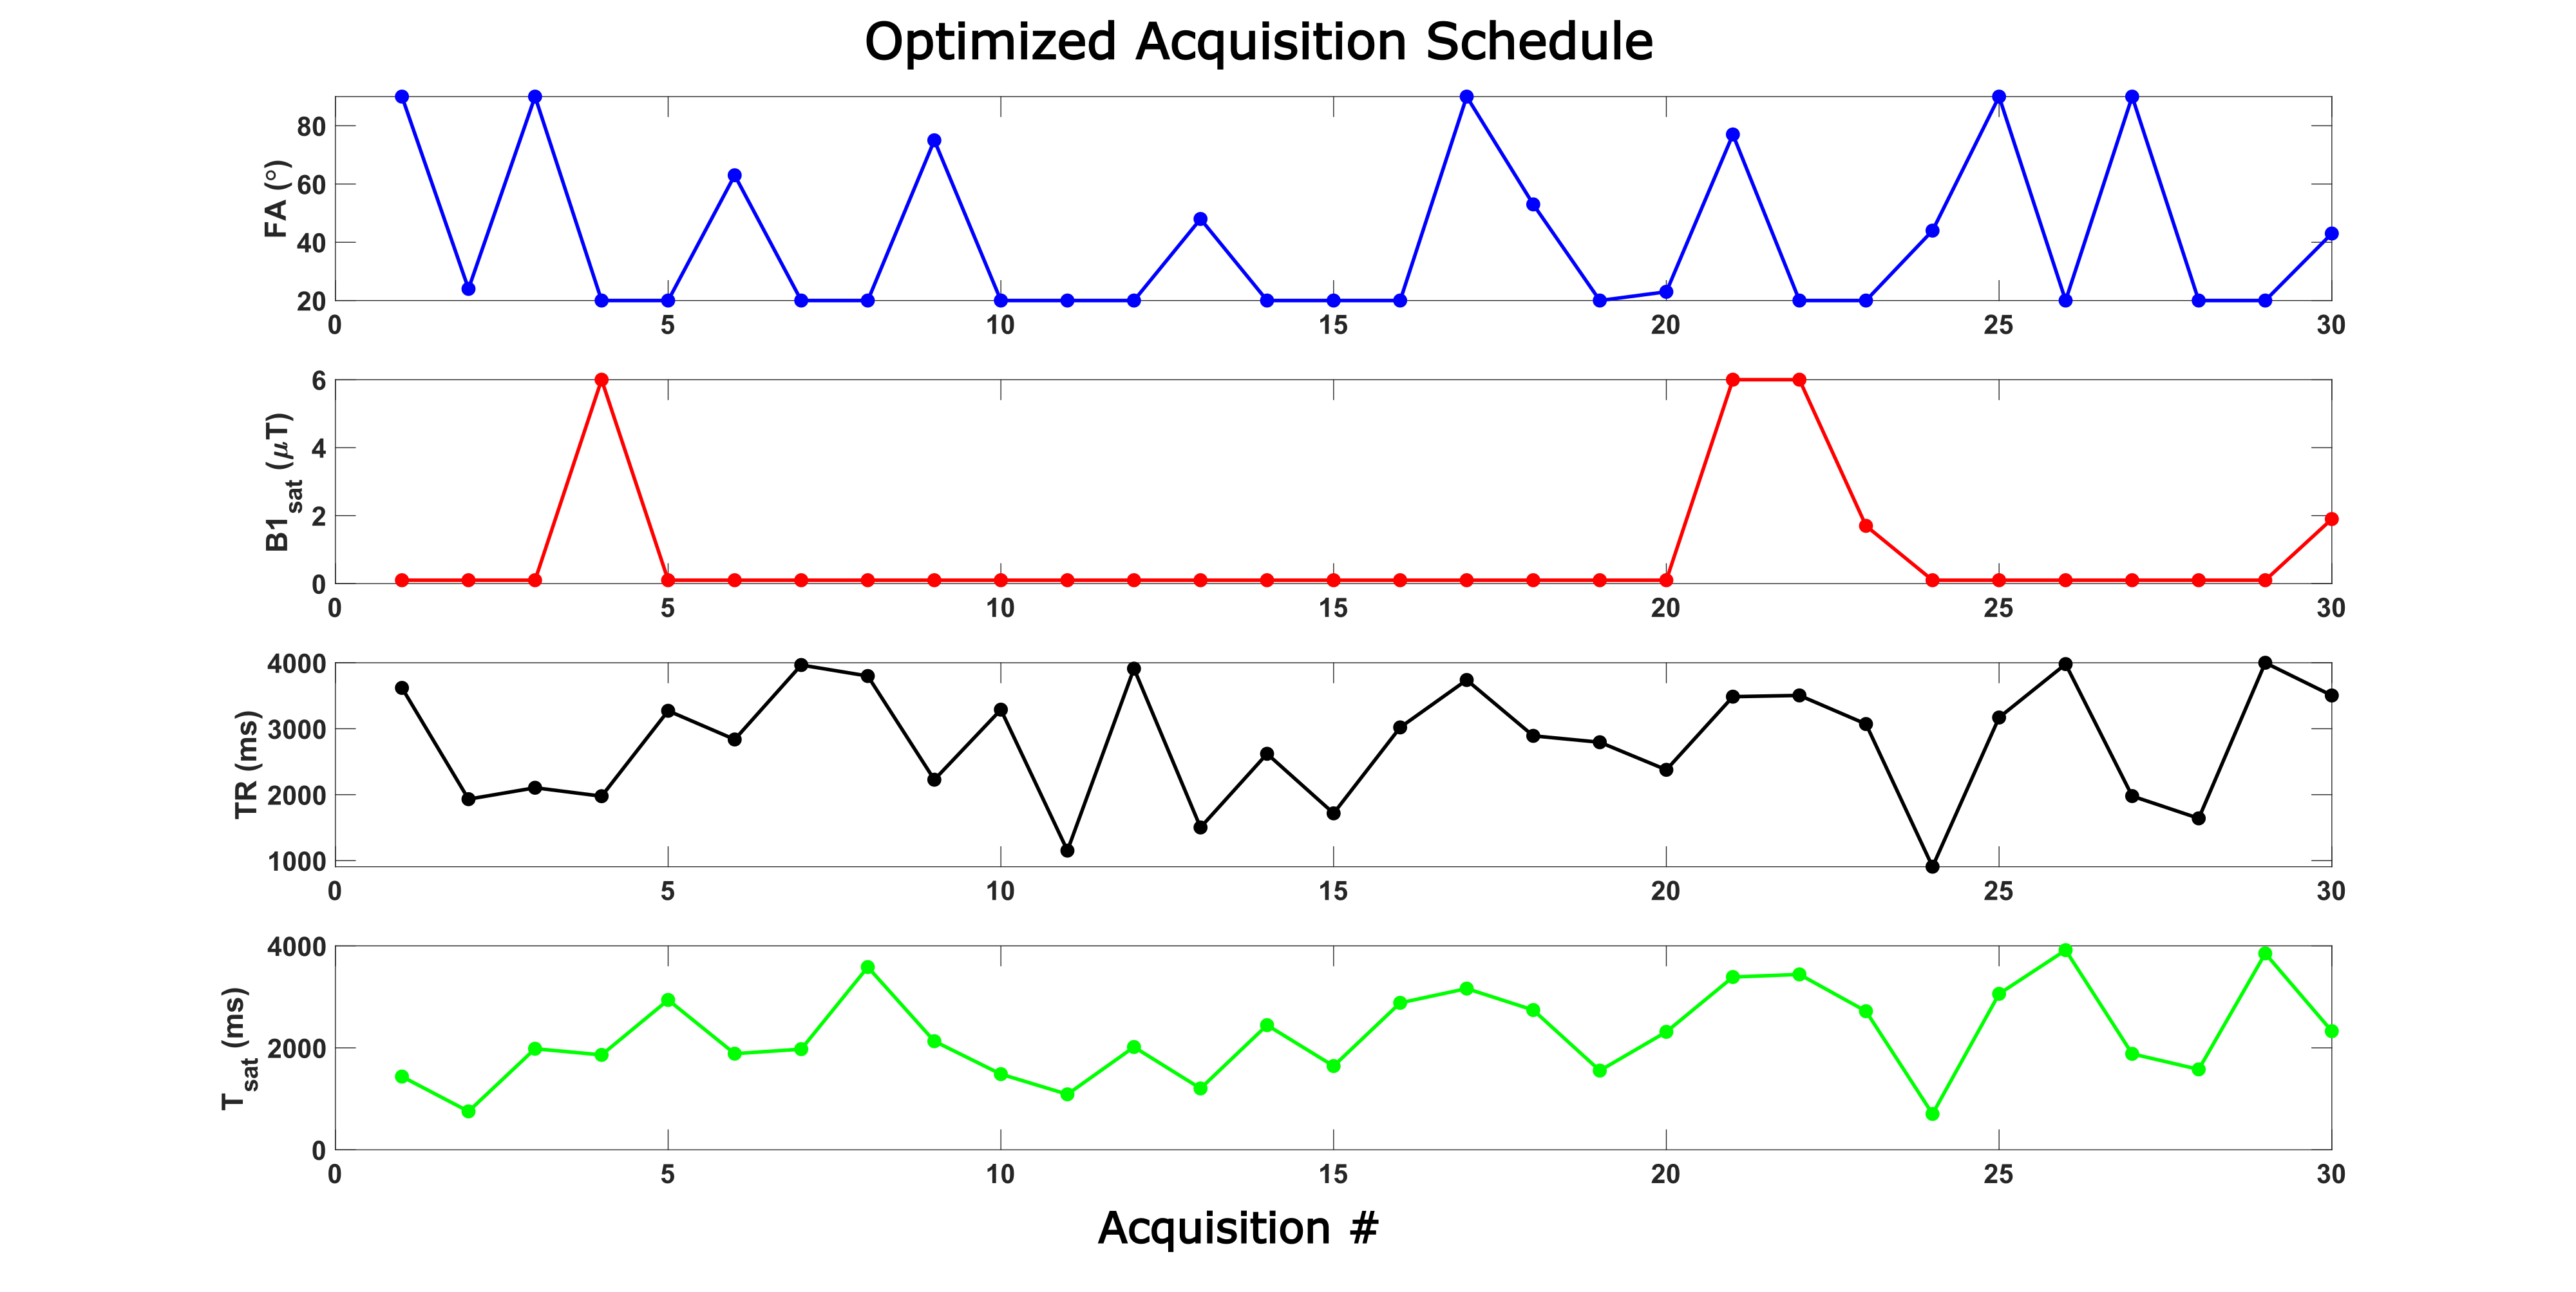
Figure 3: The GluCEST-MRF schedule of acquisition parameters obtained using deep learning optimization. The faster glutamate exchange rate mandated a higher maximum B1sat power as determined by the pattern-search optimizer.
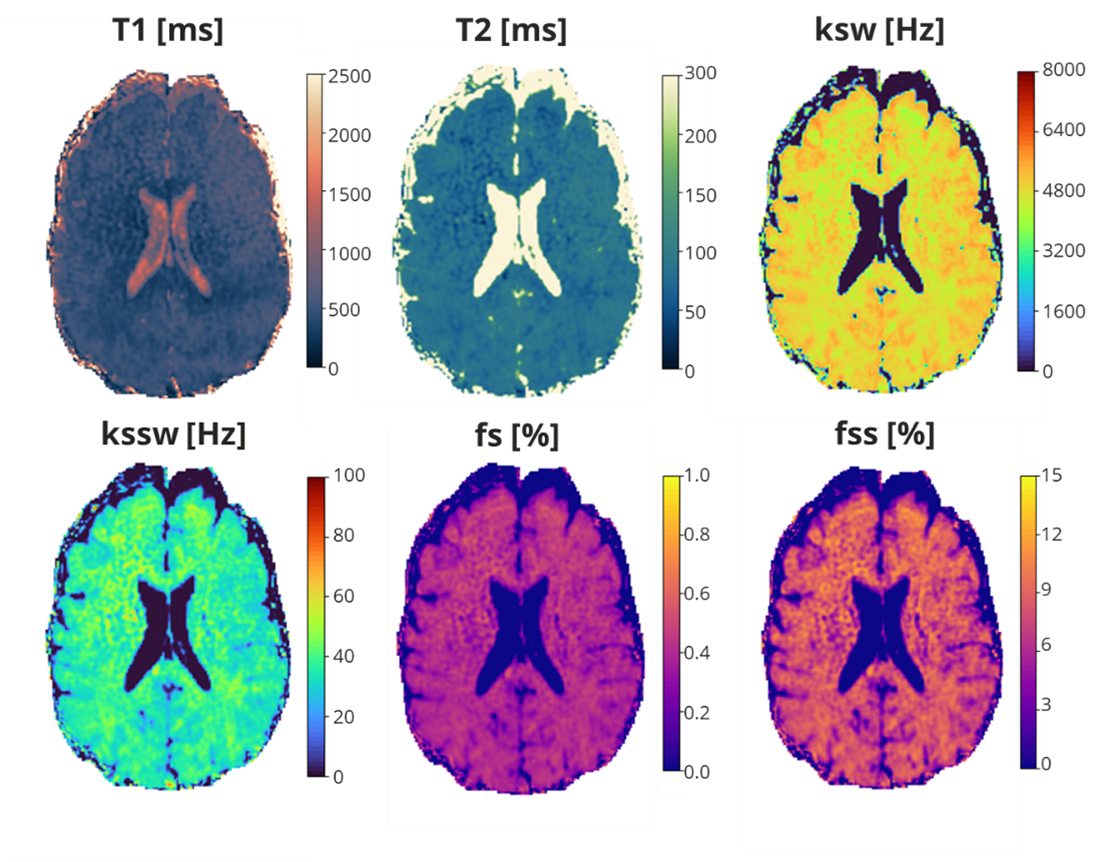
Figure 4: Tissue parameter maps from a healthy male volunteer.

Figure 5: Mean ±SD GM and WM tissue parameter values. Although the T1w was underestimated, the glutamate exchange rate was similar to exchange rates reported in other studies.