0560
Simultaneous acquisition of MR elastography, Dixon and X-ray CT like image1Radiological Sciences, Tokyo Metropolitan University, Tokyo, Japan, 2Keio University Hospital, Tokyo, Japan, 3Sports and Health Sciences, University of East Asia, Yamaguchi, Japan, 4Physical Therapy, Tokyo Metropolitan University, Tokyo, Japan
Synopsis
Keywords: Other Musculoskeletal, Elastography
Motivation: The purpose of study was integration of Dixon and X-ray CT like image technique in the GRE-MultiEcho-MRE sequence.
Goal(s): The additional visualization of bone damage and water / fat compornents on MR elastography would yield benefits in evaluating radiologic skeletal muscle evaluation, since soft tissue injuries can be assessed directly related to the osseous injuries using one image modality.
Approach: The effectiveness of this method was evaluated by volunteer studies using the original MRE pulse sequence and vibration system.
Results: This method allows simultaneous acquisition of elastograms, wave images, water/fat component images and X-ray CT like images.
Impact: For the patient, a reduction in total imaging time is beneficial. For the clinicians, images such as elastograms, wave images, water/fat component images, and X-ray CT are available simultaneously for multimodal diagnosis.
INTRODUCTIONS
Our previous study reported a new method for MRE using a conventional gradient-echo (GRE) type multi-echo MR sequence without motion encoding gradient (MEG)1. The GRE-MultiEcho-MRE uses a series of echoes acquired as a train following a single excitation pulse. The multiple symmetrical gradient-echoes in the GRE-MultiEcho-MRE are acquired by symmetrical bipolar readout gradient lobes. This readout gradient lobes (GRs) have a function like MEG (MEG-like effect). If GRs are synchronized with the vibration frequency, the later generated echo induces a greater MEG-like effect. The MR magnitude image of the 1st echo has the smallest MEG-like effect but provides the best anatomical structure image because the 1st echo signal has the highest SNR, and it is less affected by magnetic susceptibility artifacts. Therefore, the 1st echo image data were used to Dixon method and the MR phase images of 2nd or later echo were used for MRE2.The additional visualization of bone damage and water / fat components on MRI would yield benefits in evaluating radiologic skeletal muscle evaluation, since soft tissue injuries can be assessed directly related to the osseous injuries using one image modality. D. Gascho et al. assessed a modified fast-field-echo (FFE) sequence with multiple echoes for specific bone imaging on MRI. The sequence was termed FFE resembling a CT using restricted echo-spacing (FRACTURE) MRI3.
The purpose of study was integration of Dixon and FRACTURE technique in the GRE-MultiEcho-MRE sequence.
METHOD
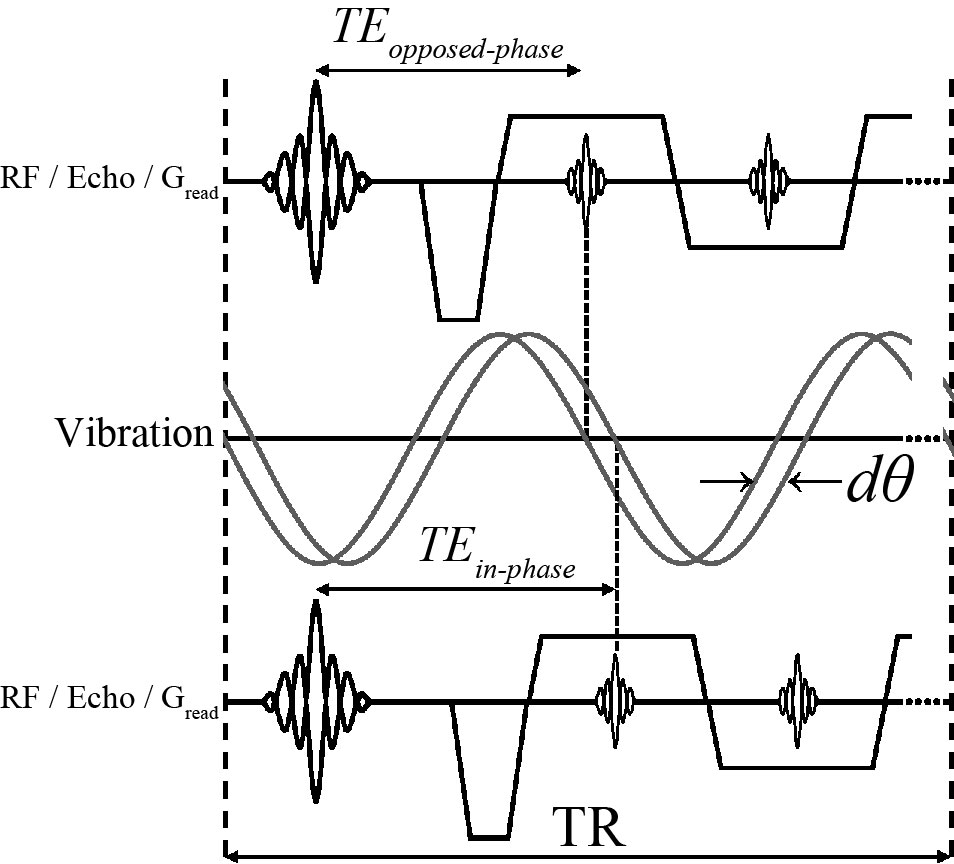
The timing of the RGs was changed along with the changes in the in-phase or opposed-phase TE; the vibration phase also changed (Fig.1), which causes vibration phase mismatch (dθ). Vibration waveform generator corrected this dθ. The dθ was calculated using Eq.[1] as follows:dθ = 360°·Vf·| TEin-TEopp| [1]
where Vf is vibration frequency (Hz), TEin is shortest in-phase TE (s), TEopp is shortest opposed-phase TE (s). The dθ for 50 Hz vibration frequency in 3.0 T MRI is 19.8 degrees. The number of vibration phase offsets was set to 4. The vibration phase offset π/2 and π scans are in-phase TE, and the 3π/2 and 2π scans are opposed-phase TE. These images were averaged at each TE and used to Dixon method.
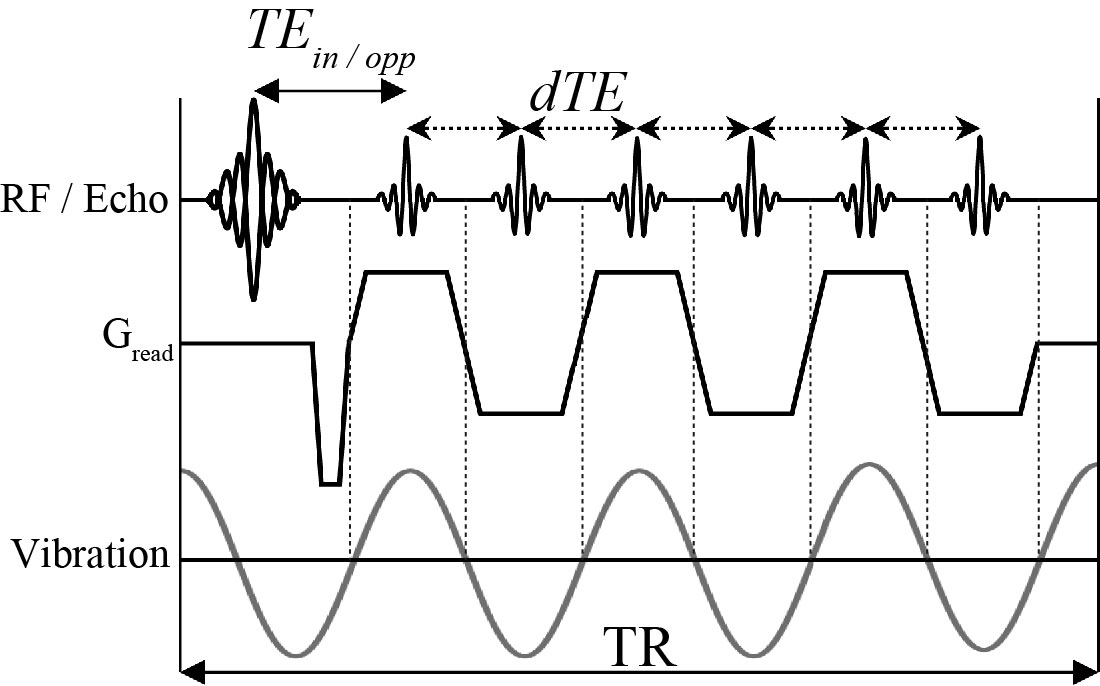
By adjusting the period of GRs, the TE-interval (dTE; Fig. 2 arrowed dash line) of a multi-echo MR sequence can be changed. Thus, the frequency of vibration and the GRs were matched exactly. The readout gradient lobes have a similar function to MEG (MEG-like effect). The dTE for 50 Hz vibration frequency is 10 ms and the one of 100 Hz is 5 ms. Each multi echo TE was calculated using Eq.[2] as follows:
TEnth=1stTEin/opp+n·dTE [2]
where n is order of multi echo. Since dTE is determined by vibration frequency, even if the 1st echo is in-phase (or opposed) TE, the later generated echoes are not necessarily in-phase (or opposed). In this study, this property was used for FRACTURE. From the echoes with in-phase TE were known from Eq. [2], we selected the images with in-phase TE for FRACTURE. The selected in-phase TE images enabled accentuated T2 decay of bones, while the signals from other tissues were preserved.
All MRE experiments were performed on a clinical MR imager (SIGNA Premier; GE HealthCare) using an AIR coil. A self-made waveform generation system (LabVIEW, USB-6221; National Instruments) was used to generate the vibration waveform. This system is capable of generating sinusoidal waveforms with arbitrary frequencies and phases. Power amplifier (XTi 1000; Crown) and a pneumatic pressure generator (Subwoofer TIT320C-4 12”; Dayton Audio) units were used to supply vibrations to a passive driver. The passive driver was designed using a three-dimensional printer (3D touch; 3D system).The MRE sequence parameter were TR: 40 ms, 1st TE: 4.3 ms (in-phase) / 5.4 ms (opposed-phase), dTE: 10 ms, flip angle: 20-degree, matrix: 512, vibration frequency: 50Hz, dθ: 19.8-degree, vibration phase offset: 4, total acquisition time: 20.5 s × 4, MEG-like effect direction: A-P. All elastograms were produced by Local Frequency Estimate (LFE) algorithm freeware (MRE/Wave, MAYO CLINIC).
RESULTS and DISCUSSIONS
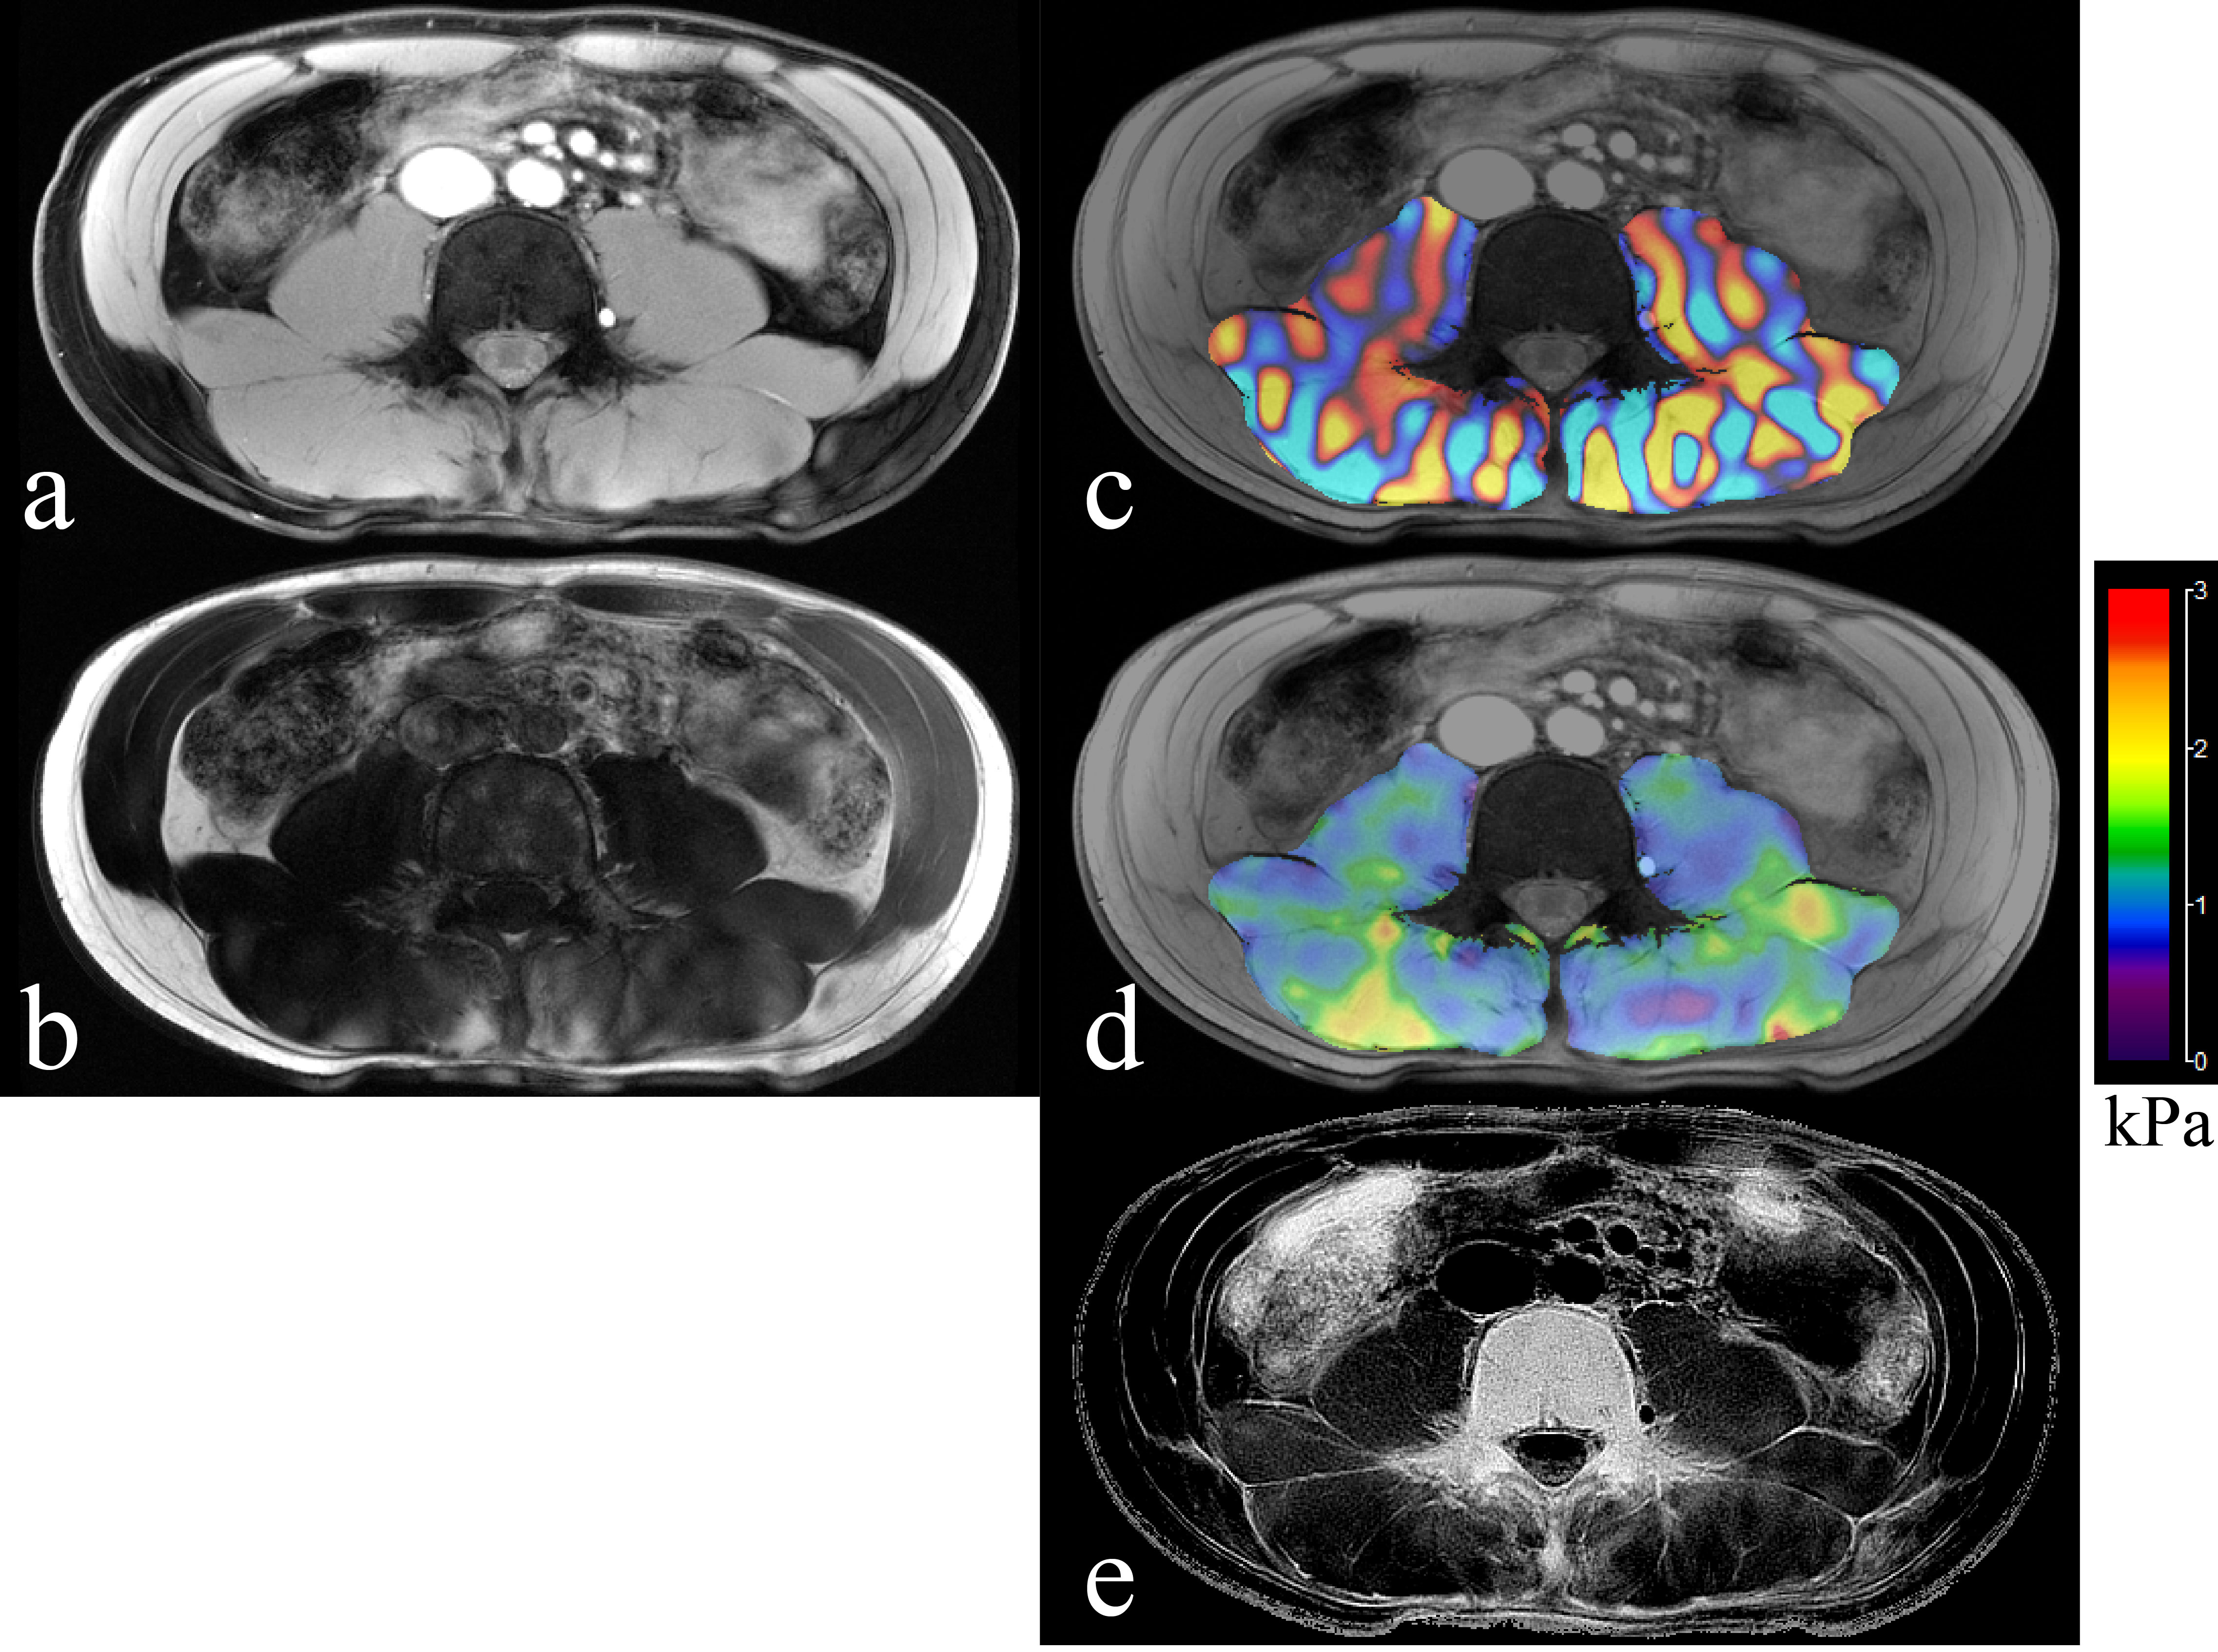
Figure 3 shows the water image (a), fat image (b), wave image (c), elastogram (d) and FRACTURE (e) obtained using the proposed method, respectively. These images demonstrated that separation of the water (muscles, gastrointestinal tract), fat (subcutaneous fat, bone marrow structure) and bone (cortical bone) components (Fig. 3a,b,e), as well as the clear wave propagation on the psoas major and erector spinae muscles (Fig. 3c). Since this method can obtain water/fat image, elastogram, and X-ray CT like image (FRACTURE) from a one series of MRE aquisition, it is suitable for multimodal imaging.Acknowledgements
This work was supported by JSPS KAKENHI Grant Numbers JP22K09338,JP21K17548.References
- Numano T, Mizuhara K, Hata J, et al. A simple method for MR elastography: a gradient-echo type multi-echo sequence. Magn Reson Imaging 2015;33(1):31-37
- Numano T, Ito D, Onishi T, et al. Integration of MR Elastography and Fat/Water Separation Imaging. Proceedings of the ISMRM 25rd annual meeting & exhibition 2017;1381
- Gascho D, Zoelch N, Tappero C, et al. FRACTURE MRI: Optimized 3D multi-echo in-phase sequence for bone damage assessment in craniocerebral gunshot injuries. Diagn Interv Imaging 2020;101:611-615
Figures