0557
Time-resolved multifrequency cardiac MR elastography of the in-vivo human heart using a segmented gradient echo spiral sequence.1Department of Radiology, Charité – Universitätsmedizin Berlin, Berlin, Germany, 2Institute of Medical Informatics, Charité – Universitätsmedizin Berlin, Berlin, Germany, 3Application Development, Siemens Healthcare GmbH, Erlangen, Germany, 4Charité – Universitätsmedizin Berlin, Berlin, Germany, 5Working Group On CMR, Experimental and Clinical Research Center, Berlin, Germany, 6Department of Cardiology and Nephrology, HELIOS Hospital Berlin-Buch, Berlin, Germany, 7DZHK (German Centre for Cardiovascular Research), Berlin, Germany
Synopsis
Keywords: Elastography, Elastography
Motivation: Abnormal changes in myocardial stiffness during the cardiac cycle are a potential biomarker for cardiac diseases. However, there is currently no established MR-method for time-resolved mapping of cardiac stiffness.
Goal(s): To demonstrate the reproducibility of time-resolved stiffness mapping of the in-vivo human heart over the cardiac cycle by MR elastography (MRE).
Approach: Eleven healthy volunteers were examined twice using multifrequency cardiac-triggered, segmented gradient echo spiral MRE for stiffness mapping of the left ventricular myocardium in a short-axis view.
Results: Excellent, good, and moderate reproducibility was achieved for isovolumetric contraction, systolic, and diastolic phases, respectively. Significant differences among all phases were apparent.
Impact: The achieved high reproducibility of cardiac multifrequency MRE, together with its ability to identify distinct time-resolved stiffness levels during the cardiac phases of isovolumetric contraction, systole and diastole, could potentially detect stiffness related cardiac pathology in early disease stages.
Introduction
The shear modulus of the myocardium changes over the cardiac cycle, in proportion to the forces generated by the myocardium.[1,2] MR elastography (MRE) allows the quantification of the shear modulus and has the potential to map stiffness in the myocardium to detect localized scars[3], or relaxation abnormalities such as diastolic dysfunction.[4] Therefore, the aim of this study was to develop MRE for time-resolved stiffness mapping of the in-vivo human heart and to verify its reproducibility.Methods
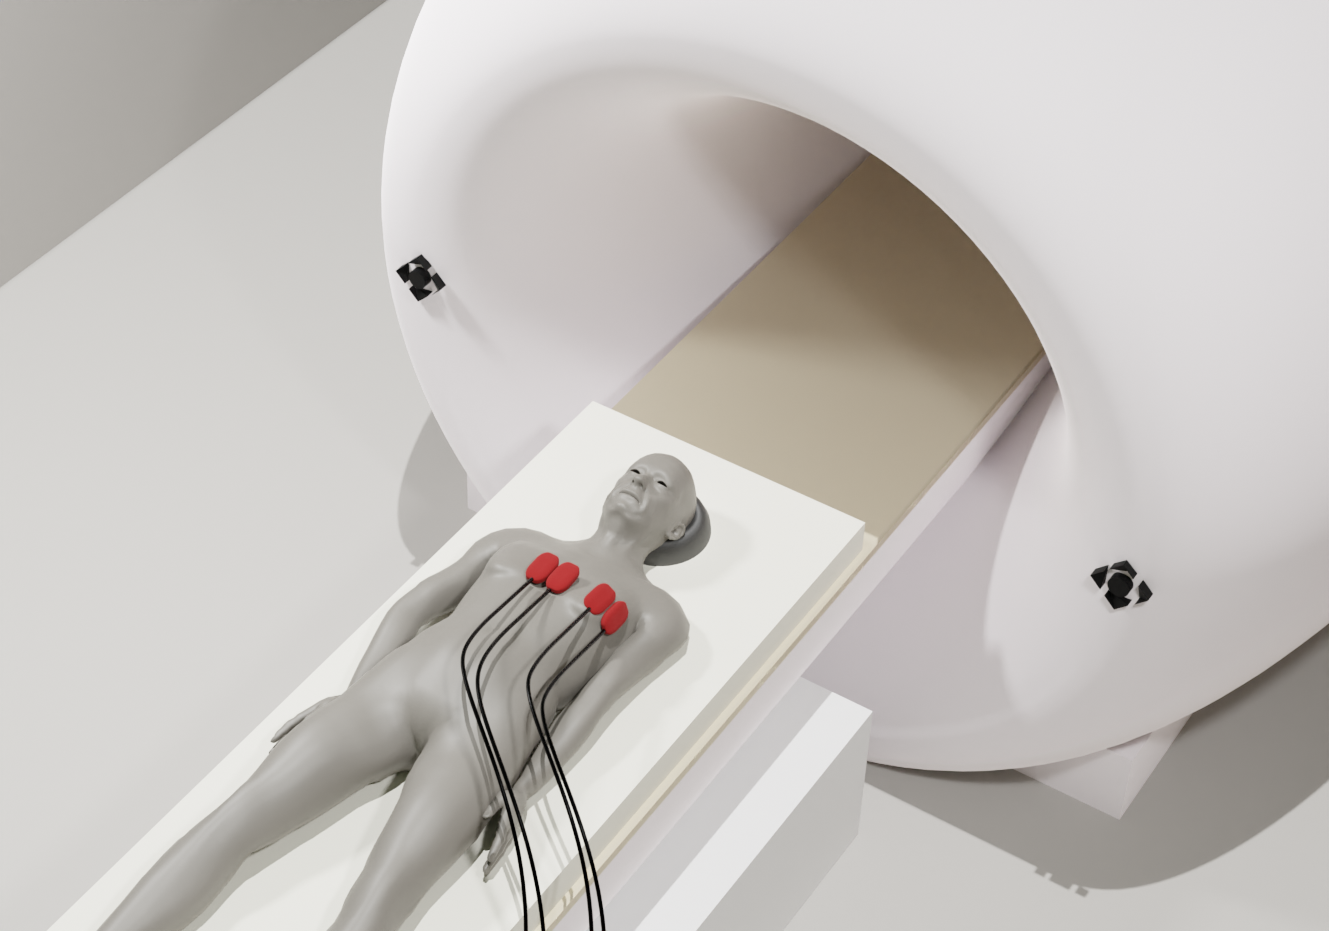
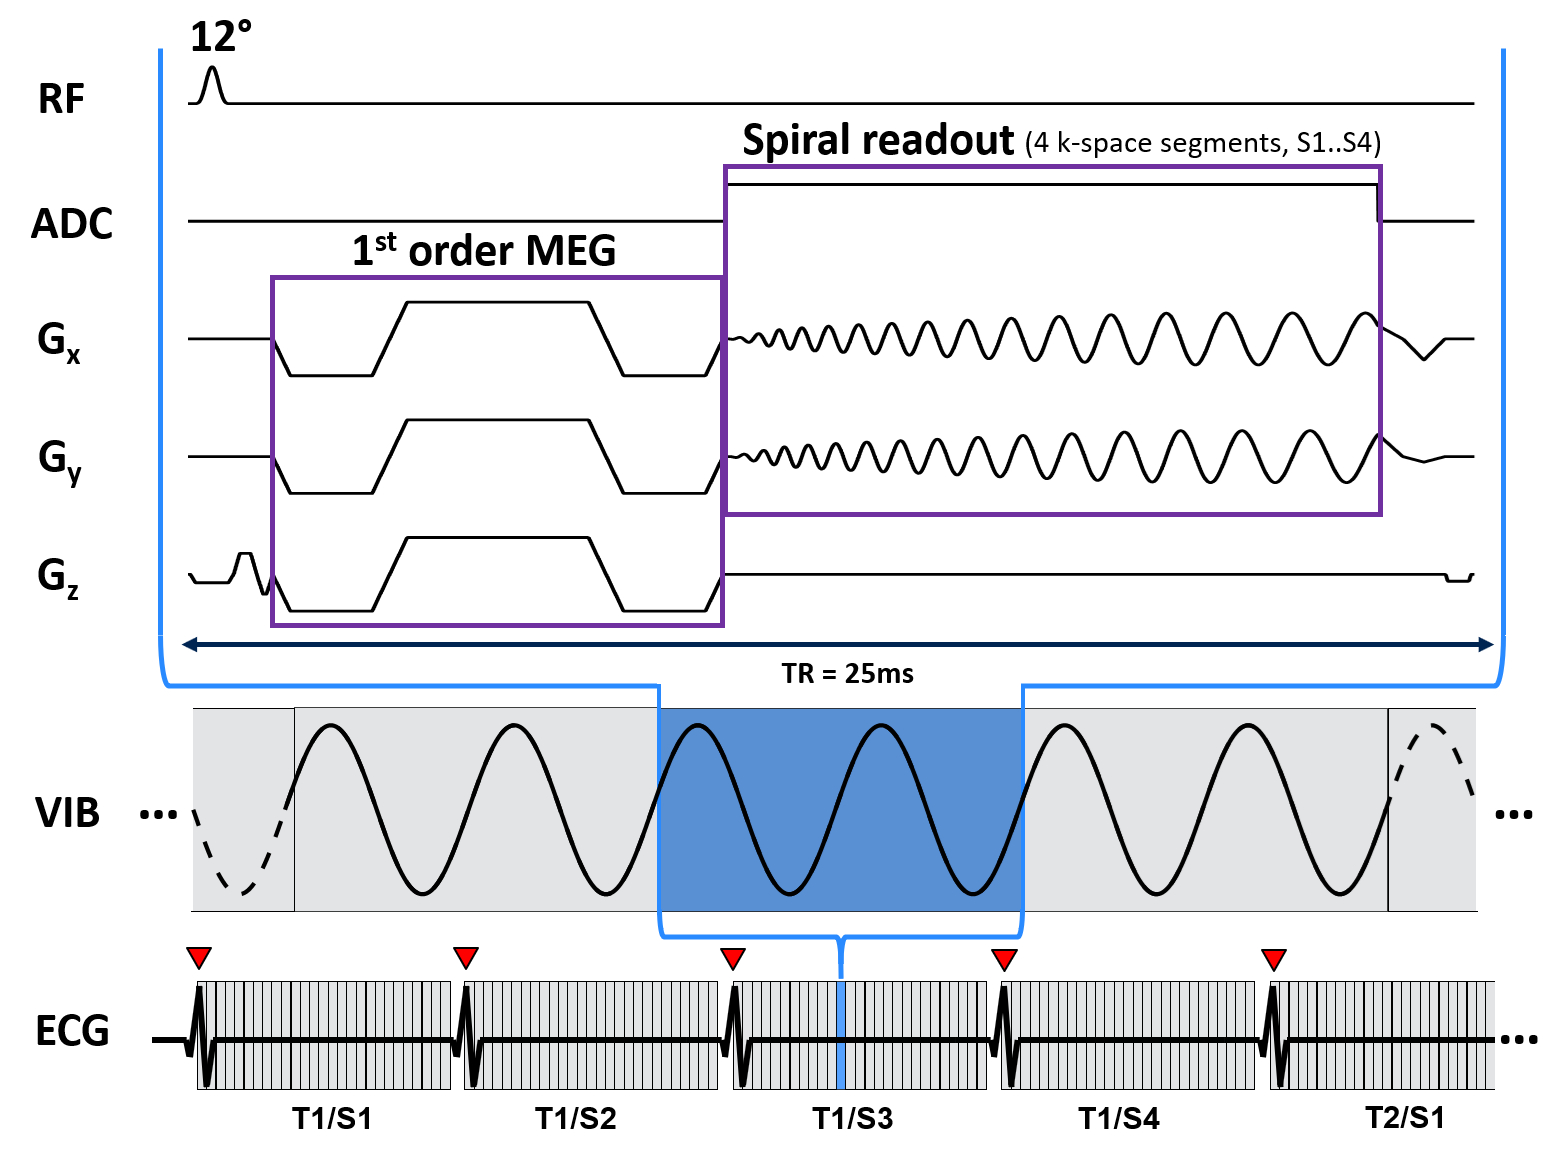
Eleven healthy volunteers (31±7years, all male) were examined twice, seven days apart. For the excitation of shear vibrations, four pneumatic drivers were placed on the anterior thorax of the subjects, two at the corpus sterni, two at the regio pectoralis sinister, as shown in figure 1. Excitation frequencies of 70, 80, and 90Hz were consecutively applied by periodically on/off switching the airflow fed into the drivers. The experiments were performed using a 3-Tesla MRI scanner (MAGNETOM Lumina, Siemens, Erlangen) equipped with a 12-channel receive coil. A scheme of the developed 2D-segmented gradient echo spiral sequence is shown in figure 2. ECG was used to trigger data acquisition at R-waves and continued until the next R-wave. Six wave phases, each consisting of four spiral interleaves, were acquired, leading to a total acquisition time of approximately 24s, while the subject was instructed to hold his breath at end-expiration. The acquisition was repeated for each combination of motion-encoding gradient direction (three) and frequency, resulting in a total acquisition time of six minutes (including breathing intervals). Imaging parameters were: FOV=192×192mm² in short axis view, voxel size=2.0×2.0×8.0mm³, TR=25ms, TE=10ms, 4 spiral interleaves, 2-fold oversampling in k-space center, B0 deblurring[5]. The acquired multifrequency data were processed using the k-MDEV pipeline to reconstruct stiffness maps in terms of shear wave speed (SWS in m/s)[6]. Statistical analysis was performed using Wilcoxon-corrected paired t-tests.Results
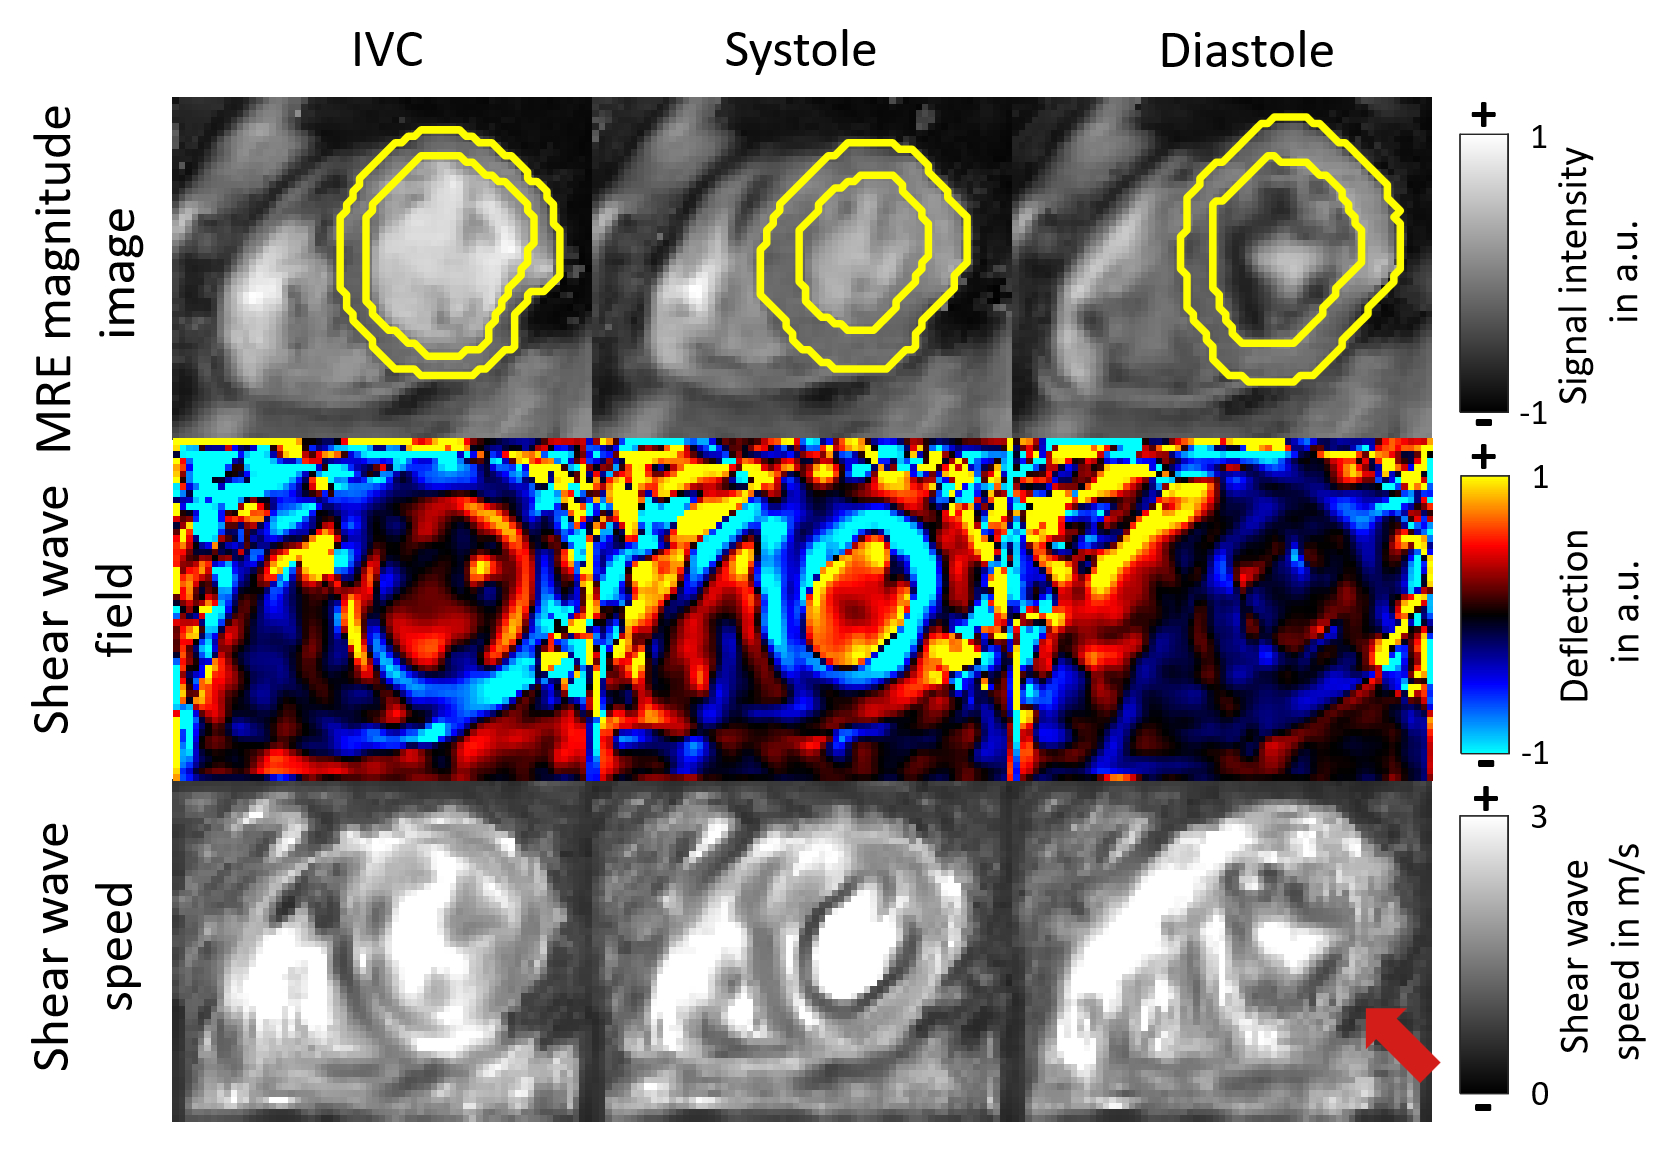
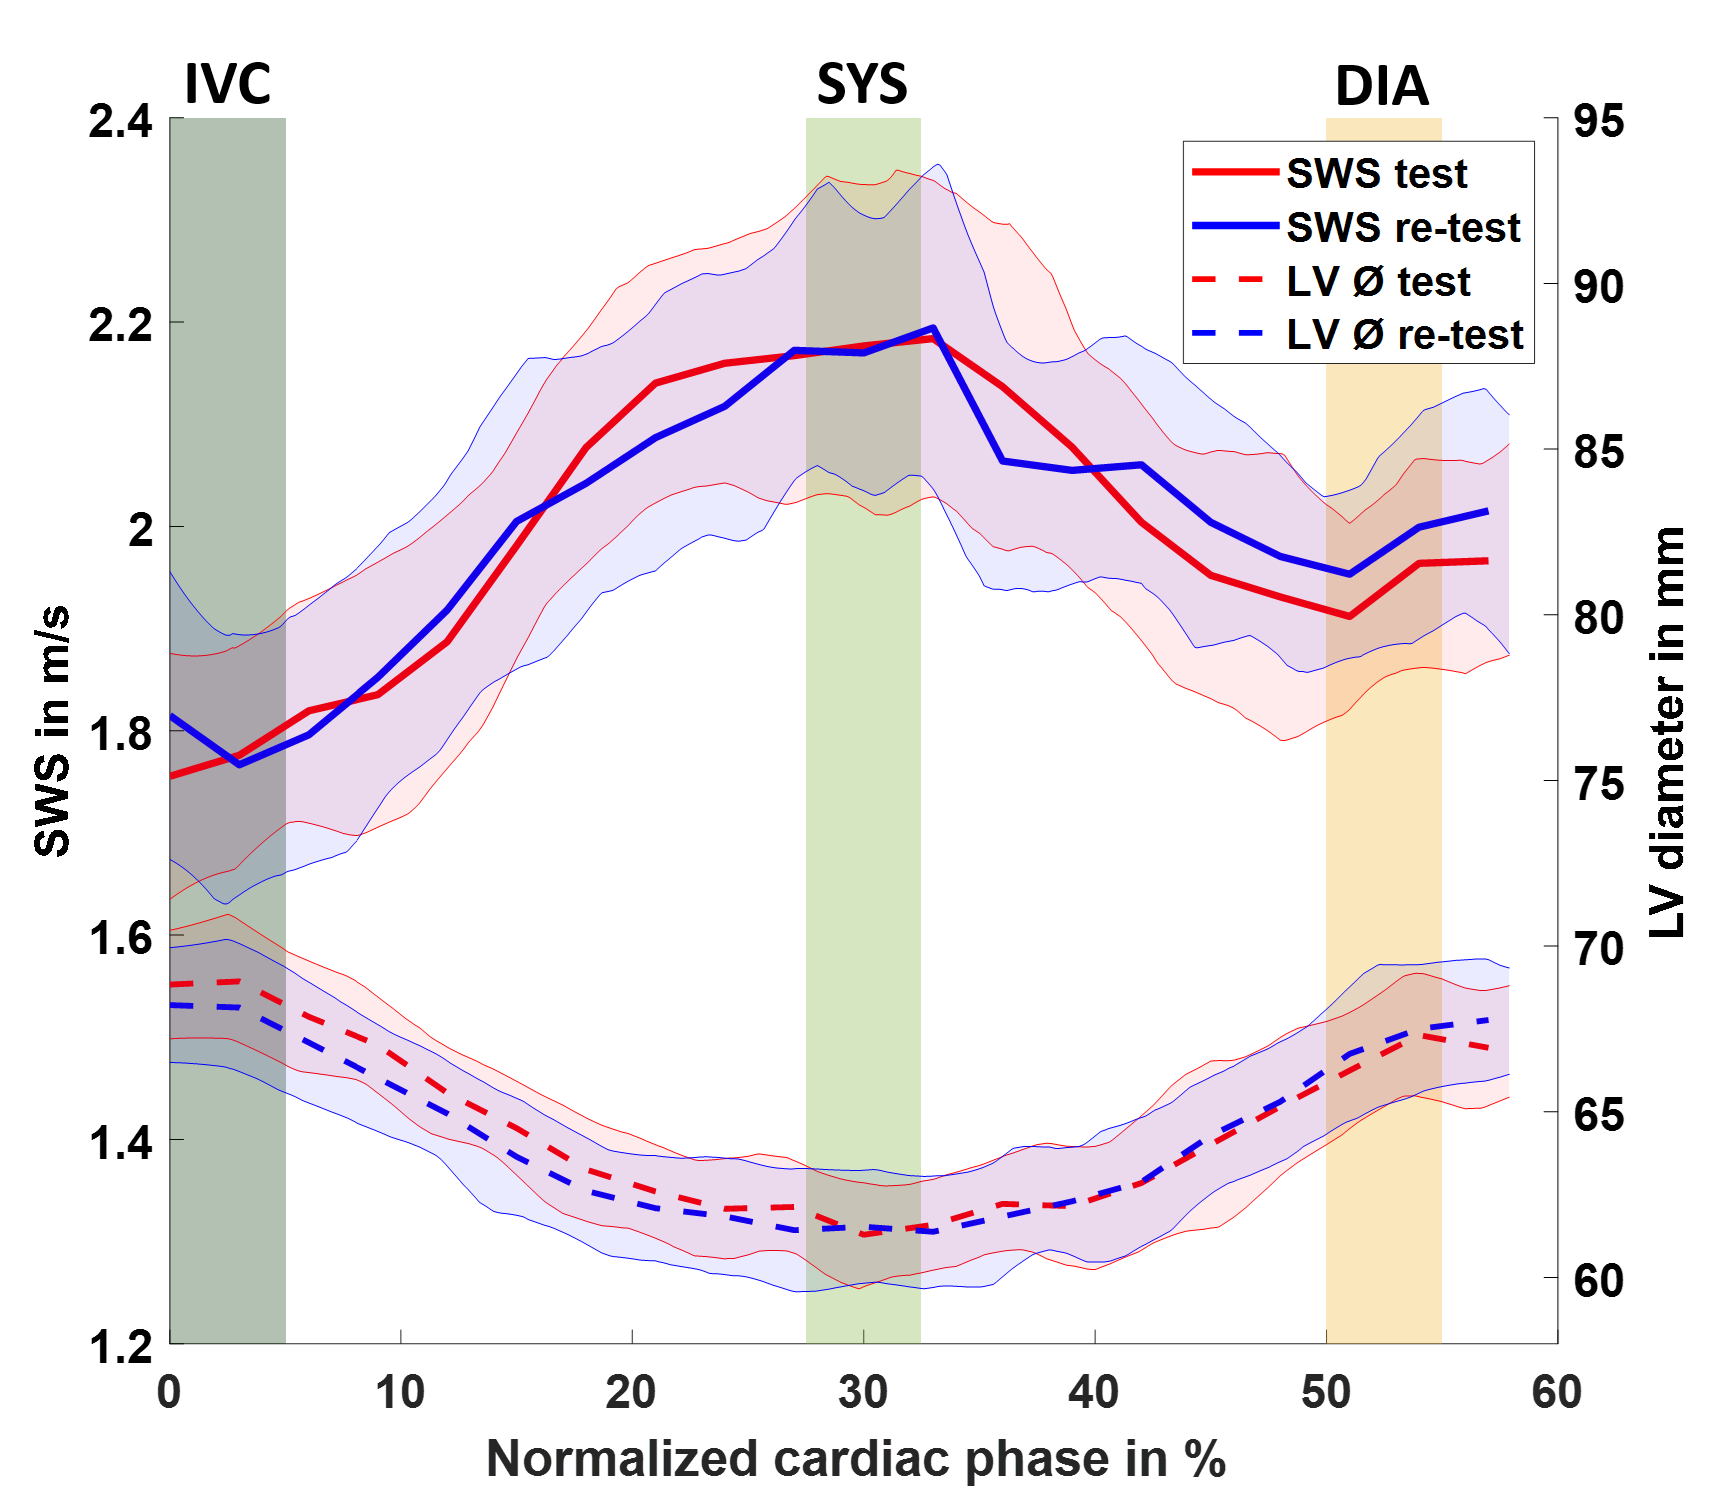
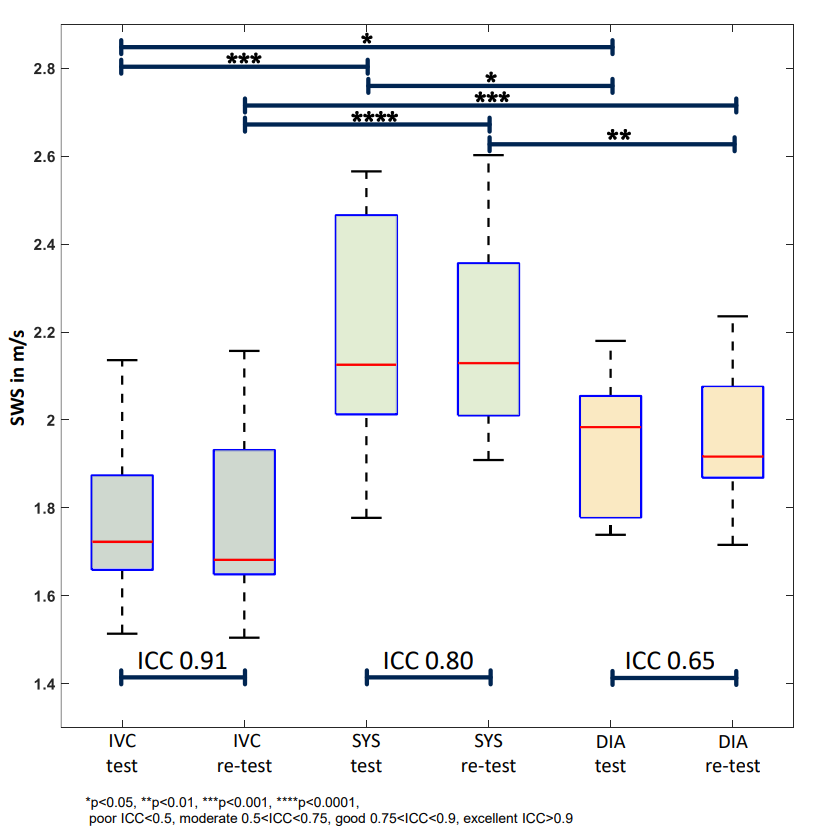
Figure 3 shows maps of the MRE magnitude, shear wave fields, and SWS for the isovolumetric contraction (IVC), systolic, and diastolic phases in a representative volunteer. The left ventricular (LV) myocardium is outlined in yellow in the magnitude image. Due to slight misalignment of k-space segments in distant ECG phases, the image quality of the shear wave field in diastole is reduced. Therefore, inversion artifacts were noted in the diastolic SWS map (red arrow). Figure 4 shows time-resolved of SWS and LV myocardial diameter 95% confidence interval for all volunteers. Averaging both measurements, SWS increased from 1.78±0.20m/s in the IVC to peak values of 2.18±0.20m/s during systole, followed by a decrease to 1.96±0.16m/s during diastole. The exocardial LV diameter decreased from 68.4±3.1mm to 61.5±2.7mm, while it increased again to 67.0±3.2mm during IVC, systole, and diastole, respectively. Figure 5 shows group statistical plot for SWS for the evaluated cardiac phases for test and re-test measurements. Statistical analysis revealed significant differences between IVC (test:1.78±0.18m/s re-test:1.78±0.21m/s), systole (test:2.18±0.26m/s re-test:2.18±0.23m/s), and diastole (test:1.94±0.16m/s re-test:1.98±0.16m/s) for each of the two measurements. Intraclass correlation coefficients (ICC) were 0.91, 0.80 and 0.65 for IVC, systole and diastole, respectively.Discussion
Using a segmented gradient echo spiral sequence, we demonstrated the feasibility of time-resolved cardiac MRE for clinical diagnostic applications. The sequence allowed us to map LV myocardial stiffness throughout the cardiac cycle, providing a high temporal resolution of 25ms and spatial resolution of 2.0×2.0×8.0m³, which outperforms current MRE techniques in the literature providing 125ms[7] and a spatial resolution of 5.0×5.0×5.0mm³[1]. The ICC scores in the IVC, systolic, and diastolic phase, represent excellent, good, and moderate reproducibility, respectively. The temporal distance from the ECG trigger may explain the decrease in ICC scores, as the RR interval varies from heartbeat to heartbeat. This timing inconsistency may affects the k-space signal in later phases of the cardiac cycle more than in early phases reducing the reliability of diastolic SWS values. However, we found for the first time a significant increase in myocardial stiffness from IVC to systole with a factor of 1.23±0.10 while a smaller factor of 1.11±0.09 was found for the systole-to-diastole ratio. Previous work reported a similar stiffness factor between systole and diastole of 1.1 (in terms of SWS)[7]. The diagnostic value of the change in stiffness from IVC to systole and diastole remains to be determined in future studies.Conclusion
This work investigated the reproducibility of a novel multifrequency cardiac MRE sequence for time-resolved SWS mapping of the in-vivo human heart. The myocardium showed 23% higher SWS during systole compared to IVC. Reproducibility showed, excellent, good and moderate results in IVC, systole, and diastole, respectively. Towards clinical application, an increase in diastolic SWS reproducibility, and free breathing acquisition is necessary.Acknowledgements
The authors gratefully acknowledge funding from the German Research Foundation (GRK2260, BIOQIC).References
[1] Hirsch, S., Braun, J., & Sack, I. (2017). Magnetic resonance elastography: physical background and medical applications. John Wiley & Sons.
[2] Elgeti, T., Rump, J., Hamhaber, U., Papazoglou, S., Hamm, B., Braun, J., & Sack, I. (2008). Cardiac magnetic resonance elastography: initial results. Investigative radiology, 43(11), 762-772.
[3] Kolipaka, A., Chatzimavroudis, G. P., White, R. D., O’Donnell, T. P., & Setser, R. M. (2005). Segmentation of non-viable myocardium in delayed enhancement magnetic resonance images. The international journal of cardiovascular imaging, 21, 303-311.
[4] Arani, A., Arunachalam, S. P., Chang, I. C., Baffour, F., Rossman, P. J., Glaser, K. J., Trzasko J. D., McGee K. P., Manduca A., Grogan M., Dispenzieri A., L. Ehman R. L., & Araoz, P. A. (2017). Cardiac MR elastography for quantitative assessment of elevated myocardial stiffness in cardiac amyloidosis. Journal of Magnetic Resonance Imaging, 46(5), 1361-1367.
[5] King, K. F., Ganin, A., Zhou, X. J., & Bernstein, M. A. (1999). Concomitant gradient field effects in spiral scans. Magnetic Resonance in Medicine: An Official Journal of the International Society for Magnetic Resonance in Medicine, 41(1), 103-112.
[6] Tzschatzsch, H., Guo, J., Dittmann, F., Hirsch, S., Barnhill, E., Johrens, K., Braun, J. & Sack, I. (2016). Tomoelastography by multifrequency wave number recovery from time-harmonic propagating shear waves. Medical image analysis, 30, 1-10.
[7] Wassenaar, P. A., Eleswarpu, C. N., Schroeder, S. A., Mo, X., Raterman, B. D., White, R. D., & Kolipaka, A. (2016). Measuring age‐dependent myocardial stiffness across the cardiac cycle using MR elastography: a reproducibility study. Magnetic resonance in medicine, 75(4), 1586-1593.
Figures