0550
Predictions of Human Prostate Cancer with MRS Metabolomics from Biopsies After More Than 5-Year Follow-Up1Massachusetts General Hospital, Harvard Medical School, Boston, MA, United States
Synopsis
Keywords: Prostate, Cancer, Metabolomics, metabolomic imaging, nuclear magnetic resonance, spectroscopy, prostate cancer, MRI-US fusion, biopsy
Motivation: Evaluations of prostate cancer (PCa) with traditional transrectal ultrasound (TRUS) and multiparametric MRI-ultrasound (mpMRI-US) fusion biopsies may produce false-positives or false-negatives, thereby preventing optimal and timely treatments.
Goal(s): To evaluate PCa metabolomics from TRUS and fusion biopsy cores using magnetic resonance spectroscopy (MRS) to identify potential metabolomic biomarkers for better characterization of PCa.
Approach: Using ex vivo MRS, we measured 432 prostate biopsy cores from patients suspicious of PCa between 4/2006 and 10/2018.
Results: MRS metabolomics could differentiate between benign and malignancy, reflect malignant status from benign cores, and allowed for predictions of future PCa from benign biopsies.
Impact: Our results demonstrate that MRS-based metabolomic evaluations have the potential to detect PCa years earlier than standard TRUS and fusion biopic techniques, and improve PCa active surveillance based on prostate biology.
Introduction
Prostate cancer (PCa) is one of the most prevalent and fatal malignancies for men worldwide.1 Standard screening and diagnostic tools, including prostate specific antigen (PSA) testing, digital rectal examinations (DRE), and 12-core transrectal ultrasound (TRUS) biopsy, suffer from a lack of PCa-specificity and sensitivity, resulting in overtreatment of indolent PCa.2,3 The combination of multiparametric magnetic resonance imaging (mpMRI) and ultrasound (i.e. “fusion” biopsy) allows for improved visualization of anatomical structures, assessment of tumor aggressiveness, and probe-tracking capabilities4; however, fusion biopsies are still prone to false-positive and false-negative results due to various technical and practical factors.5 Metabolomics, as a promising field for cancer biomarker discovery, can provide new perspectives for evaluating PCa prognosis, aggressiveness, and clinical significance. In this study of >15 years, we present the capacity for metabolomic analyses to not only distinguish between PCa and benign tissues, but also differentiate patients who are diagnosed with PCa years after initial negative biopsy.Methods
Biopsy cores. Over a period of 15 years and with 10 years of follow-up until now, 432 biopsy cores from 332 patients suspicious for PCa underwent TRUS (n=232) and fusion (n=100) biopsies (Table 1). One core from TRUS biopsies, and two cores from fusion biopsies (one target and one non-target core opposite the target) underwent ex vivo magnetic resonance spectroscopy (MRS) analysis. Spectroscopy. All cores were analyzed by high-resolution magic angle spinning (HRMAS) MRS on a Bruker 600MHz spectrometer at 4ºC with a rotor-synchronized Min(A,B) protocol with spinning at 600 and 700Hz.6 Data analysis. Spectra were curve-fit and transformed into statistical matrices using a MATLAB-based program. Metabolic spectral regions of interest (ROIs) (n=48) with >60% of samples presenting detectable values were analyzed with principal component analysis (PCA) and other statistical tools. Following MRS analysis, all 432 cores returned to pathology for quantitative pathological evaluations, which were recorded in patient records.Results
Prediction of PCa through patient follow-ups: We classified all 432 cores according to their diagnosis at three separate time points: Class 1 reflects patient diagnosis at the time of biopsy (t=0), Class 2 at 5 years post-biopsy (t=5), and Class 3 at 10 years post-biopsy (t=10) (Figure 1). HRMAS MRS could differentiate between cancer and benign cores at the time of biopsy. Benign cores obtained from PCa-positive patients were statistically significant (p<0.05) from cancer or benign states for different ROIs, with principal component (PC) 2 presenting the most significant difference between Class 1a and 1b (Figure 2A). Based on measurements of biopsy cores at time t=0, metabolomic differentiation between Class 2a and 2b patients (which represents PCa discovered within five years post-biopsy) was possible, reflecting a trend similar to that which was observed between Classes 1a and 1b (Figure 2B). Finally, we identified several spectral regions capable of differentiating between patient subclasses across all three time points. One such region, 3.24-3.22 ppm, shown in Figure 3, demonstrates how the metabolomic profile of Class 3b patients closely approximates that of cancer conditions, i.e., Class 3c and 3d patients, at t=10.Fusion Biopsy: For each patient who received a fusion biopsy, we collected one PCa-suspected target core and one non-target contralateral core. Our measured metabolomics, examined as both individual ROIs and metabolomic profiles represented by PCs, could differentiate these two groups, as shown in Figure 4.
Discussion & Conclusion
Here, we demonstrate the capability of measuring PCa metabolomics non-destructively from human biopsy cores using ex vivo HRMAS MRS, and present the predictive potential of PCa metabolomics as measured from biopsy cores through patient follow-ups from 5~15 years. Most notably, predictions of negative biopsy patients, who were discovered to have PCa within 5 years of biopsy, may be achieved with MRS-based metabolomics. Longer follow-ups are still needed and are currently continued in our laboratory.Importantly, our reported study illustrates a paradigm that resolves a challenge that consistently hinders clinical investigations, including other prostate biopsy studies: a lack of healthy control groups. Our study, with extensive metabolomic documentation and patient follow-ups, identified PCa profiles for patients with benign biopsies and without clinically significant PCa for 5 years (Class 2a) and 10 years (Class 3a) after initial biopsies.
Further analyses of the presented predictive metabolomics profiles according to PCa metabolic pathways are currently underway in our laboratory and will be presented at the meeting. Furthermore, detailed results of a subset of the current study, the fusion biopsies, will also be discussed.
Acknowledgements
NIH Grants: R01 AG070257 and R01 CA273010. MGH Martinos Center for Biomedical Imaging.References
1. Siegel RL, Miller KD, Wagle NS, Jemal A. Cancer statistics, 2023. CA Cancer J Clin. 2023;73(1):17-48.
2. Martin RM, Donovan JL, Turner EL, et al. Effect of a Low-Intensity PSA-Based Screening Intervention on Prostate Cancer Mortality: The CAP Randomized Clinical Trial. Jama. 2018;319(9):883-895.
3. Kesch C, Schütz V, Dieffenbacher S, et al. Multiparametric MRI fusion-guided biopsy for the diagnosis of prostate cancer. Curr Opin Urol. 2018;28(2):172-177.
4. Tyson MD, Arora SS, Scarpato KR, Barocas D. Magnetic resonance-ultrasound fusion prostate biopsy in the diagnosis of prostate cancer. Urol Oncol. 2016;34(7):326-332.
5. Gold SA, Hale GR, Bloom JB, et al. Follow-up of negative MRI-targeted prostate biopsies: when are we missing cancer? World J Urol. 2019;37(2):235-241.
6. Burns MA, Taylor JL, Wu CL, et al. Reduction of spinning sidebands in proton NMR of human prostate tissue with slow high-resolution magic angle spinning. Magnetic resonance in medicine. 2005;54(1):34-42.
Figures
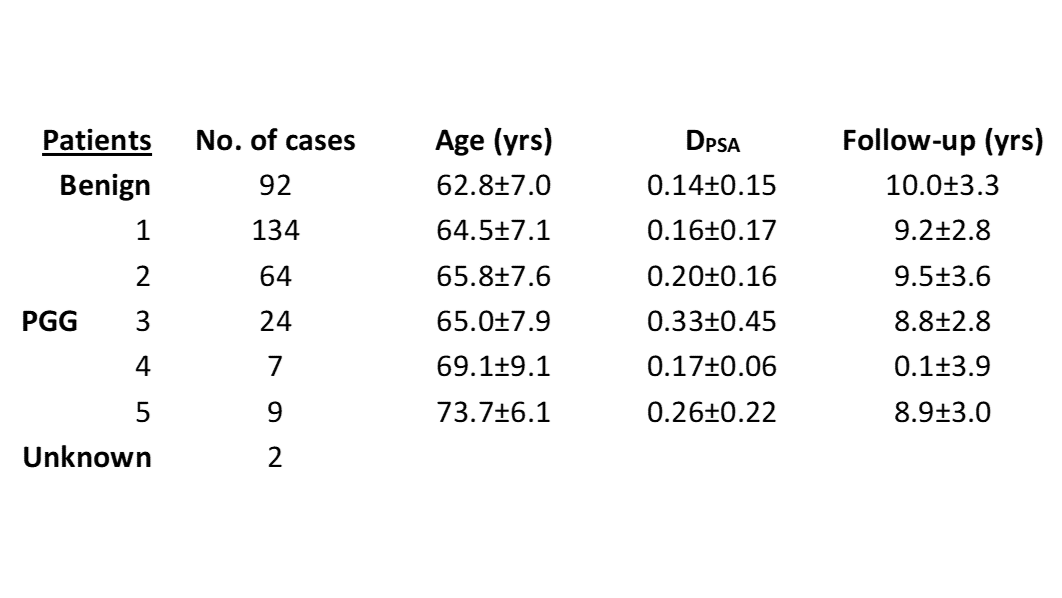
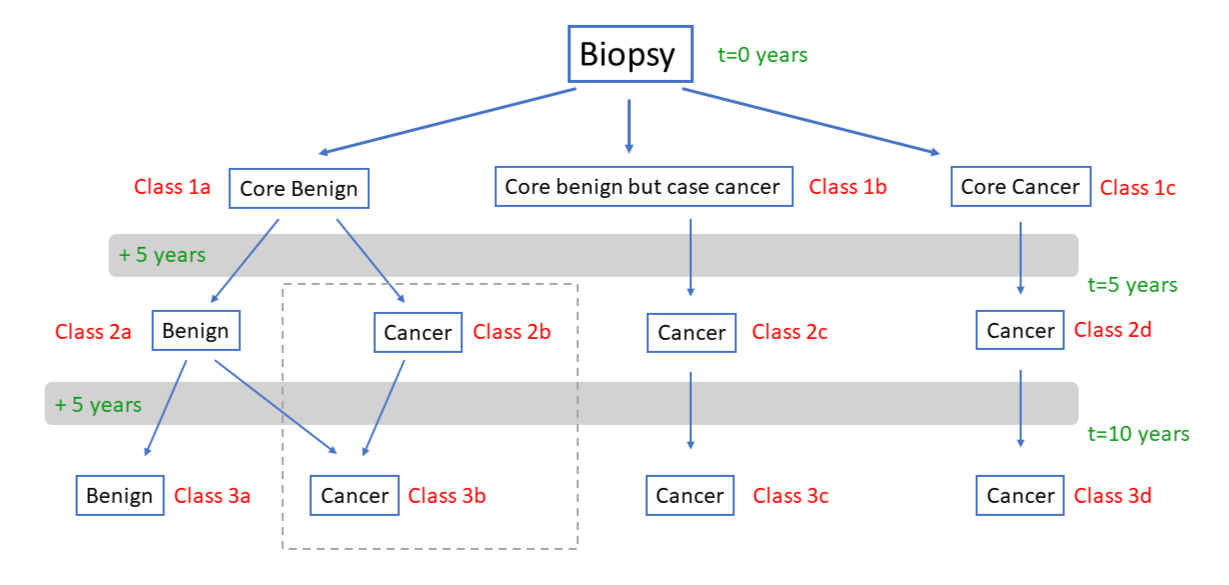
Figure 1: Patient classification. Patients suspicious for PCa underwent mpMRI-US fusion or TRUS biopsy and were separated into three groups based on their prostate core and case diagnosis (Class 1a-1c). Five years later, all patients were reclassified according to their updated diagnosis (Class 2a-2d), and again 10 years post-biopsy (Class 3a-3d). The dotted box highlights Class 2b and 3b patients, who were benign at the time of biopsy but later diagnosed with PCa.
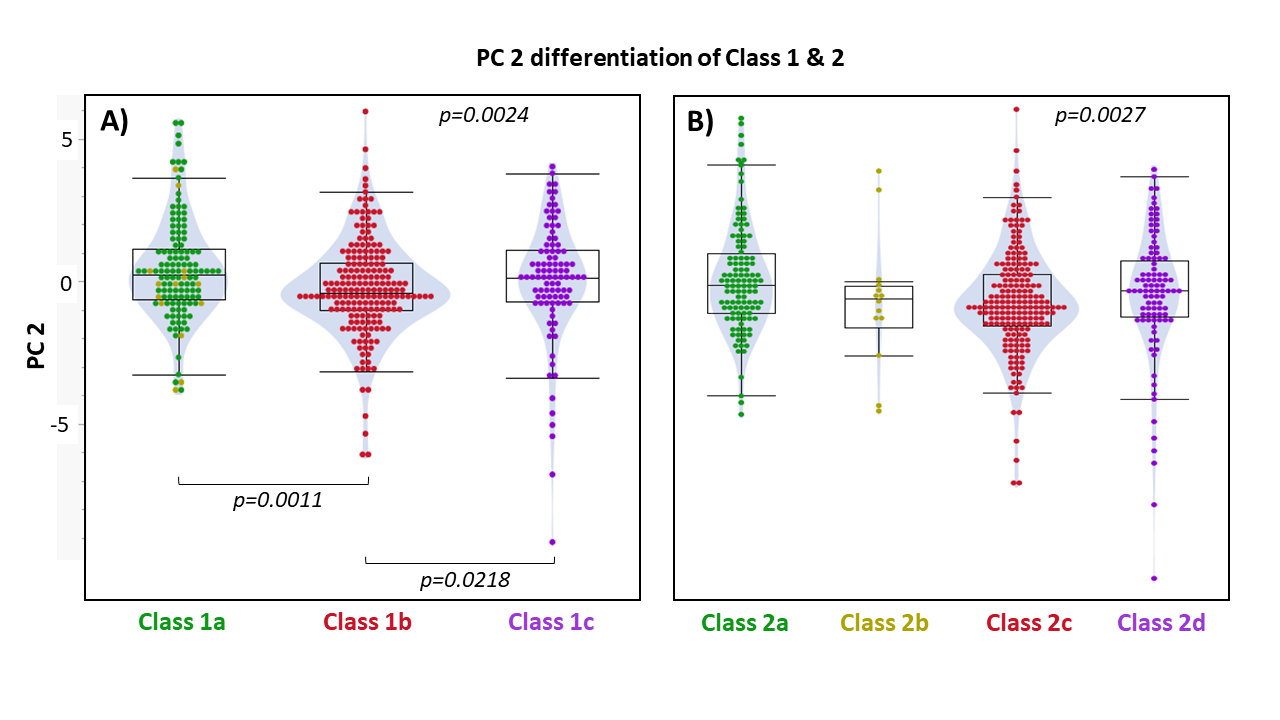
Figure 2: Principal component differentiation of A) Class 1 and B) Class 2 patients. As the most significant PC, PC 2 can differentiate Class 1 and Class 2 subgroups. Statistically significant p-values (p<0.05) are shown for between-group and whole-group comparisons.
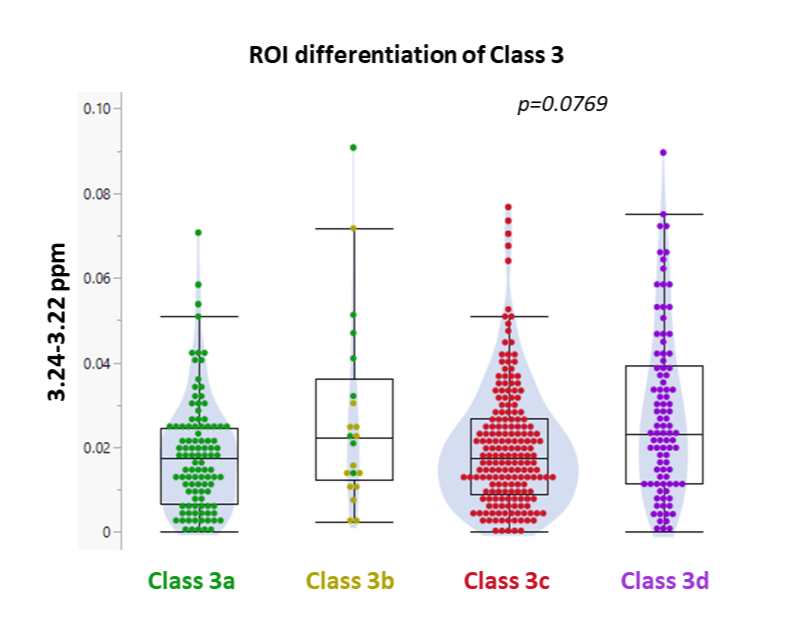
Figure 3: Spectral region differentiation of Class 3 patients. 3.24-3.22 ppm is one of several spectral regions capable of distinguishing between Class 2 subgroups. The p-value for the whole-group comparison is not significant (p<0.05); however, Class 3b approximates the distributions of Class 3c and 3d more closely than the distribution of Class 3a.
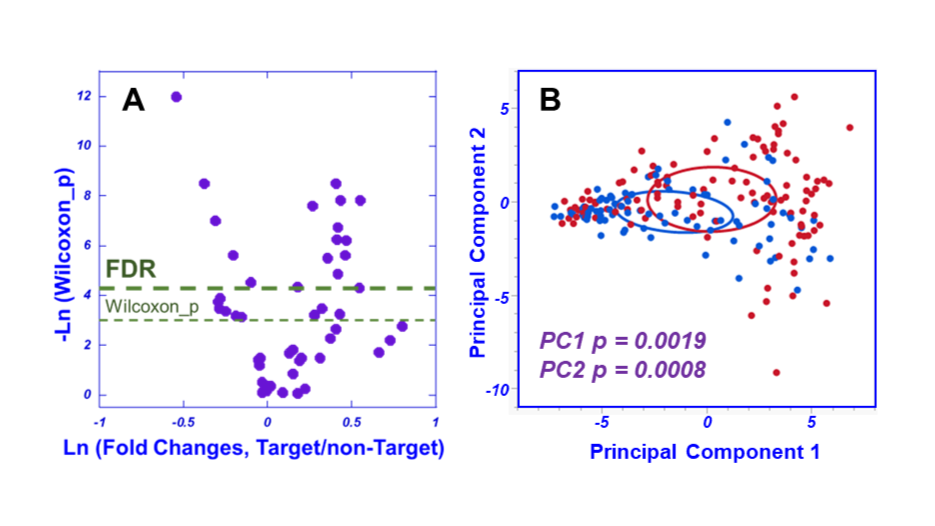
Figure 4: Metabolomic differentiations of Target and non-Target fusion biopsy groups. A) In this volcano plot, the ROIs above the thin dashed line present significant p values based on Wilcoxon tests, while the ROIs above the thick dashed line are significant after false discovery rate (FDR) corrections. B) Target cores are presented in red, and non-Target cores in blue. The illustrative density ellipses represent 25% levels.