0548
1H MR spectroscopy and IVIM-DWI to evaluate the effect of a choline kinase inhibitor and temozolomide therapy in a mouse model of glioblastoma1University of Liverpool, Liverpool, United Kingdom, 2Symbiosis Centre for Medical Image Analysis, Symbiosis International (Deemed University), Pune, India, 3Institute for Advancing Intelligence (IAI), TCG CREST, Kolkata, India, 4Department of Veterinary Anatomy Physiology and Pathology, University of Liverpool, Chester, United Kingdom
Synopsis
Keywords: Small Animals, Cancer, MRS, IVIM, treatment response
Motivation: There is a lack of comprehensive understanding regarding the impact of choline kinase inhibition and standard chemotherapy on preclinical GBM models.
Goal(s): The primary goal of this study was to elucidate the treatment response mechanism in a preclinical GBM mouse model.
Approach: MRS and IVIM-DWI were used for monitoring metabolic and microstructural changes in a preclinical GBM model by single or combination therapy with a choline kinase inhibitor and TMZ.
Results: Our findings indicate that the combination therapy is the most effective treatment regimen. This study contributes to a better understanding of treatment response mechanisms and underscores the potential of non-invasive MRI methods.
Impact: Targeting ChoKα inhibition and the damage of DNA replication (TMZ) promises to be an alternative in the treatment of GBM. This research also highlights the importance of MRS and IVIM-DWI as promising non-invasive methods to assess therapeutic effects on GBM.
Author Information
* Denotes equal contributionIntroduction
An overexpression of choline kinase α (ChoKα) is a hallmark of tumour progression1. Total choline (tCho) has been proposed as a pharmaco-dynamic marker for monitoring response to ChoKα inhibition in rodent models of glioblastoma (GBM)2. Previous studies have reported magnetic resonance spectroscopy (MRS) findings assessing inhibition of ChoKα in a rat model3 and in mouse models of breast cancer4. Temozolomide (TMZ) is an effective standard of care chemotherapy in the treatment of GBM5-6. Another technique known as Intravoxel Incoherent Motion Diffusion-Weighted Imaging (IVIM-DWI) has shown encouraging findings in assessing treatment response in gliomas7. MN58b works by inhibiting the overexpressed ChoKα leading to mitotic arrest while TMZ damages the DNA replication of tumour cells and triggers cell death. This study was therefore conducted to explore the synergistic effects of the two drugs on GL261 mouse model of GBM using 1H MRS and IVIM-DWI.Methods
C57BL6 mice were injected intracranially with 2.5x10⁵ GL261 GBM cells in the right cortex. Once the tumours were observed on T2 weighted MRI, animals were divided into 4 groups and treated for five consecutive days: 1) Saline control (n=12, intraperitoneal injection), 2) i.p. injection of 4 mg/kg MN58b (n=12), 3) 50mg/kg TMZ via oral gavage (n=7), and 4) Mn58b+TMZ (n=7). Imaging was performed on days 0 (baseline), 3 (during treatment), and 6 (end of treatment). Single voxel (2x2x2 mm3) MRS spectra were acquired from the tumour region using a PRESS sequence: TR = 2000 ms, TE1 = 9.13 ms and TE2= 7.37 ms, number of averages= 200, complex points = 2048 and spectral width =4401 Hz. Metabolite amplitude ratios (tCho/NAA, Lip+Lac/tCr and mI/tCr) were calculated using jMRUI software. IVIM-DWI was performed using a spin-echo planar imaging (EPI) sequence with 13 b values to evaluate IVIM parameters D, D* and f using MATLAB. Two-way ANOVA with Bonferroni correction was applied at p < 0.05.Results
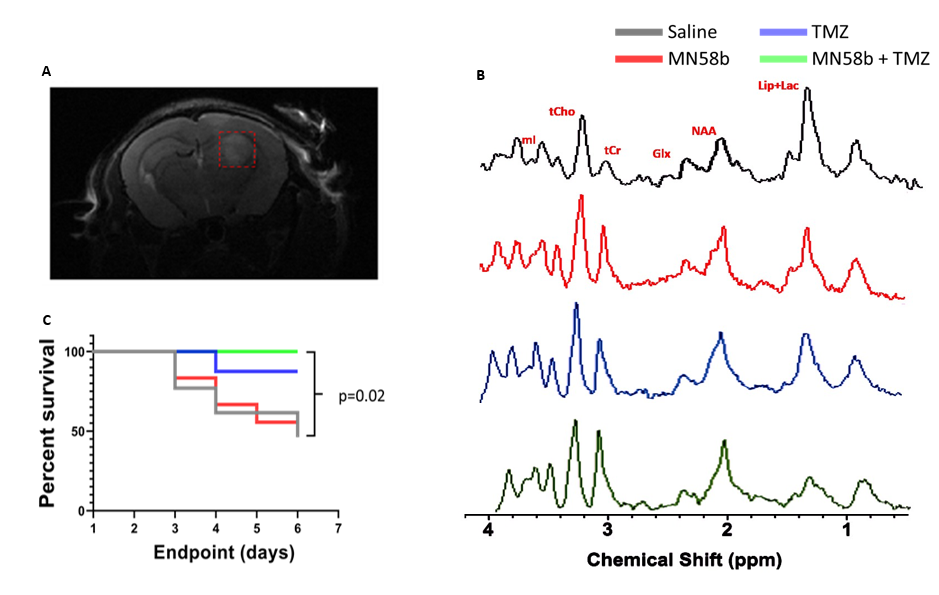
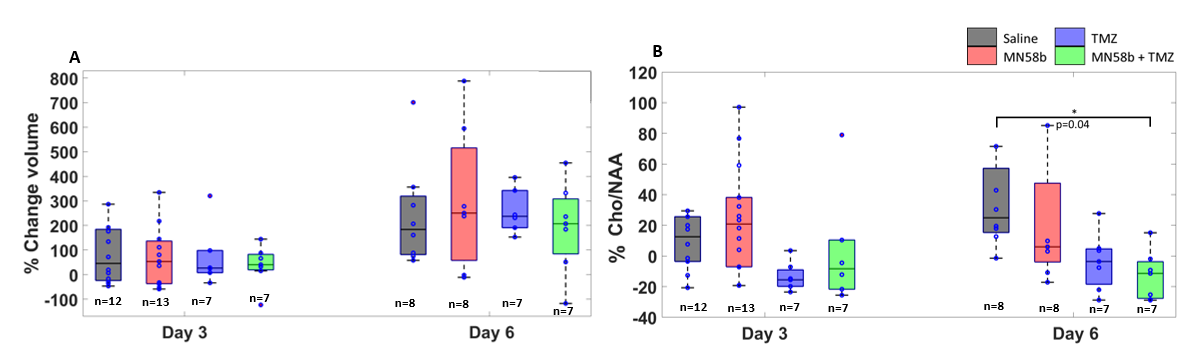
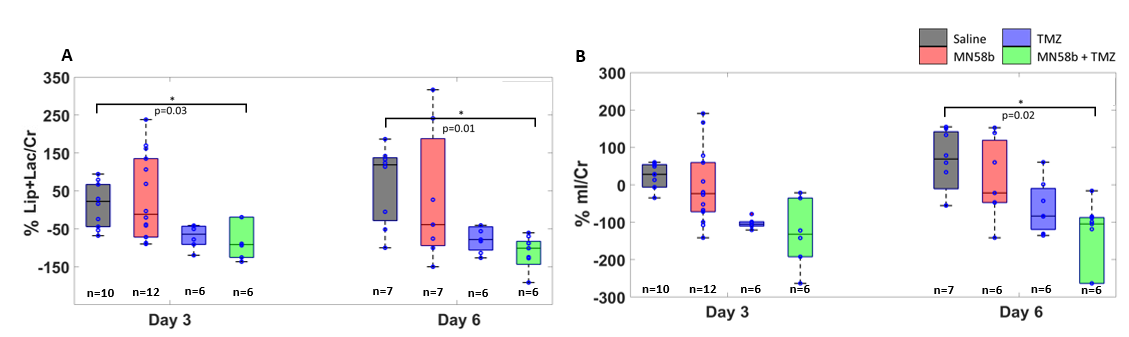
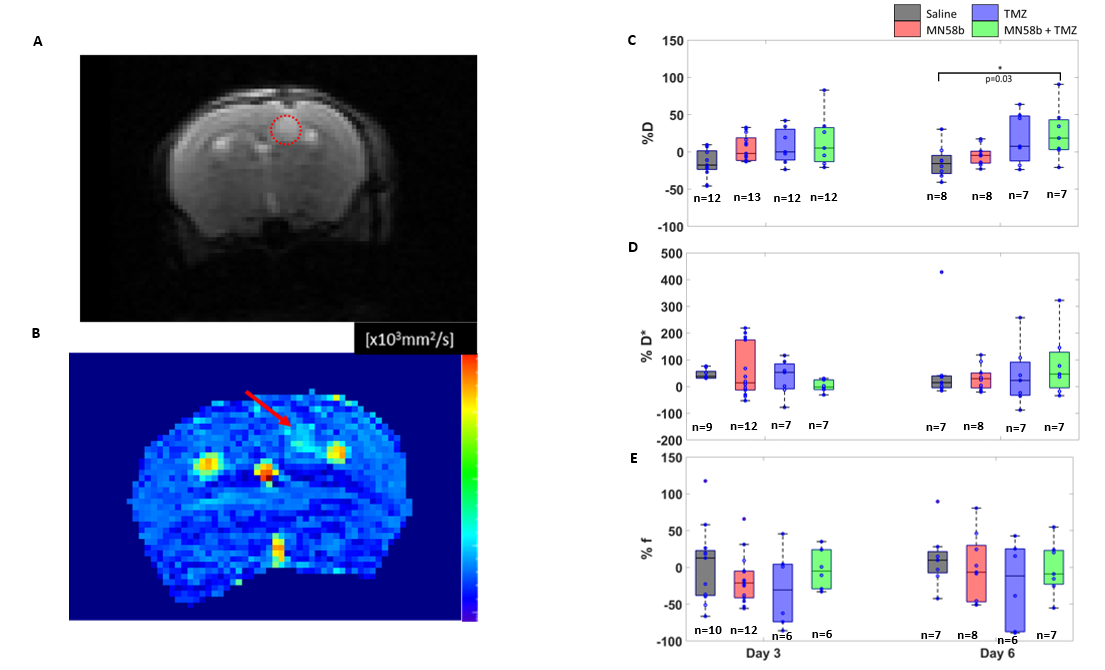
Figure 1.A shows a representative T2-weighted image of a mouse bearing the GL261 tumour with the MRS voxel displayed as an inset. Representative in vivo MR spectra from the tumour region of mice treated with saline, MN58b, TMZ and combination treatment, respectively are shown in Fig. 1B. No significant change in tumour volume (Fig. 2A) between any group was observed across all time points. Nevertheless, a significant difference in overall survival rate was noted between combination treatment and control cohorts (p= 0.02, Fig. 1C). On day-6, a significant reduction in the percentage change in tCho/NAA ratio with respect to baseline was observed in combination treatment group compared to control tumour-bearing mice (p=0.04, Fig. 2B). A significant reduction was also observed in mI/tCr ratio (p=0.02, Fig. 3B) between combination cohort and saline control group at the end of treatment. Combination treatment group also demonstrated a significant decline in Lip+Lac/tCr on days 3 and 6 (Fig. 3A). No other metabolites such as tCho/tCr or NAA/tCr demonstrated significant changes with treatment. Although trends in reduction of tCho/NAA and mI/tCr in combination treated animals (day 3, Fig. 2A, 3B) were also observed, they were not significant. While MN58b or TMZ alone also demonstrated a decrease in these metabolite ratios, they did not induce significant reduction in comparison to saline controls. Although not significant, Fig. 2 and 3 show that TMZ alone induced larger reductions in metabolite ratios (Cho/NAA, mI/Cr) than MN58b. While the perfusion related parameters (D* and f) remained constant among all groups (Fig. 4. D and E), the diffusion parameter (D) exhibited a significant increase in the combinatorial therapy cohort as opposed to saline treated ones (Fig. 4B, C; p= 0.03).Discussion
We observed synergistic effects of MN58b and TMZ in the treatment of GBM in this study. A significant reduction in tCho/NAA suggests ChoKα inhibition leading to an arrest in cellular proliferation3 by MN58b as well as DNA damage induced apoptosis by TMZ triggered in cancer cells8. A significant reduction in mI/Cr is similar to the earlier report in a rat model of GBM suggesting an inhibition of E2F1 protein expression leading to a reduction in mI synthesis in response to treatment2. Significant reduction of Lip+Lac/tCr in the combined treatment group might indicate an induced antitumor activity that might have led to less tumour proliferation. The increase in diffusion coefficient (D) might be indicative of reduced tumour cell density and increased water molecular motion in response to treatment.Conclusion
1H MRS and IVIM-DWI can noninvasively monitor pathophysiological changes in gliomas in response to multiple therapeutic approaches.Acknowledgements
Ministry of Education, Saudi Arabia, for funding myPhD study.
References
[1] Glunde K, Bhujwalla ZM, Ronen SM. Choline metabolism in malignant transformation. Nat Rev Cancer. 2011;11(12):835-48.
[2] Bhaduri S, Kelly CL, Lesbats C, et al. Metabolic changes in glioblastomas in response to choline kinase inhibition: In vivo MRS in rodent models. NMR Biomed. 2023;36(3):e4855.
[3] Kumar M, Arlauckas SP, Saksena S, et al. Magnetic resonance spectroscopy for detection of choline kinase inhibition in the treatment of brain tumors. Mol Cancer Ther. 2015;14(4):899-908.
[4] Arlauckas SP, Kumar M, Popov AV, et al. Near infrared fluorescent imaging of choline kinase alpha expression and inhibition in breast tumors. Oncotarget. 2017;8(10):16518-16530.
[5] Omuro A, Brandes AA, Carpentier AF, et al. Radiotherapy combined with nivolumab or temozolomide for newly diagnosed glioblastoma with unmethylated MGMT promoter: An international randomized phase III trial. Neuro Oncol. 2023;25(1):123-134.
[6] Delgado-Goñi T, Ortega-Martorell S, Ciezka M, et al. MRSI-based molecular imaging of therapy response to temozolomide in preclinical glioblastoma using source analysis. NMR Biomed. 2016;29(6):732-43.
[7] Li B, Xu D, Zhou J, et al. Monitoring Bevacizumab-Induced Tumor Vascular Normalization by Intravoxel Incoherent Motion Diffusion-Weighted MRI. J Magn Reson Imaging. 2022;56(2):427-439.
[8] Kaina B. Temozolomide in Glioblastoma Therapy: Role of Apoptosis, Senescence and Autophagy. Comment on Strobel et al., Temozolomide and Other Alkylating Agents in Glioblastoma Therapy. Biomedicines 2019, 7, 69. Biomedicines. 2019;7(4):90.
Figures