0547
Detecting IDH1 Mutations in Gliomas: Insights from J-Difference Editing MEGA-PRESS 1H-MRS1Department of Psychiatry, Columbia University, New York, NY, United States, 2Zuckerman Institute, Columbia University, New York, NY, United States, 3Department of Pathology and Cell Biology, Columbia University, New York, NY, United States, 4Department of Neurological Surgery, Columbia University, New York, NY, United States
Synopsis
Keywords: Tumors (Pre-Treatment), Tumor, IDH1 mutation, glioma, MEGA-PRESS, 2-Hydroxyglutarate, glutamate, GABA, glutathione
Motivation: Detecting isocitrate dehydrogenase 1 (IDH1) mutations via in vivo MRI can significantly aids glioma diagnosis and treatment strategies.
Goal(s): To investigates the use of MEGA-PRESS sequences to non-invasively charaterize the metabolic profile of IDH1 mutation glioma.
Approach: We measured 2-hydroxyglutarate (2HG), glutamate+glutamine (GLX), GABA and glutathione (GSH) inside the glioma from an IDH1(R132H)-mutant and an IDH1-wildtype murine models.
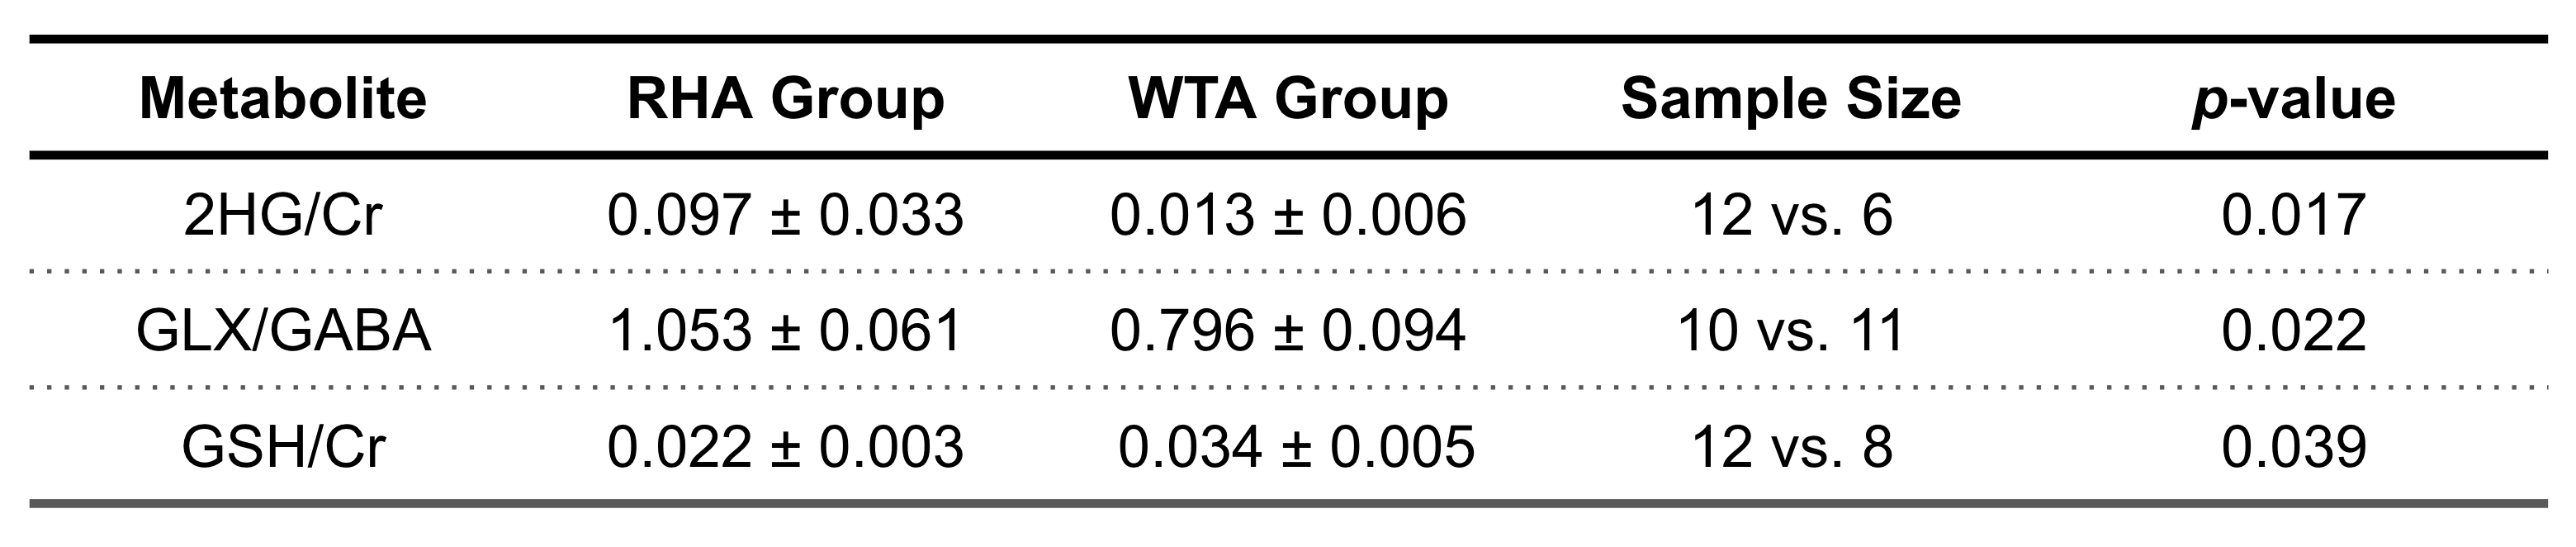
Results: The results unveil distinctive metabolic changes in IDH1 mutation tumors, including elevated 2HG, GLX/GABA ratio, and reduced GSH. These findings offer potential biomarkers for precise diagnosis and therapeutic strategies, highlighting the significant role of MEGA-PRESS in the studies of glioma.
Impact: The study identifies 1H MRS-based biomarkers for non-invasive detection of IDH1 mutation tumors using the MEGA-PRESS sequence. It provides insights into metabolic changes and neurochemical imbalances, aiding early diagnosis, treatment guidance, and monitoring, thus advancing precision oncology.
Introduction
Gliomas represent a challenging group of brain tumors with significant variability in clinical outcomes. Recent advancements in molecular profiling have unveiled the importance of isocitrate dehydrogenase 1 (IDH1) mutations as a key determinant of glioma behavior and prognosis [1]. The presence of an IDH1 mutation profoundly influences the tumor's metabolic and molecular characteristics, necessitating a refined approach to diagnosis and management. The hallmark of the IDH1 mutation is the production of 2HG with subsequent effects that are not fully understood [2-6]. This study investigates the utility of MEGA-PRESS sequence as a diagnostic tool for detecting IDH1 mutation tumors compared to their wild-type counterparts. Our findings reveal distinctive metabolic alterations of 2HG, GLX/GABA, and GSH in IDH1 mutation glioma.Material and Methods
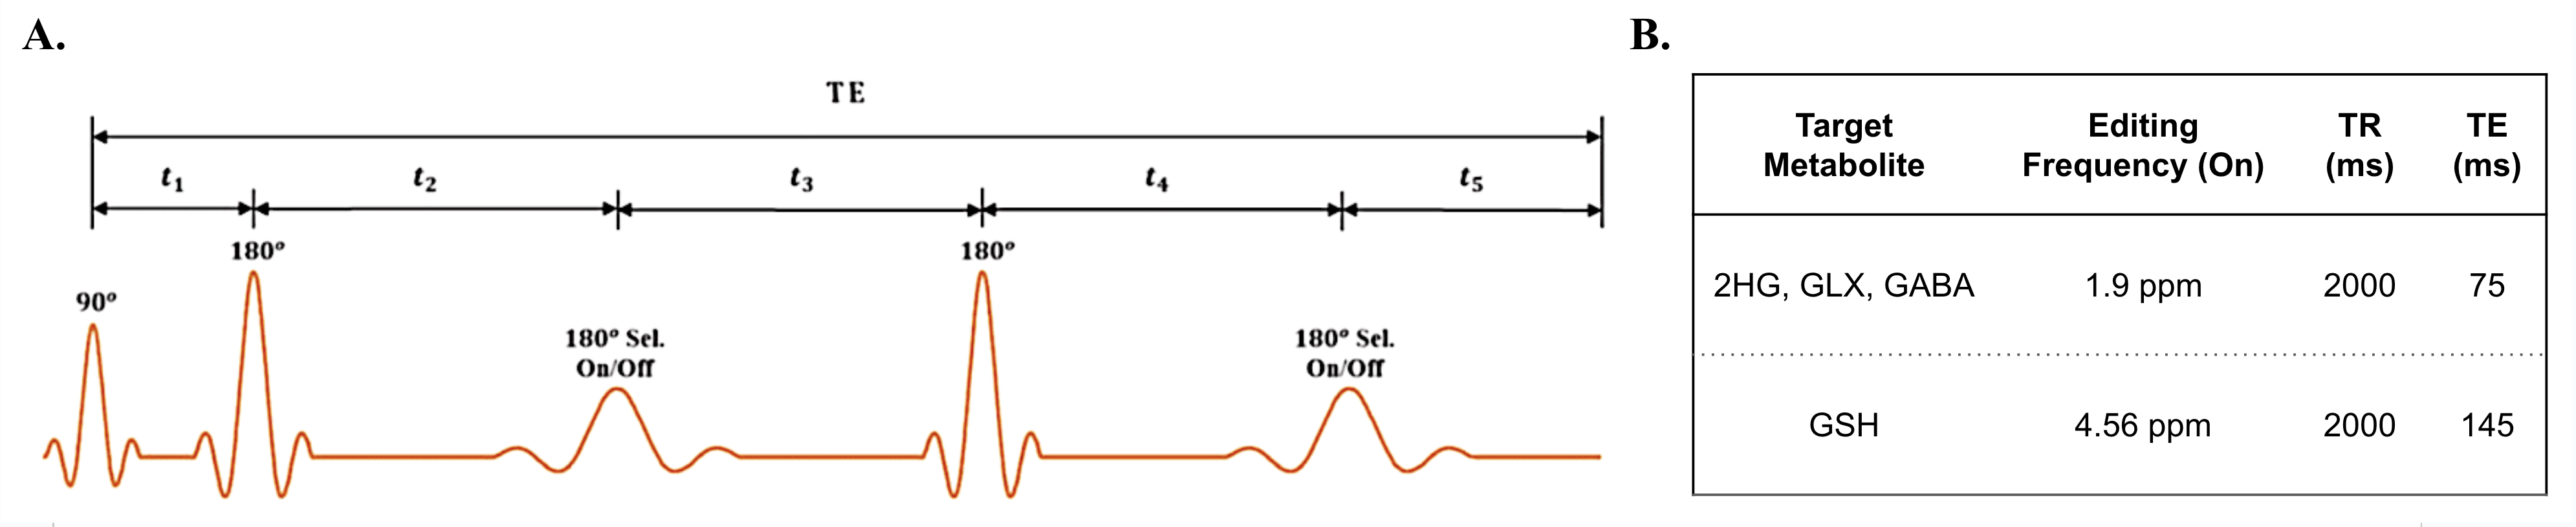
Animals. An IDH1(R132H)-mutant (RHA) and an IDH1-wildtype (WTA) murine glioma cell line, were generated from retrovirus-induced orthotopic murine glioma models. Adult mice (7-8 weeks old) were stereotactically injected with 7×10⁴ cells (in 1μL), into the subcortical white matter at 2mm lateral, 2mm anterior to bregma and 2mm deep into the brain parenchyma aiming for subcortical white matter, using a Hamilton syringe at a flow rate of 0.3μL/min. Mice were monitored daily and assessed for signs of tumor morbidity until end stage.MEGA-PRESS Sequence Setup. A Bruker BioSpec 94/30 MRI scanner with ParaVision 6.0.1 and a cryogenic mouse head multiarray surface coil were used for the experiments. For 2HG editing, the frequency‐selective 180° refocusing pulses were applied at 1.9 ppm during the ‘On’ and 7.6 ppm during the ‘Off’ excitation with TR/TE=2000/75 ms [7]. GLX and GABA were also co-edited during the 2HG editing [8]. For GSH editing, the frequency‐selective 180° refocusing pulses were applied at 4.56 ppm during the ‘On’ and 8 ppm during the ‘Off’ excitation [9] with TR=2000 ms and variable TE between 68 and 160 ms (with optimized TE=145 ms). The sequence setup is depicted in Fig1.
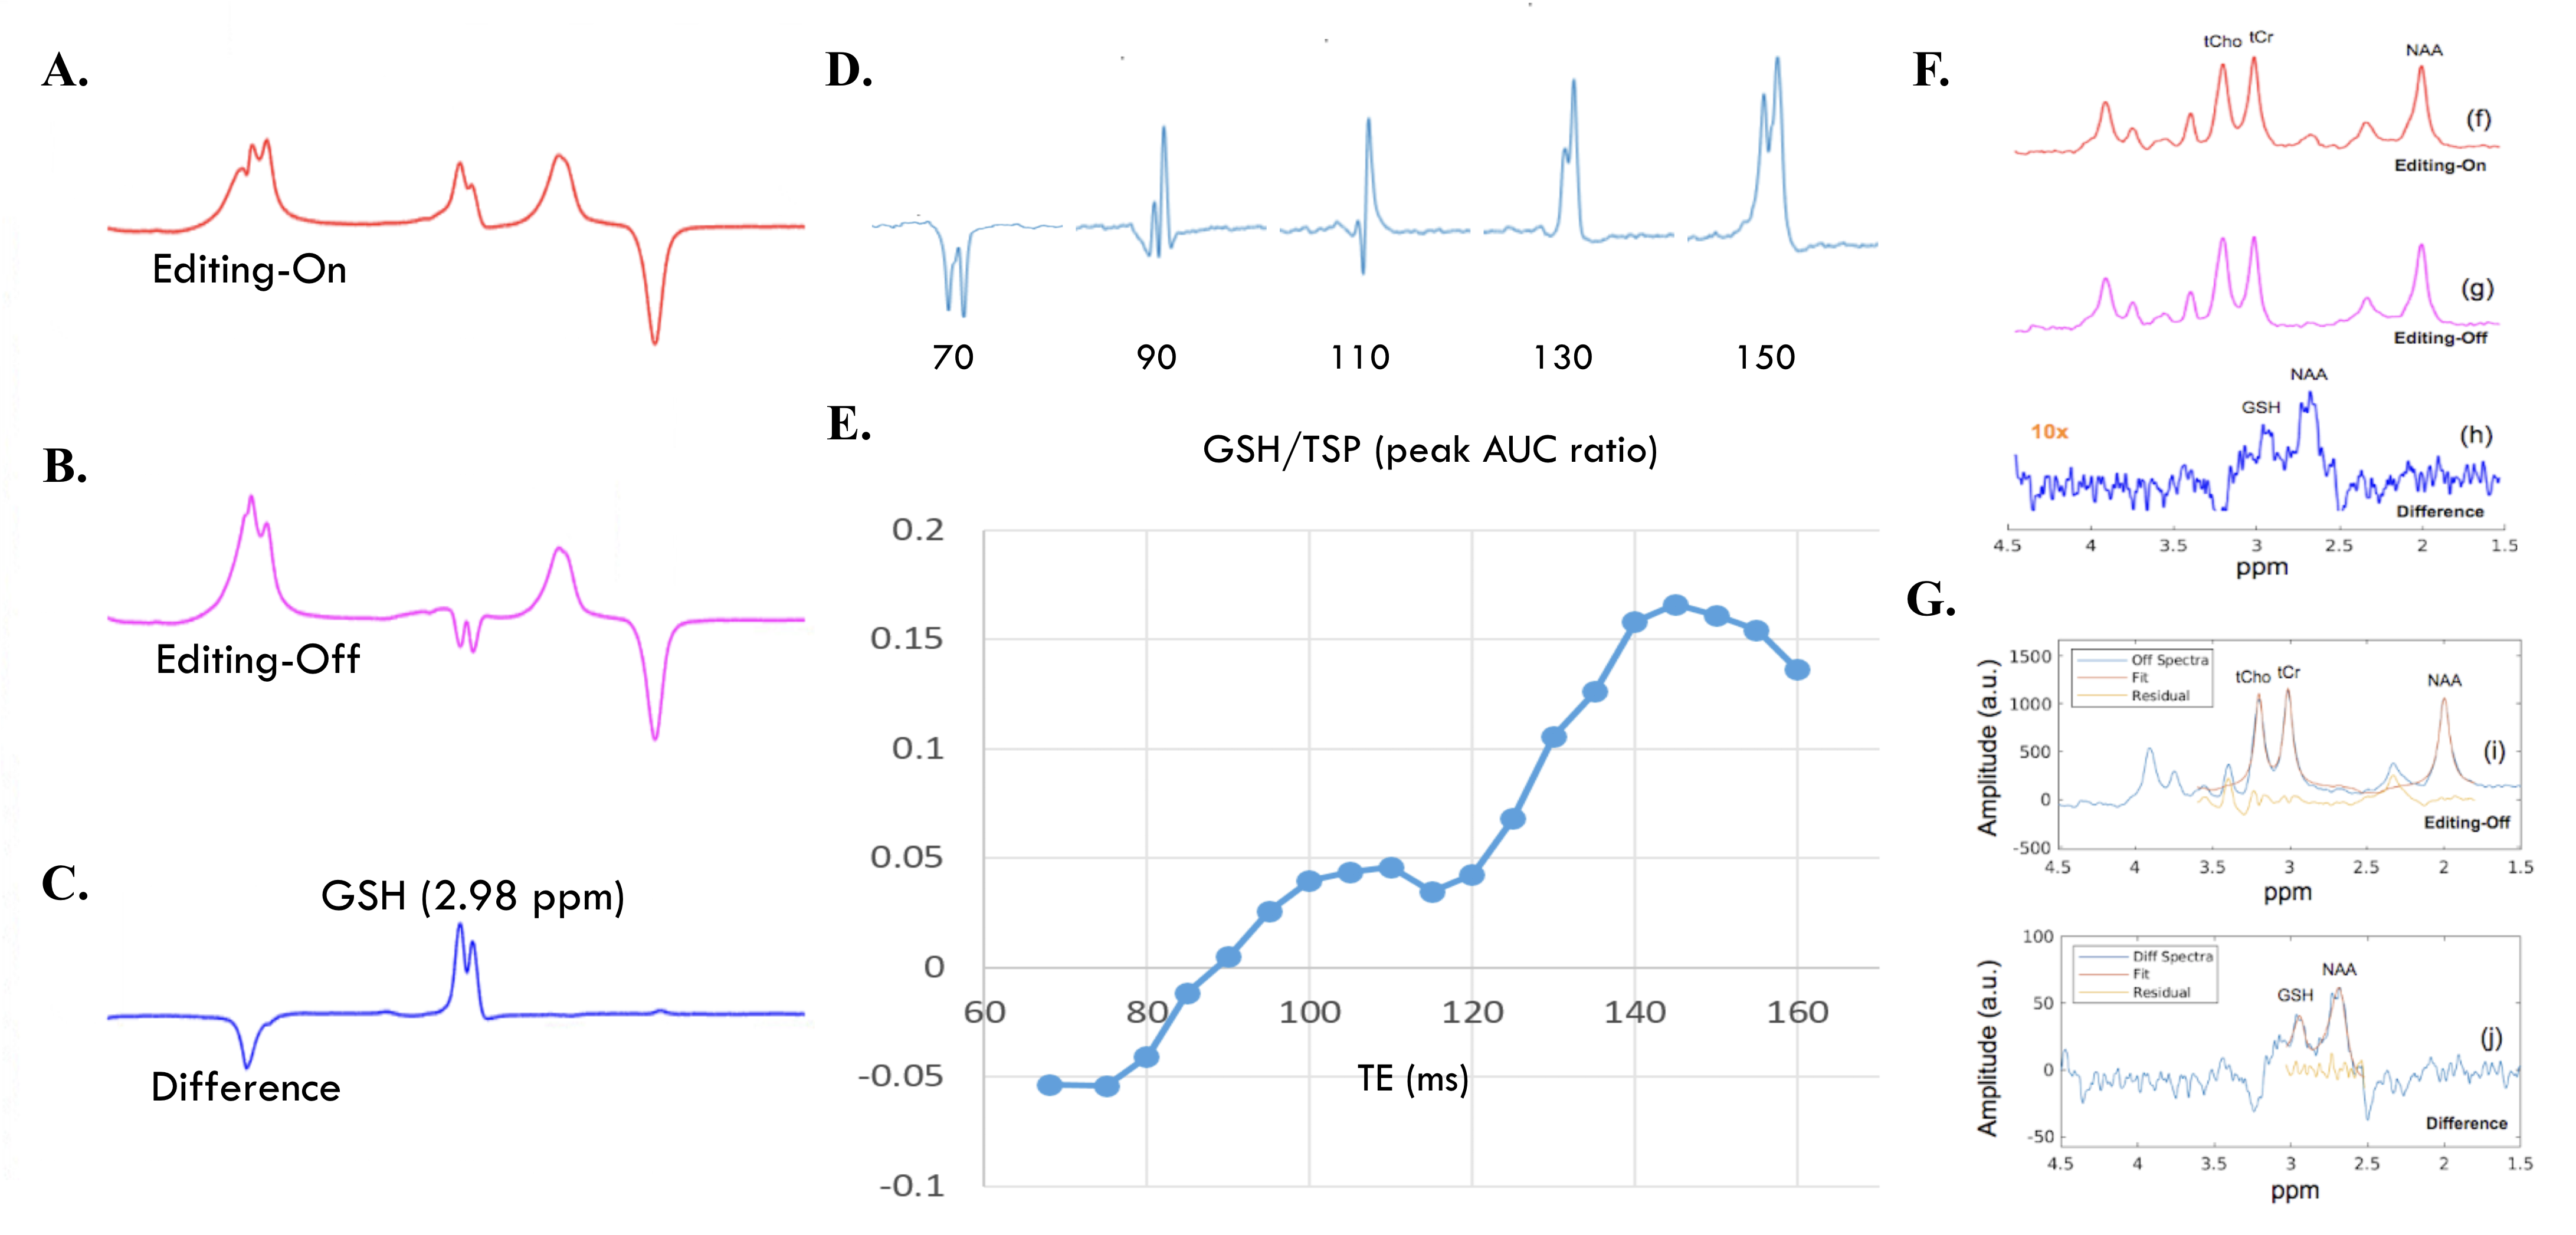
TE Optimization for GSH. The MEGA-PRESS sequence was used to determine the optimal TE that will produce the highest GSH/TSP at 9.4 T. Measurements began from TE=68 ms, and the GSH/TSP level was computed for every 5 ms increments up until 150 ms. This study was conducted with a concentration of GSH of 30 mM and a concentration of TSP of 20mM. The study design is depicted in Fig2.
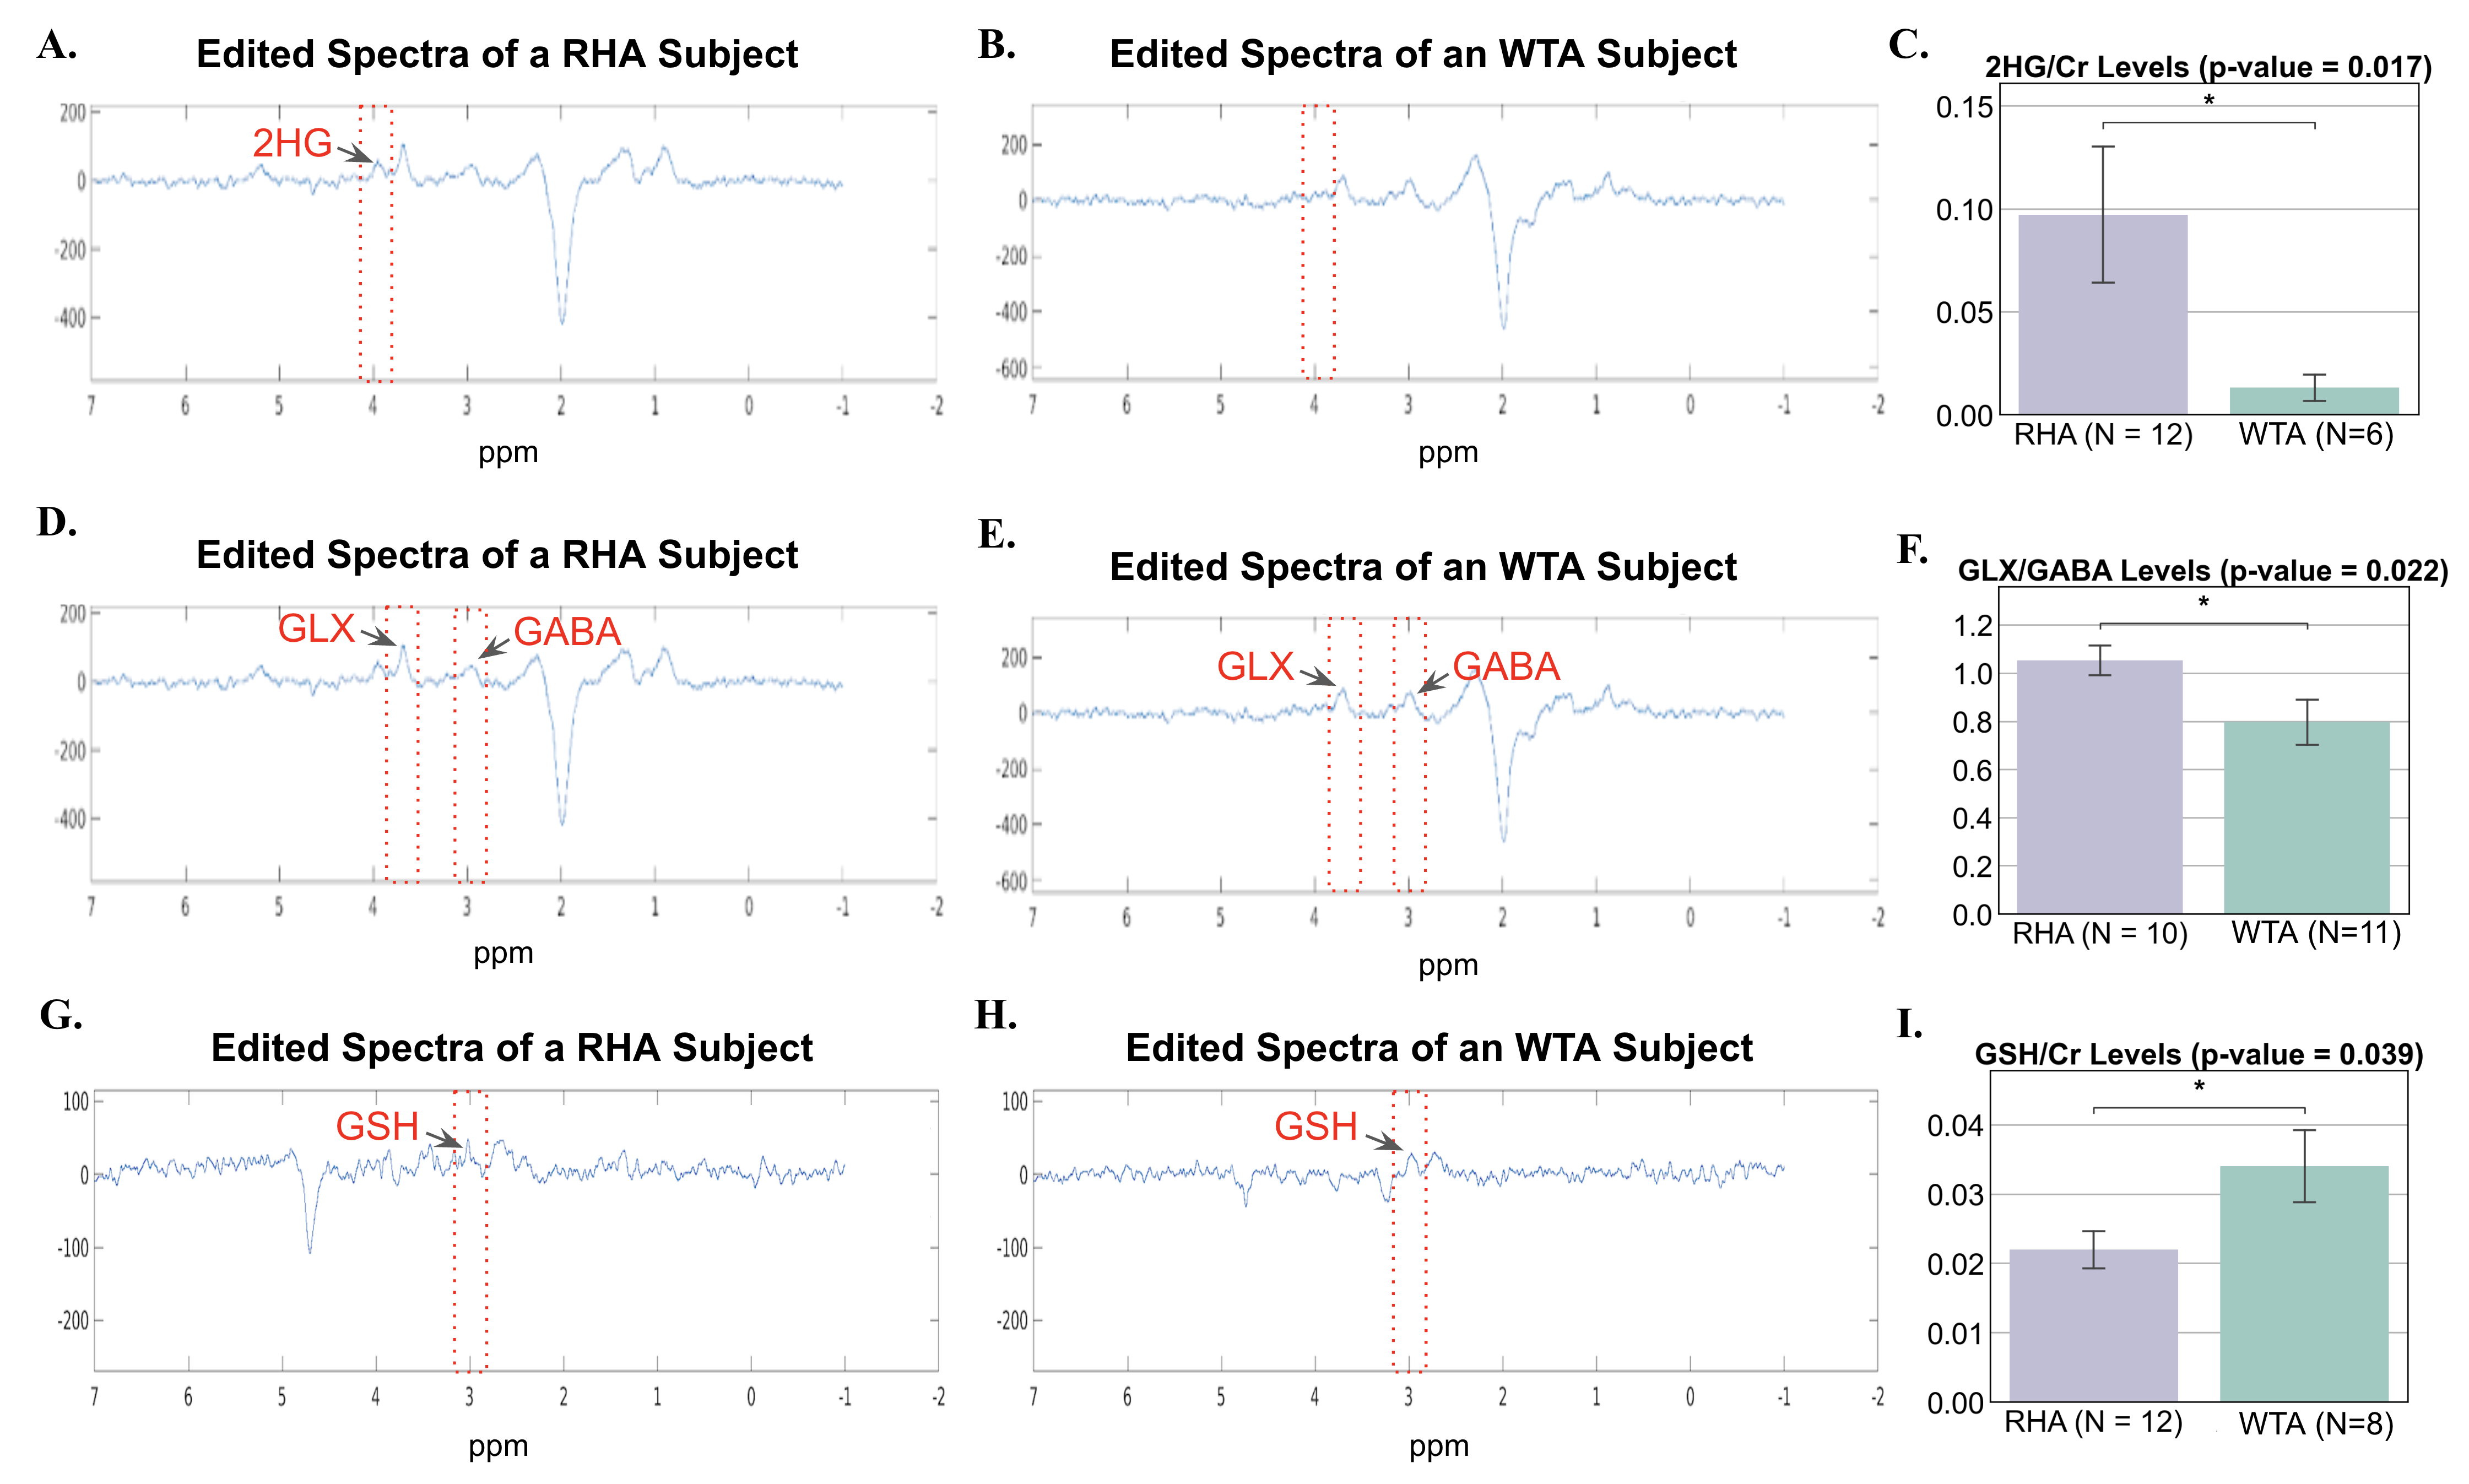
Measuring the Metabolic Profile of IDH1 Mutation Glioma. For 2HG or GSH editing, a single-voxel spectra with voxel size 3x3x3 mm^3 placed inside the glioma was acquired in 34 min. The difference spectra (Fig3) from 2HG editing scan showing the edited 2HG resonance at 4 ppm, the co-edited GLX at 3.75 ppm and the co-edited GABA at 3ppm. The difference spectra (Fig3) from GSH editing scan showing the edited brain GSH resonance at 2.98 ppm.
Data Processing. As for the pre-processing and quantification, we used JET [10]. This algorithm was developed to automatically process (i.e. for frequency alignment, phasing, and subtraction of ON and OFF data) and quantify single-voxel MEGA-PRESS data. For 2HG editing spectra, 2HG, Creatine+Phosphocreatine (Cr), Choline (Cho), N-acetyl aspartate (NAA), GABA, and GLX were quantified and the ratios 2HG/Cr and GLX/GABA were calculated. For GSH editing spectra, GSH, Cr, Cho, NAA were quantified and the ratio GSH/Cr was calculated.
Results
Phantom. Using MEGA-PRESS, editing GSH resonance was accurately determined at 2.98 ppm on the DIFF spectra. The performance of MEGA-PRESS is shown in Fig.2[A-C]. The optimal echo time of GSH in vivo using the MEGA-PRESS sequence was 145 ms. It was found that as TE increases, so does the detection of GSH content over the range of 68 to 150 ms. The edited GSH peaks at different TEs are shown in Fig.2[D] and the GSH/TSP ratios at different TEs are shown in Fig.2[E]. The optimal TE was determined as 145 ms.Mice. Elevated 2HG, a characteristic product of IDH1 mutations, was detected, providing a reliable biomarker for the presence of IDH1 mutation. Furthermore, we observed increased GLX/GABA, indicative of glutamate and GABA imbalance, and reduced GSH levels in IDH1 mutation tumors suggesting altered oxidation−reduction reactions.
Conclusion
These 1H-MRS-based biomarkers not only aid in the non-invasive identification of IDH1 mutation but also offer valuable insights into the underlying mechanisms. This knowledge holds promise for early diagnosis, guiding treatment decisions, and monitoring therapeutic responses in the management of gliomas with IDH1 mutations.Acknowledgements
This study was performed at the Zuckerman Mind Brain Behavior Institute MRI Platform, a shared resource and Columbia MR Research Center site.References
- Louis DN, Perry A, Wesseling P, Brat DJ, Cree IA, Figarella-Branger D, Hawkins C, Ng HK, Pfister SM, Reifenberger G, Soffietti R, von Deimling A, Ellison DW. The 2021 WHO Classification of Tumors of the Central Nervous System: a summary. Neuro Oncol. 2021 Aug 2;23(8):1231-1251. doi: 10.1093/neuonc/noab106. PMID: 34185076; PMCID: PMC8328013.
- Dang L, White DW, Gross S, Bennett BD, Bittinger MA, Driggers EM, Fantin VR, Jang HG, Jin S, Keenan MC, Marks KM, Prins RM, Ward PS, Yen KE, Liau LM, Rabinowitz JD, Cantley LC, Thompson CB, Vander Heiden MG, Su SM. Cancer-associated IDH1 mutations produce 2-hydroxyglutarate. Nature. 2009 Dec 10;462(7274):739-44. doi: 10.1038/nature08617. PMID: 19935646; PMCID: PMC2818760.
- Xu W, Yang H, Liu Y, Yang Y, Wang P, Kim SH, Ito S, Yang C, Wang P, Xiao MT, Liu LX, Jiang WQ, Liu J, Zhang JY, Wang B, Frye S, Zhang Y, Xu YH, Lei QY, Guan KL, Zhao SM, Xiong Y. Oncometabolite 2-hydroxyglutarate is a competitive inhibitor of α-ketoglutarate-dependent dioxygenases. Cancer Cell. 2011 Jan 18;19(1):17-30. doi: 10.1016/j.ccr.2010.12.014. PMID: 21251613; PMCID: PMC3229304.
- Chowdhury R, Yeoh KK, Tian YM, Hillringhaus L, Bagg EA, Rose NR, Leung IK, Li XS, Woon EC, Yang M, McDonough MA, King ON, Clifton IJ, Klose RJ, Claridge TD, Ratcliffe PJ, Schofield CJ, Kawamura A. The oncometabolite 2-hydroxyglutarate inhibits histone lysine demethylases. EMBO Rep. 2011 May;12(5):463-9. doi: 10.1038/embor.2011.43. Epub 2011 Apr 1. PMID: 21460794; PMCID: PMC3090014.
- Fu X, Chin RM, Vergnes L, Hwang H, Deng G, Xing Y, Pai MY, Li S, Ta L, Fazlollahi F, Chen C, Prins RM, Teitell MA, Nathanson DA, Lai A, Faull KF, Jiang M, Clarke SG, Cloughesy TF, Graeber TG, Braas D, Christofk HR, Jung ME, Reue K, Huang J. 2-Hydroxyglutarate Inhibits ATP Synthase and mTOR Signaling. Cell Metab. 2015 Sep 1;22(3):508-15. doi: 10.1016/j.cmet.2015.06.009. Epub 2015 Jul 16. PMID: 26190651; PMCID: PMC4663076.
- Ye D, Guan KL, Xiong Y. Metabolism, Activity, and Targeting of D- and L-2-Hydroxyglutarates. Trends Cancer. 2018 Feb;4(2):151-165. doi: 10.1016/j.trecan.2017.12.005. Epub 2018 Jan 5. PMID: 29458964; PMCID: PMC5884165.
- Guo J, Gang Z, Sun Y, Laine A, Small SA, Rothman DL. In vivo detection and automatic analysis of GABA in the mouse brain with MEGA‐PRESS at 9.4 T. NMR in Biomedicine. 2018 Jan;31(1):e3837.
- Choi IY, Andronesi OC, Barker P, Bogner W, Edden RA, Kaiser LG, Lee P, Marjańska M, Terpstra M, de Graaf RA. Spectral editing in 1H magnetic resonance spectroscopy: Experts' consensus recommendations. NMR in Biomedicine. 2021 May;34(5):e4411.
- Ma DJ, Gjerswold-Selleck S, Sun Y, Mattingly MM, Guo J. In vivo detection of GSH in the mouse brain using MEGA-PRESS at 9.4 T. ISMRM 2021.
- http://doi.org/10.5281/zenodo.3967565.
Figures