0546
Testing the Quantitative Imaging Biomarkers Alliance (QIBA) PDFF Profile in the Liver: Results from 416 Scanners at 1.5T and 3T1Perspectum, Oxford, United Kingdom
Synopsis
Keywords: Quantitative Imaging, Validation, Liver, Phantoms
Motivation: The Quantitative Imaging Biomarkers Alliance (QIBA) PDFF Profile describes the expected performance of an imaging technique when measuring PDFF. However, the expected performance in phantoms was determined in one phantom on 27 scanners and may not be applicable widely.
Goal(s): We tested the hypothesis that the QIBA PDFF bias criteria (mean:within ±5.0%, maximum:within ±7.0% (percentage points)) cannot be attained at scale with multiple phantoms on >400 scanners.
Approach: We calculated the QIBA PDFF criteria using phantom data from 416 scanners across three vendors at 1.5T and 3T.
Results: All six combinations of scanner vendor and field strength passed the QIBA PDFF criteria.
Impact: The hypothesis that the QIBA PDFF bias criteria cannot be maintained with multiple phantoms on >400 scanners was disproven in a novel dataset with 416 scanners, strongly suggesting that it is possible to achieve this level of performance at scale.
Introduction
Quantitative Imaging Biomarkers Alliance (QIBA) Profiles outline how to produce an imaging biomarker with an effective level of performance. Specifically, the QIBA Proton Density Fat Fraction (PDFF) Profile pertains to MRI measurements of PDFF for the assessment of liver fat, to be used as a quantitative imaging biomarker for fatty liver disease. The performance stipulated by the Profile includes a mean bias within ±5.0% (percentage points) and a maximum bias within ±7.0% (percentage points) in phantoms. This expected performance was determined in a single phantom on 27 scanners from three vendors, for a total of 160 independent scans1,2. Herein, we test the hypothesis that the performance cannot be achieved at scale on multiple phantoms on >400 scanners from three vendors at both 1.5T and 3T. This would be useful for assessing if MRI techniques for measuring PDFF can be deployed at scale with the expected performance stipulated in the QIBA Profile, for instance for clinical trials for the quantification of fatty liver disease.Methods
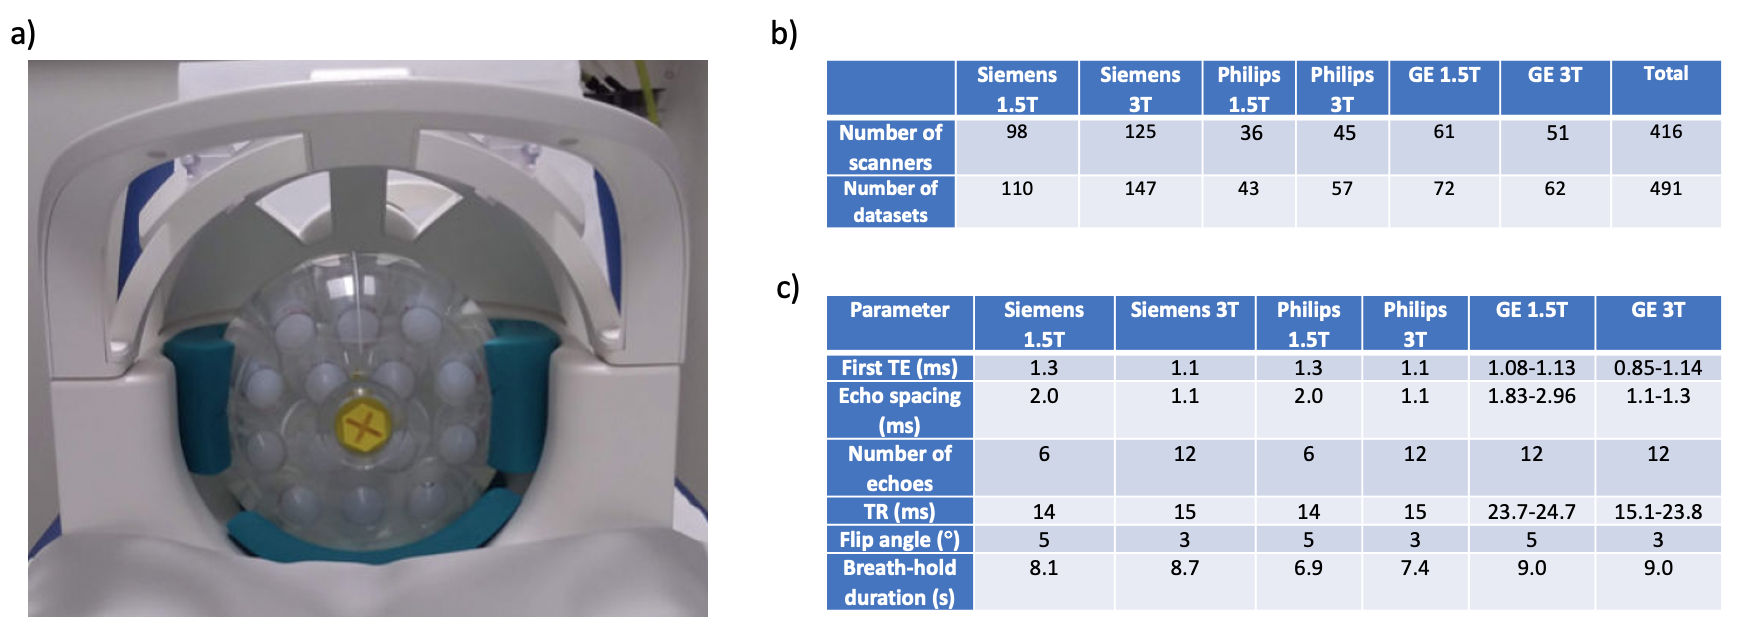
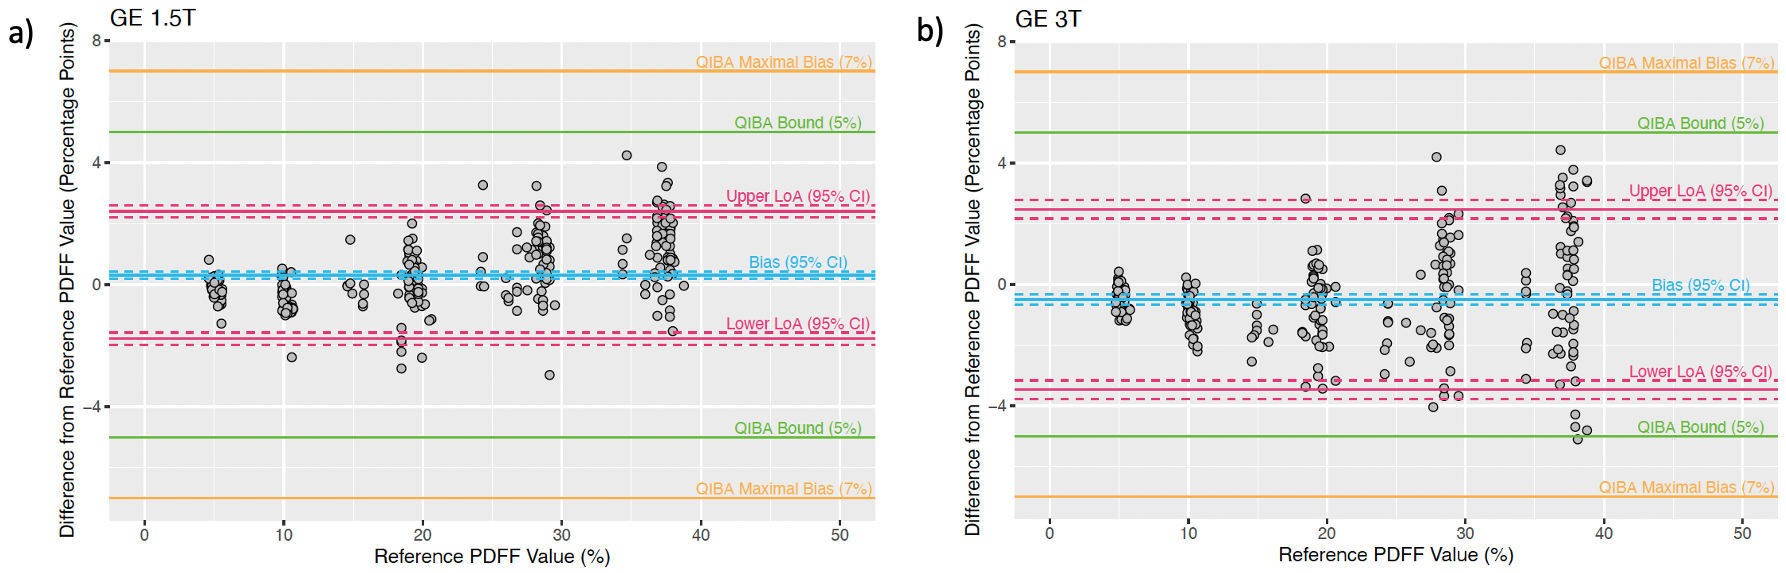
36 commercial phantoms were used, containing vials doped with peanut oil and agar gel with PDFF ranging from 0% - 40%. An example phantom set-up is illustrated in Figure 1a. 491 phantom datasets were taken on 416 scanners, differentiated by unique scanner serial number. Scanners included 1.5T and 3T on Siemens, Philips and GE systems, with highly standardized 2D multi-echo spoiled gradient echo sequences (LiverMultiScan, Perspectum, UK). No special sequence software or research modes were employed. Figure 1b illustrates the breakdown of the number of scanners and datasets per vendor and field strength. Key sequence parameters are summarized in Figure 1c. MAGO (MAGnitude-Only) reconstruction3 was performed to generate PDFF maps. The median PDFF was determined within an ROI (diameter = 15 mm) in each vial, and the median PDFF was averaged over three scans to obtain the final PDFF for one dataset. The QIBA PDFF Profile stipulates that the following requirements be met in phantoms: (1) the 95% confidence intervals (CI) for the measured PDFF shall not exceed ±5.0% from the true PDFF; (2) the CI for the mean bias shall be within ±5.0%; and (3) the worst-case bias for any measurement should be within ±7.0% from the true PDFF 2. In this experiment, the “true PDFF” or reference PDFF values for both 1.5T and 3T were taken from MRI measurements on Siemens 1.5T scanners, with parameters specified in Figure 1c. The reference PDFF values were validated with destructive testing and vial measurements from the phantom manufacturer when available. Bland-Altman plots were generated for the six vendor and field strength combinations. The 95% CI were calculated from the Student’s t-distribution with alpha=0.025 and N-1 degrees of freedom.Results and Discussion
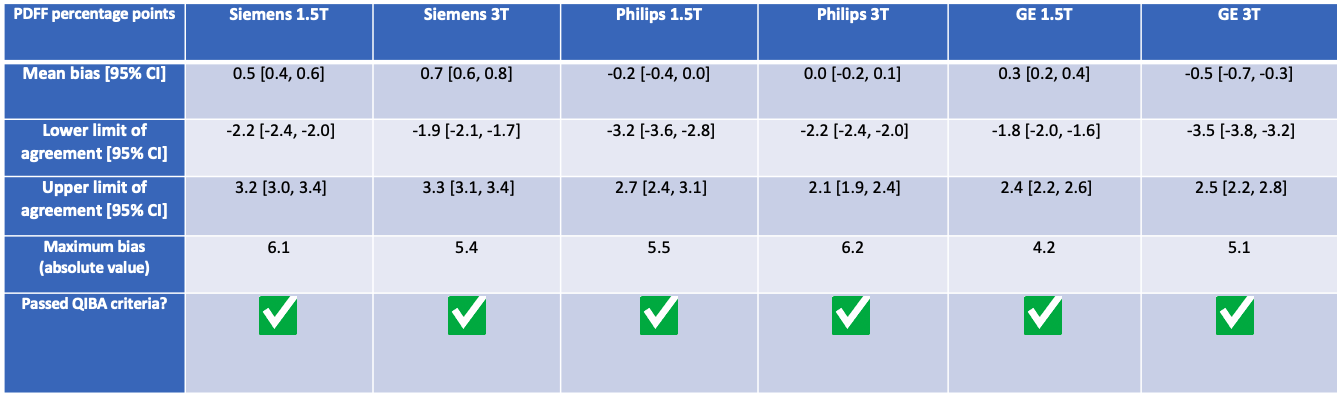
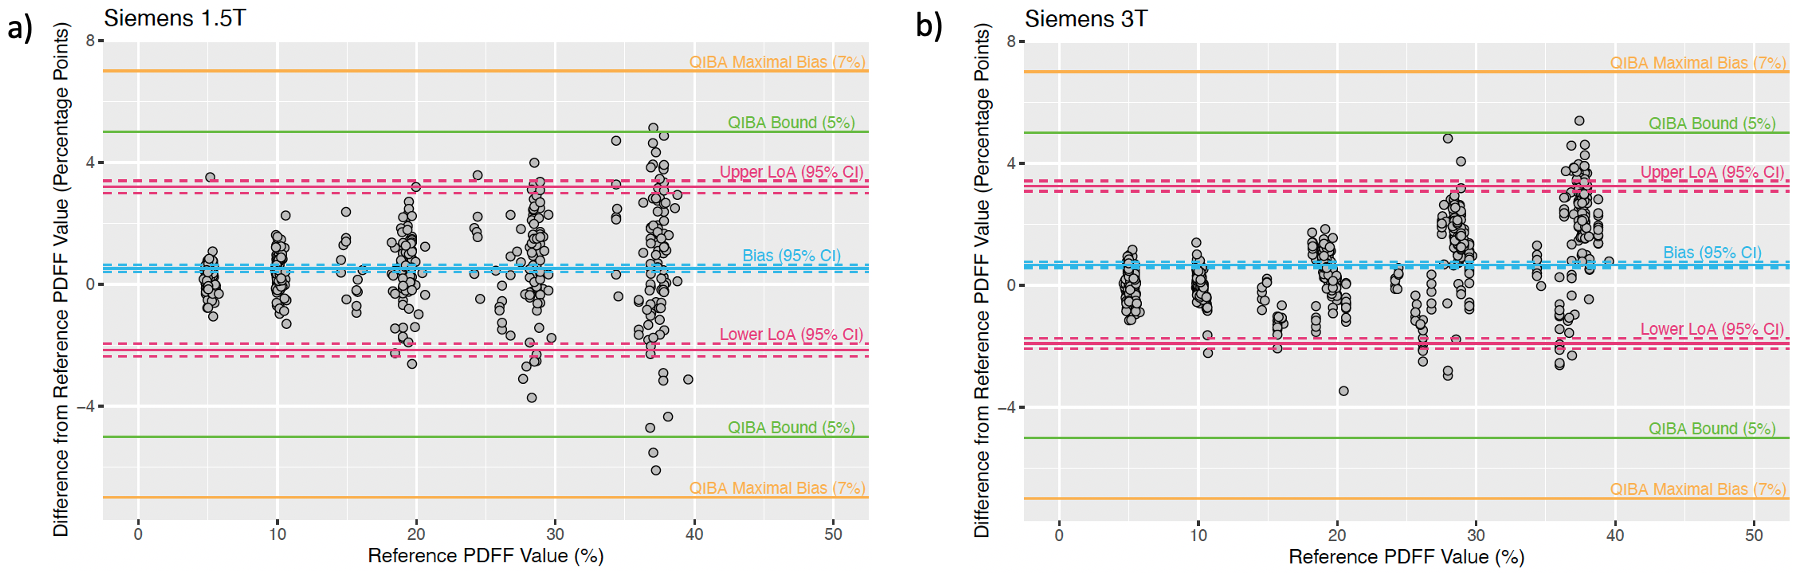
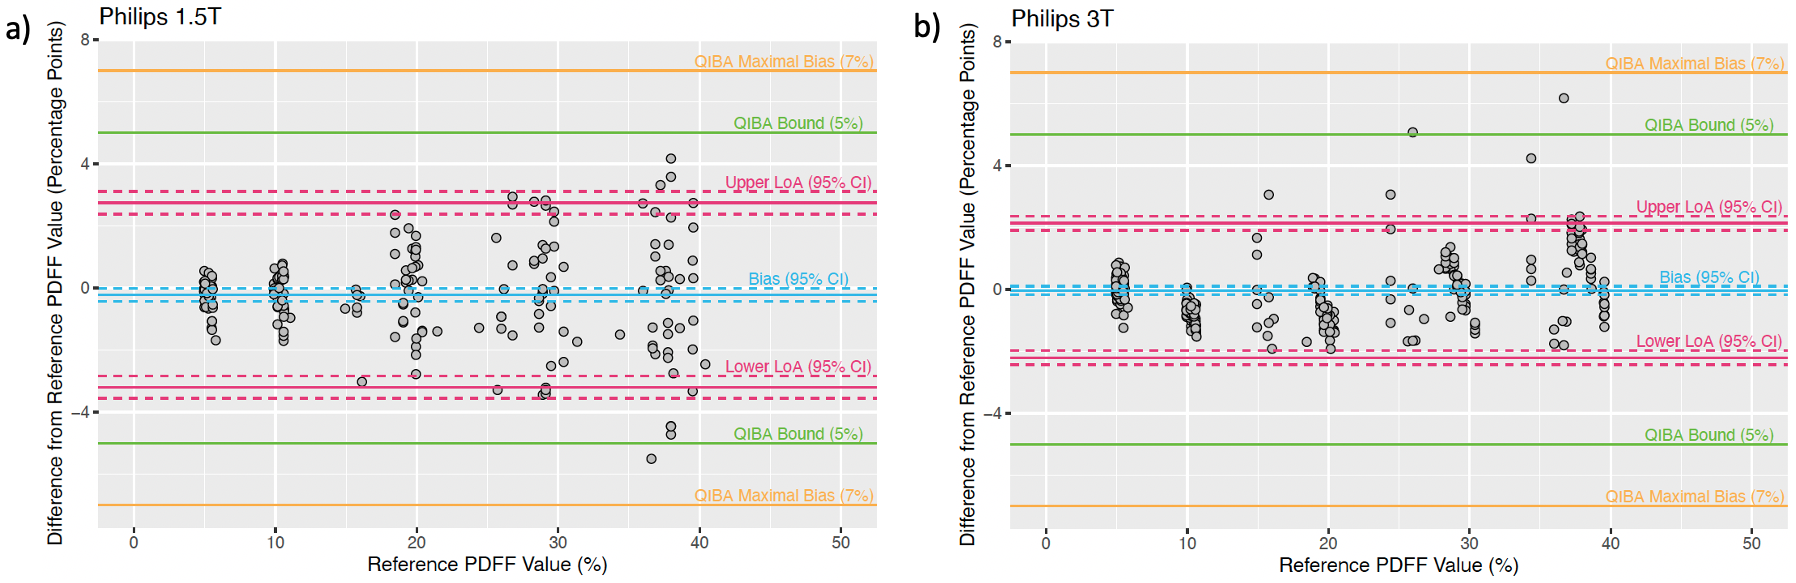
Data from all six vendor and field strength combinations pass the QIBA PDFF criteria, with statistics shown in Figure 2 and Bland-Altman plots shown in Figures 3 – 5. This disproves the hypothesis that the QIBA PDFF performance cannot be achieved at scale with multiple phantoms on >400 scanners. Use of an acquisition and processing pipeline that is independent of scanner vendor may have contributed to the standardized performance of the scanner models. The dominant error in PDFF is caused by temperature fluctuations in phantoms. The temperature of the phantom varies with the surrounding temperature, causing the water peak to shift relative to the fat peaks and affecting PDFF quantification4–6.Conclusion
Phantom data from 416 scanners including Siemens 1.5T, Siemens 3T, Philips 1.5T, Philips 3T, GE 1.5T and GE 3T pass the QIBA PDFF criteria, disproving the hypothesis that the QIBA PDFF performance cannot be achieved at scale with multiple phantoms on >400 scanners.Acknowledgements
No acknowledgement found.References
1. Hu HH, Yokoo T, Bashir MR, et al. Linearity and bias of proton density fat fraction as a quantitative imaging biomarker: A multicenter, multiplatform, multivendor phantom study. Radiology. 2021;298(3):640-651. doi:10.1148/radiol.2021202912
2. Hernando D, Hu HH, Reeder S, Yokoo T. MRI-Based Proton Density Fat Fraction (PDFF) of the Liver. QIBA Proton Density Fat Fraction Biomarker Committee, 2023. Quantitative Imaging Biomarkers Alliance, September 2023. https://qibawiki.rsna.org/index.php/Profiles. Accessed November 3, 2023.
3. Triay Bagur A, Hutton C, Irving B, Gyngell ML, Robson MD, Brady M. Magnitude-intrinsic water–fat ambiguity can be resolved with multipeak fat modeling and a multipoint search method. Magn Reson Med. 2019;82(1):460-475. doi:10.1002/mrm.27728
4. Rieke V, Pauly KB. MR thermometry. Journal of Magnetic Resonance Imaging. 2008;27(2):376-390. doi:10.1002/jmri.21265
5. Rieke V, Pauly KB. Echo combination to reduce Proton Resonance Frequency (PRF) thermometry errors from fat. Journal of Magnetic Resonance Imaging. 2008;27(3):673-677. doi:10.1002/jmri.21238
6. Hernando D, Sharma SD, Kramer H, Reeder SB. On the confounding effect of temperature on chemical shift-encoded fat quantification. Magn Reson Med. 2014;72(2):464-470. doi:10.1002/mrm.24951
Figures