0543
Integrated Registration and Harmonization Framework for Quantitative T2-weighted MRI Analysis following Prostate Cancer Radiotherapy1University of Miami, Miami, FL, United States
Synopsis
Keywords: Data Processing, Quantitative Imaging, Prostate Cancer
Motivation: The reliable evaluation of T2-weighted MRI (T2w) signal change in prostate cancer following radiotherapy (RT) is challenging due to deformations (physiological and RT-related) and scanner/protocol acquisition variability.
Goal(s): To develop an automated and reproducible methodology for quantification of T2w signal change in longitudinal studies following RT.
Approach: The methodology includes T2w image intensity harmonization and deformable registration of post-RT to pre-RT images for automated detection of prostate, peripheral zone and tumor volume.
Results: The repeatability in T2w intensity estimation improved following the automatic registration relative to manual contours; and the quantitative changes of T2w reached significance when pre- and post-RT series were compared.
Impact: The developed methodology allows to automatically detect ROIs in post-RT MRI exams, reduces data acquisition-related variation and improves imaging features’ repeatability, thereby enables the quantitative characterization of RT-induced changes in T2w.
Purpose
Reliable localization and quantification of MRI intensity changes after radiation treatment (RT) of the prostate is challenging due to global and local deformations caused by physiological organ movements and prostate volume changes following RT. Manual contouring of regions of interest (ROIs), such as prostate, peripheral zone (PZ), and gross tumor volumes (GTVs) in longitudinal imaging is a time-consuming and error-prone process, particularly in the post-RT series due to the diminished contrast between tumor and normal appearing prostate tissue and overall changes in the prostate gland. In addition, unlike the functional sequences of multiparametric MRI (Diffusion Weighted Imaging and the Dynamic Contrast Enhanced MRI), the T2-weighted MRI (T2w) signal is measured in arbitrary units that vary substantially between scanners and acquisition. The aim of this work was to develop a comprehensive methodology for automated and reproducible quantification of T2w signal change in longitudinal studies, and thereby to set the framework for conducting radiomics and Δradiomics studies on a large scale.Methods
We developed a REgistration and HARMonization framework, called REHARM, which performs (i) deformable image registration of post-RT to pre-RT T2w images for automatically mapping of ROIs from baseline to follow-up images; and (ii) T2w signal-intensity harmonization based on reference tissues.The spatial transformation is estimated by first applying linear registration of the T2w images to account for global translation and rotation differences, and then a multi-resolution deformable registration algorithm, Demons1, which also allows invertibility of the deformation (from time-backward to time-forward). To refine registration in the RT-targeted region, a second algorithm, SimpleElastix2, is utilized between the images in the region within and around the prostate, while enforcing increased smoothness constraints.
The T2w image harmonization method is an extension of previous work3 and is performed to adjust for difference in acquisition parameters and scanners. Briefly, intensity normalization is carried out by first segmenting (using deep learning) three structures (gluteus maximus muscle, femur, bladder) that are not affected by radiation, and then estimating the transformation (using splines) that maps the average intensities within these structures into pre-defined reference values. The estimated function is finally utilized to transform the intensities of the whole T2w image. In REHARM, the segmentation of the reference structures is refined by 3D shape post-processing (imputation of missing parts and 3D smoothing), and the intensity transformation is improved by introducing smoothness and monotonicity constraints on the spline curve.
The methodology was applied on longitudinal imaging datasets from 23 patients of the Lattice Extreme Ablative Dose (LEAD) clinical trial4 obtained at two pre-RT and three post-RT timepoints (107 exams in total). Using the two pre-RT series, the T2w longitudinal consistency was evaluated by the repeatability coefficient (RC), RC=√2 · 1.96 · sw, where sw is the within-subject standard deviation, and the Pearson correlation coefficient (r).
Results
Figure 1 illustrates a registration example using only linear alignment (1st row) and combined linear and deformable mapping (2nd row). The DICE coefficient (DSC) between manual and automatically estimated prostate contours on the planning MRI (median DSC ± stdev = 0.84±0.06) is approaching the level of interobserver variability (median DSC of 0.87)5. The DSC slightly dropped with time (-0.0041/month) but this could also indicate manual annotation errors. REHARM’s harmonization approach achieved higher histogram overlap than the histogram equalization technique for all examined ROIs (Figure 2). Assessment of T2w values longitudinally showed that the intensity normalization method, applied on coregistered images, improves repeatability versus manual delineation of ROIs (Table 1). Intra-patient paired t-tests (Table 2) showed that after normalization the difference between pre-RT and post-RT distributions increased, indicating the ability of REHARM to deliver quantitative features related to radiation-induced changes.Discussion
REHARM’s image registration component enabled the automatic propagation of baseline ROIs to all timepoints. This is particularly challenging in the post-RT setting, where the prostate appears diffuse and hypo-isointense in T2w images due to glandular atrophy and fibrosis6, 7 and prostate gland and seminal vesicles decrease in size after radiation8. Moreover, after intensity harmonization, a sharp decrease in the T2w intensity post-RT was observed for prostate and mainly for PZ, which is consistent with the reduction of the glandular tissue following RT9.Conclusion
The developed methodology allows to automate longitudinal analysis reducing data acquisition-related variation and improving consistency. The quantitative characterization of RT-induced changes in T2w will improve our understanding of radiation effects facilitating the development of early prediction models for RT response.Acknowledgements
The research was supported by the National Cancer Institute of the National Institutes of Health under Award Numbers P30CA240139, RO1CA189295, R01CA190105, and U01CA239141.References
1. Vercauteren T, Pennec X, Perchant A, Ayache N. Diffeomorphic demons: Efficient non-parametric image registration. NeuroImage. 2009 Mar 1;45(1):S61-72.
2. Klein S, Staring M, Murphy K, Viergever MA, Pluim JP. Elastix: a toolbox for intensity-based medical image registration. IEEE transactions on medical imaging. 2009 Nov 17;29(1):196-205.
3. Algohary A, Zacharaki EI, Breto AL, Alhusseini M, Wallaengen V, Xu IR, Gaston SM, Punnen S, Castillo P, Pattany PM, Kryvenko ON, Spieler B, Abramowitz MC, Dal Pra A, Ford JC, Pollack A, Stoyanova R. Uncovering Prostate Cancer Aggressiveness Signal in T2-weighted MRI through Three Reference Tissues Normalization Technique, NMR in Biomedicine, in press.
4. Pollack A, Chinea FM, Bossart E, Kwon D, Abramowitz MC, Lynne C, Jorda M, Marples B, Patel VN, Wu X, Reis I, Studenski MT, Casillas J, Stoyanova R. Phase I Trial of MRI-Guided Prostate Cancer Lattice Extreme Ablative Dose (LEAD) Boost Radiation Therapy. Int J Radiat Oncol Biol Phys. 2020;107(2):305-15.
5. Klein S, Van Der Heide UA, Lips IM, Van Vulpen M, Staring M, Pluim JP. Automatic segmentation of the prostate in 3D MR images by atlas matching using localized mutual information. Medical physics. 2008 Apr;35(4):1407-17.
6. Mertan FV, Greer MD, Borofsky S et al. Multiparametric magnetic resonance imaging of recurrent prostate cancer. Top Magn Reson Imaging 2016; 25: 139–47.
7. Potretzke TA, Froemming AT, Gupta RT. Post-treatment prostate MRI. Abdomin Radiol 2020; 45: 2184–97.
8. Coakley FV, Teh HS, Qayyum A, Swanson MG, Lu Y, Roach M 3rd, et al. Endorectal MR imaging and MR spectroscopic imaging for locally recurrent prostate cancer after external beam radiation therapy: preliminary experience. Radiology. 2004; 233(2):441–8.
9. Bostwick DG, Egbert BM, Fajardo LF. Radiation injury of the normal and neoplastic prostate. Am J Surg Pathol. 1982;6(6):541-51.
Figures
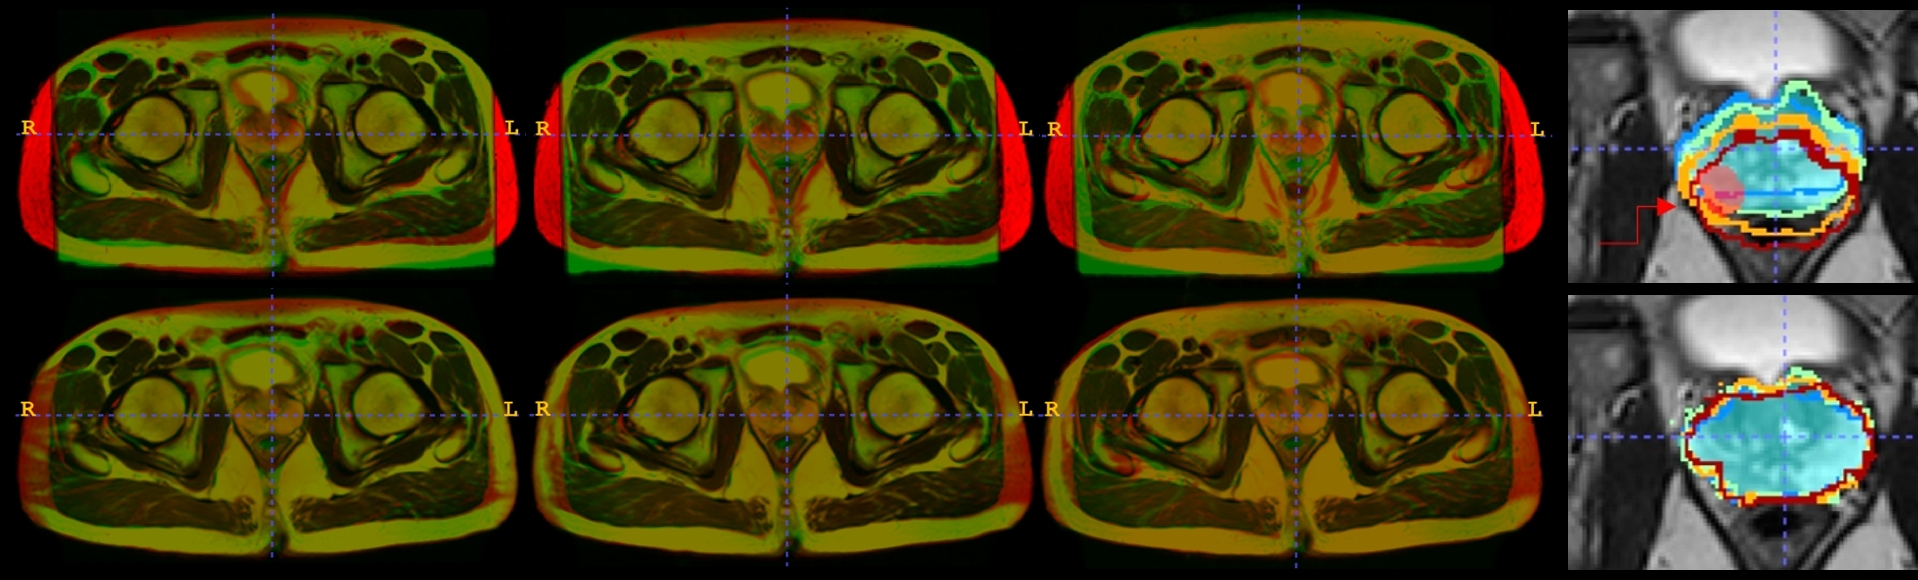
Figure 1. Registration of longitudinal T2w images to baseline using only linear alignment (top row) or combined linear and deformable registration (bottom row). From left to right: Overlay of the baseline exam (shown in red color scale) with the T2w images at 3 mo, 9 mo, and 24 mo post-radiation (RT), respectively (shown in green color scale). Last column: The prostate (cyan volume) and gross tumor volume (red volume and red arrow) as outlined in baseline T2w are superimposed with prostate contours from planning MRI (blue), 3 mo (green), 9 mo (orange) and 24 mo (red) post-RT.
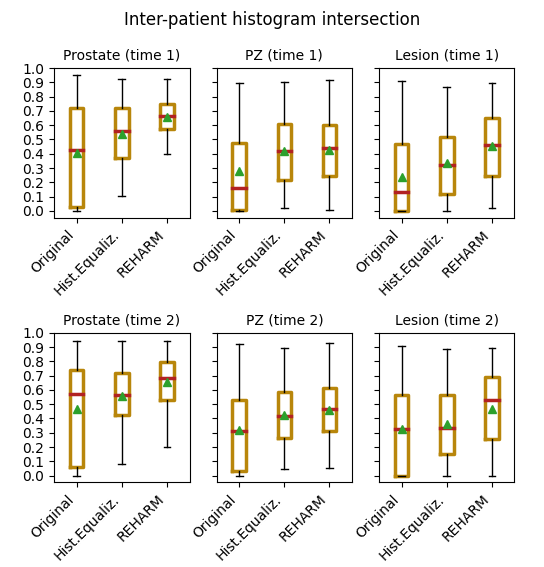
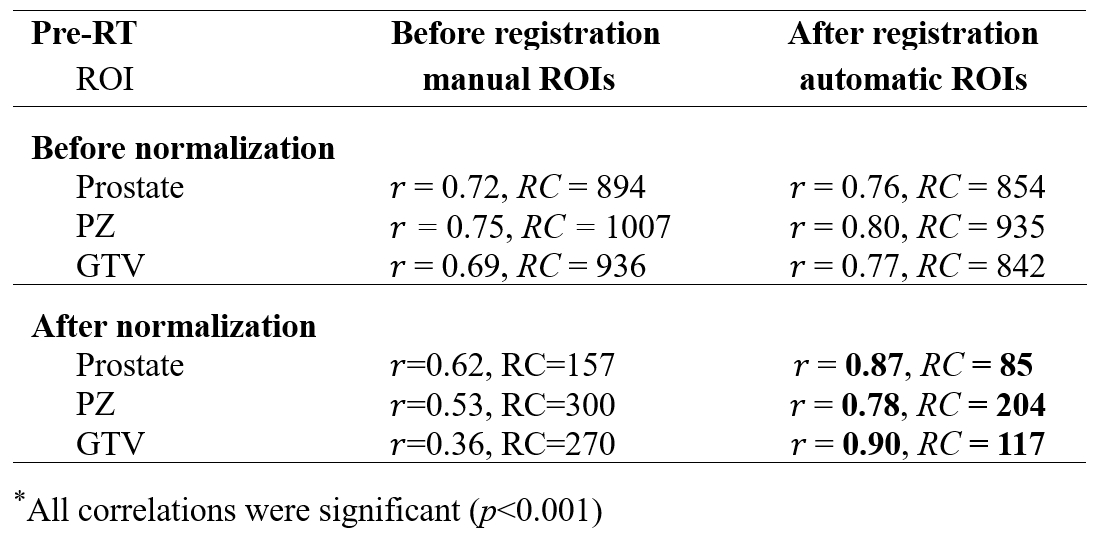
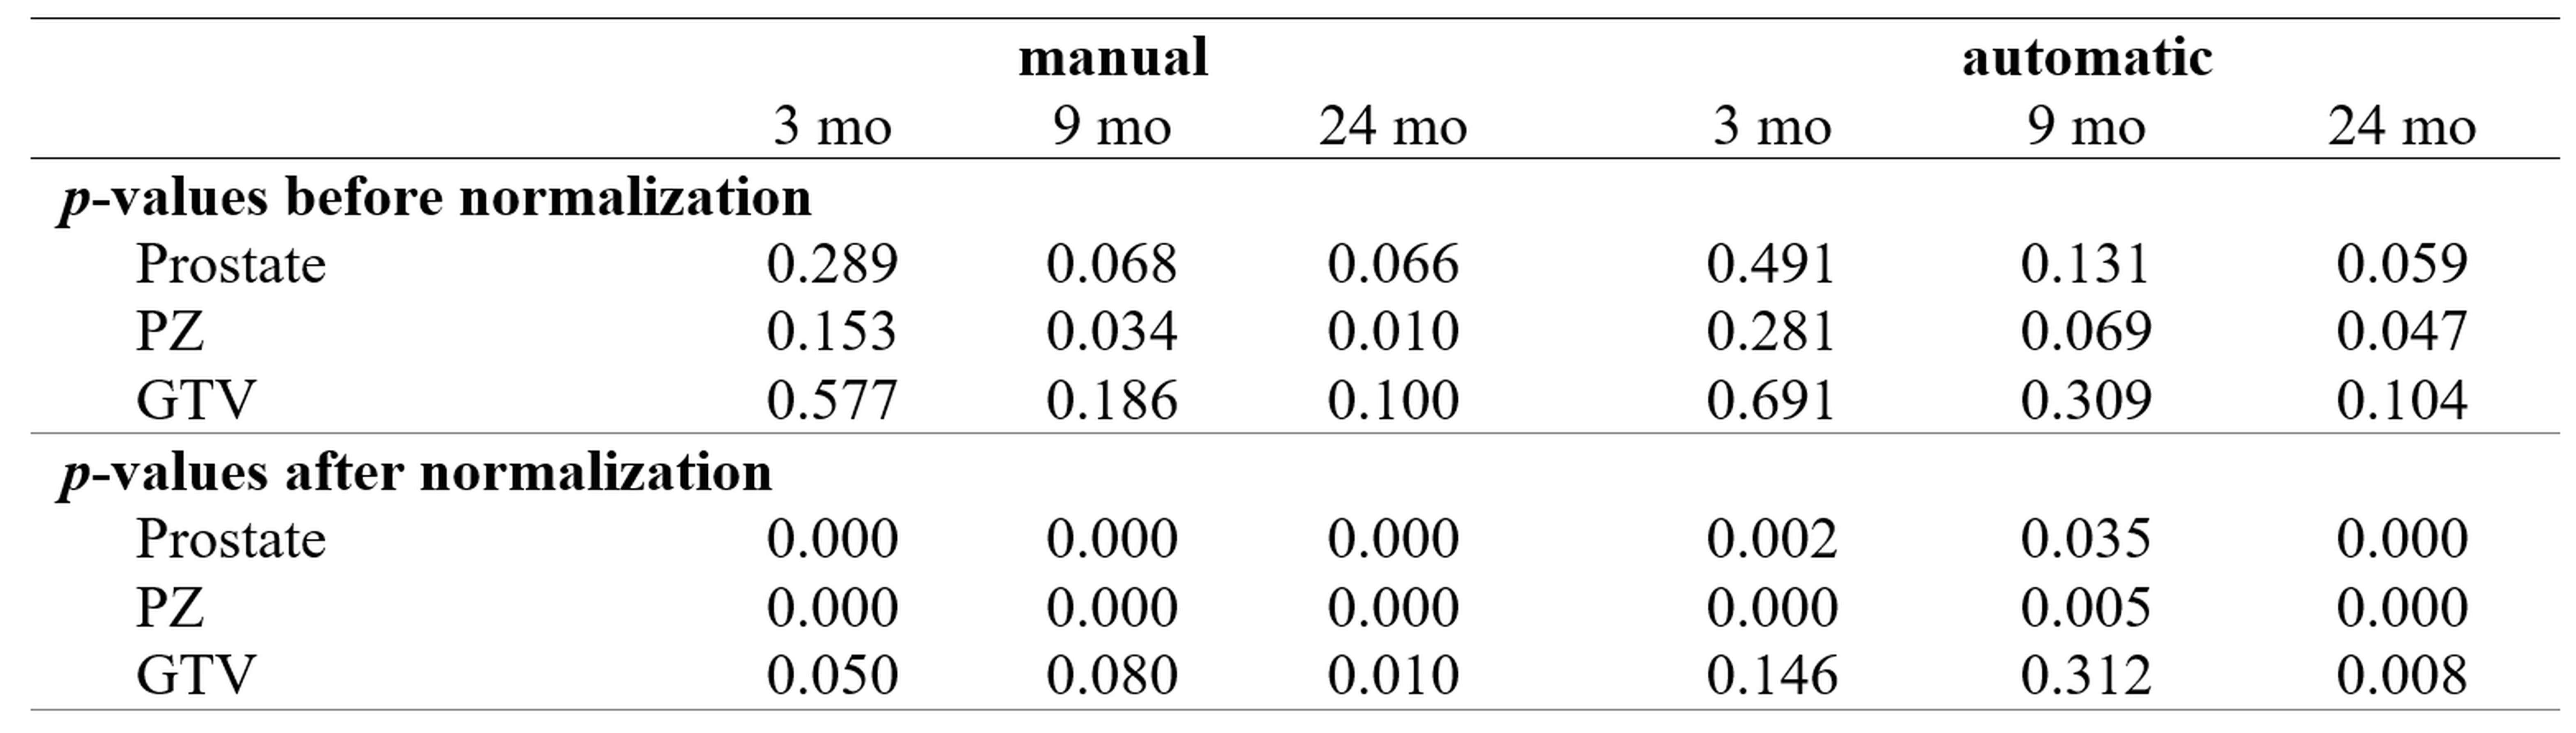
Table 2. P-values of intra-patient paired t-tests between
T2w values before
and after radiation treatment (RT). The pre-RT samples are the
average of two time points before RT.