0541
Automated Quality Control for Multi-Vendor, Multi-Centre Renal Imaging Studies1Sir Peter Mansfield Imaging Centre, University of Nottingham, Nottingham, United Kingdom, 2NIHR Nottingham Biomedical Research Centre, Nottingham University Hospitals NHS Trust and the University of Nottingham, Nottingham, United Kingdom, 3Neuroradiological Academic Unit, UCL Queen Square Institute of Neurology, University College London, London, United Kingdom, 4Dementia Research Centre, UCL Queen Square Institute of Neurology, University College London, London, United Kingdom, 5Wellcome Centre for Human Neuroimaging, UCL Queen Square Institute of Neurology, University College London, London, United Kingdom, 6Department of Radiology, Addenbrooke’s Hospital, Cambridge, United Kingdom, 7Department of Radiology, University of Cambridge, Cambridge, United Kingdom, 8Department of Infection, Immunity and Cardiovascular Disease, University of Sheffield, Sheffield, United Kingdom, 9Centre for Cardiovascular Science, University of Edinburgh, Edinburgh, United Kingdom
Synopsis
Keywords: Software Tools, Software Tools, Standardisation, Quality Control
Motivation: It is critical that MRI data acquired in multi-site, multi-vendor studies conforms to a standardised acquisition protocol.
Goal(s): To develop XNAT tools to highlight scans that do not conform to a specified protocol or are of insufficient quality, enabling rapid correction of errors before future scans.
Approach: Multi-site DICOM data is uploaded to XNAT after acquisition, by integrating software tools with this database, investigators are informed if data does not conform.
Results: DICOM-QC, a tool to automatically compare DICOM metadata to predefined values, and ImageSNR-QC to calculate image SNR, applied here to a multi-site kidney study.
Impact: This work outlines two tools that integrate with XNAT, DICOM-QC and ImageSNR-QC, which can be used by any investigators running large studies to ensure uploaded data conforms to the study protocol, ensuring consistency over sites, vendors, and repeated longitudinal scans.
Introduction
Standardisation and harmonisation of imaging protocols for large multi-site studies can be challenging. Ensuring imaging sites do not deviate from carefully optimised protocols over the duration of the study requires constant monitoring from the study coordinators to ensure any non-conforming data is detected quickly, and the site informed to minimise the number of participants data affected. Online image repositories, such as XNAT1, permit study data to be uploaded to a central database soon after acquisition, subject-by-subject, allowing continuous quality control (QC) of study data to be performed (rather than a large bulk data transfer to an analysis centre after all data acquisition is completed) and rapid analysis of simple data sets.Software Outline
DICOM-QCDICOM-QC is an open-source XNAT tool developed to automatically compare DICOM image acquisition parameters (DICOM tags) in the header to pre-defined values and highlight any discrepancies upon upload to XNAT enabling rapid feedback of errors to data acquisition centres. DICOM-QC was produced as part of the UK Renal Imaging Network: MRI Acquisition and Processing Standardisation (UKRIN MAPS) project2,3 for validation of the UKRIN_MAPS protocol.
A standardised core component naming convention is used for each scan in a multiparametric protocol collected across acquisition centres, allowing DICOM-QC to match protocols with expected acquisition parameters. Example DICOM tags that are tested are voxel/matrix size, TE/TR, phase encode direction, bandwidth, flip-angle, parallel imaging factor and number of echo/inversion times. Expected values are specified on a vendor-by-vendor basis and can take a specific value or a range. These values are input to XNAT as a spreadsheet, making modifications to expected values or setting up DICOM-QC for new studies simple.
ImageSNR-QC
Alongside DICOM-QC, we perform QC on the image SNR of anatomical T2-weighted single-shot-fast-spin-echo and T1- weighted gradient-echo structural acquisitions4. By running ImageSNR-QC on these scans this will detect any coil specific SNR issues. SNR is calculated using the UKRIN Kidney Analysis Toolbox (UKAT)5,6, as $$$\textrm{SNR}=\frac{Mean\left(\textrm{Foreground Voxels}\right)}{\sigma\left(\textrm{Background Voxels}\right)}\sqrt{2-\frac{\pi}{2}}$$$7. Foreground and background voxels are automatically segmented using a Gaussian mixture model. The SNR of each image is output to XNAT as a custom variable associated with each scanning session. Fails are flagged if the calculated SNR falls below a defined threshold. Additionally, SNR maps are generated and written to the database to allow tissue specific SNR to be measured at a later date.
These tools are currently being applied to the Application of Functional Renal MRI to improve assessment of chronic kidney disease (AFiRM) Study8. The AFiRM study is collecting multiparametric renal MRI data from 400 subjects at 10 sites across the UK on GE, Philips, and Siemens scanners at both baseline and 2 years follow-up.
Outputs
The result of an example DICOM-QC metadata-based check viewed as a report generated in XNAT is shown in Figure 1. Metadata fails indicate when parameters do not match the expected values, additionally warnings are produced if a DICOM tag is flagged to be checked but can’t be found in the uploaded metadata. The results of the ImageSNR-QC performed on the T2-weighted and T1- weighted images can be seen in Figure 2. The calculated SNR values can also be downloaded as a spreadsheet for a given study enabling analysis of site-by-site image quality (Figure 3).Future Developments
These tools could easily be utilised for non-renal applications. DICOM-QC currently checks the list of uploaded scans against the known acquisition parameters. In future versions of DICOM-QC, a warning that a scan has been missed or duplicated on the uploaded subject will be flagged. Further, scan planning geometry will be assessed, as within a renal MRI protocol most acquisitions are typically acquired in the same coronal-oblique plane to allow a voxel-by-voxel comparison of quantitative values. By comparing the affines of scans that should have the same planning, any cases where the planning has been changed will be flagged.ImageSNR-QC will be extended for kidney specific metrics using the fact that the kidneys are automatically segmented using a U-net when data is uploaded to XNAT9, these masks will be combined with the SNR maps to calculate values of image SNR in the kidneys.
Conclusion
DICOM-QC is a tool that integrates with XNAT and verifies that the uploaded data conforms with the study protocol and is of sufficiently high quality. If data does not meet the standards, the study team are alerted. These tools ensure that the data acquired for multi-site, multi-vendor studies are as accurate and of high quality as possible. Both tools are available at https://github.com/SPMIC-UoN/xnat-dicomqc and https://github.com/SPMIC-UoN/xnat-imgqcAcknowledgements
This work was funded by the UKRIN-MAPS MRC Partnership grant (MR/R02264X/1).References
1. Marcus DS, Olsen TR, Ramaratnam M, Buckner RL. The extensible neuroimaging archive toolkit. Neuroinformatics. 2007;5(1):11-33. doi:10.1385/NI:5:1:11
2. Buchanan CE, Li H, Nery F, et al. Harmonisation of Multiparametric Renal MRI for Multi-Centre Studies. In: Proc. Intl. Soc. Mag. Reson. Med. 29. Vol 29. Online; 2021:0417.
3. UK Renal Imaging Network (UKRIN): MRI Acquisition and Processing Standardisation (MAPS). https://www.nottingham.ac.uk/research/groups/spmic/research/uk-renal-imaging-network/ukrin-maps.aspx. Accessed July 10, 2023.
4. Will S, Martirosian P, Würslin C, Schick F. Automated segmentation and volumetric analysis of renal cortex, medulla, and pelvis based on non-contrast-enhanced T1- and T2-weighted MR images. Magn Reson Mater Phys Biol Med. 2014;27(5):445-454. doi:10.1007/s10334-014-0429-4
5. Daniel AJ, Nery F, Sousa J, Buchanan C. UKRIN Kidney Analysis Toolbox. February 2023. doi:https://doi.org/10.5281/zenodo.4742470
6. Daniel AJ, Nery F, Sousa J, et al. UKRIN Kidney Analysis Toolbox (UKAT): A Framework for Harmonized Quantitative Renal MRI Analysis. In: Proc. Intl. Soc. Mag. Reson. Med. 29. Vol 29. Online; 2021:3765.
7. National Electrical Manufacturers Association. Determination of Signal-to-Noise Ratio (SNR) in Diagnostic Magnetic Resonance Imaging. March 2021. https://www.nema.org/Standards/view/Determination-of-Signal-to-Noise-Ratio-in-Diagnostic-Magnetic-Resonance-Imaging.
8. Application of Functional Renal MRI to improve assessment of chronic kidney disease (AFiRM). https://www.uhdb.nhs.uk/afirm-study. Accessed July 10, 2023.
9. Daniel AJ, Buchanan CE, Allcock T, et al. Automated renal segmentation in healthy and chronic kidney disease subjects using a convolutional neural network. Magn Reson Med. 2021;86(2):1125-1136. doi:https://doi.org/10.1002/mrm.28768
Figures
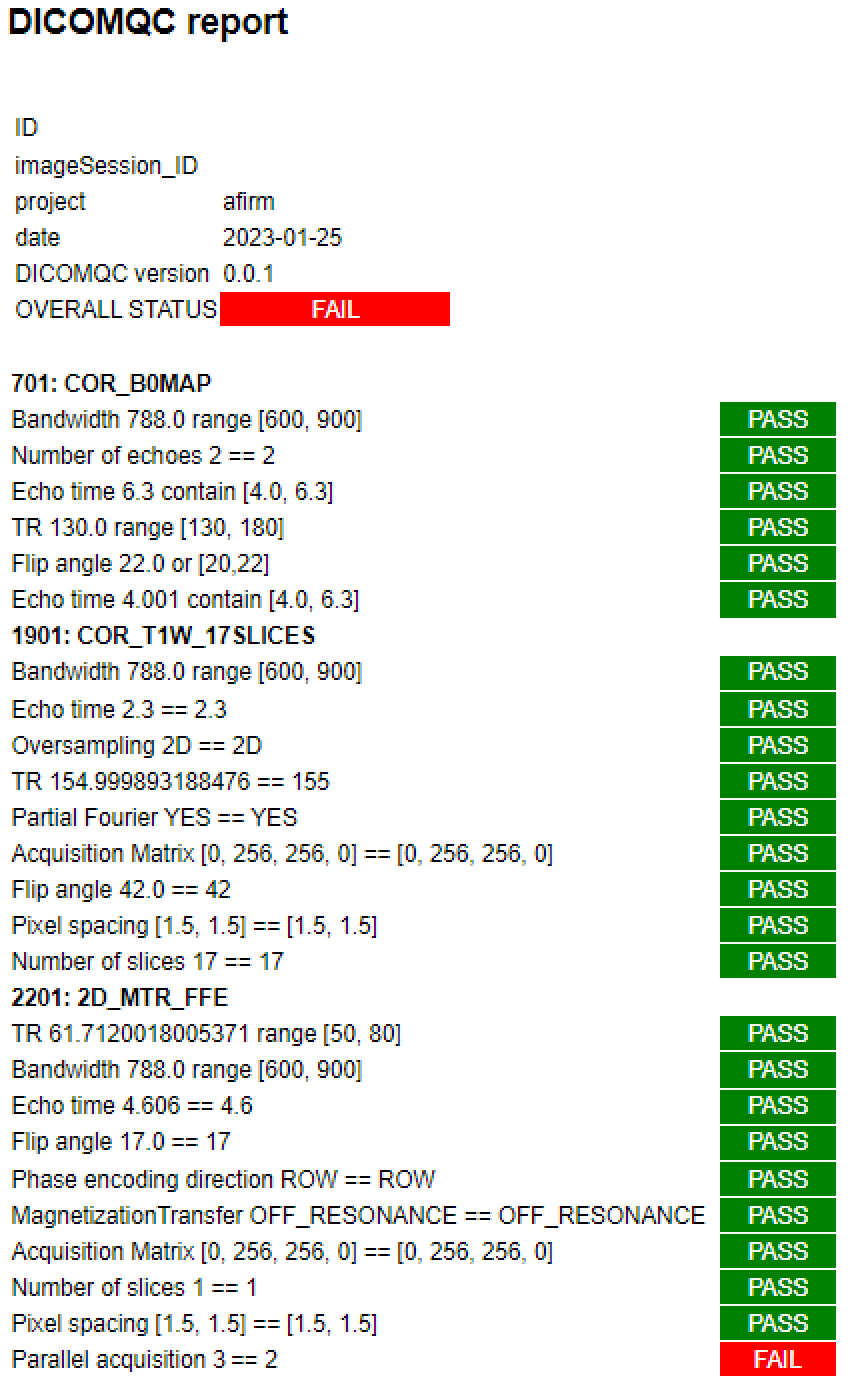
Figure 1: Example metadata report from DICOM-QC.
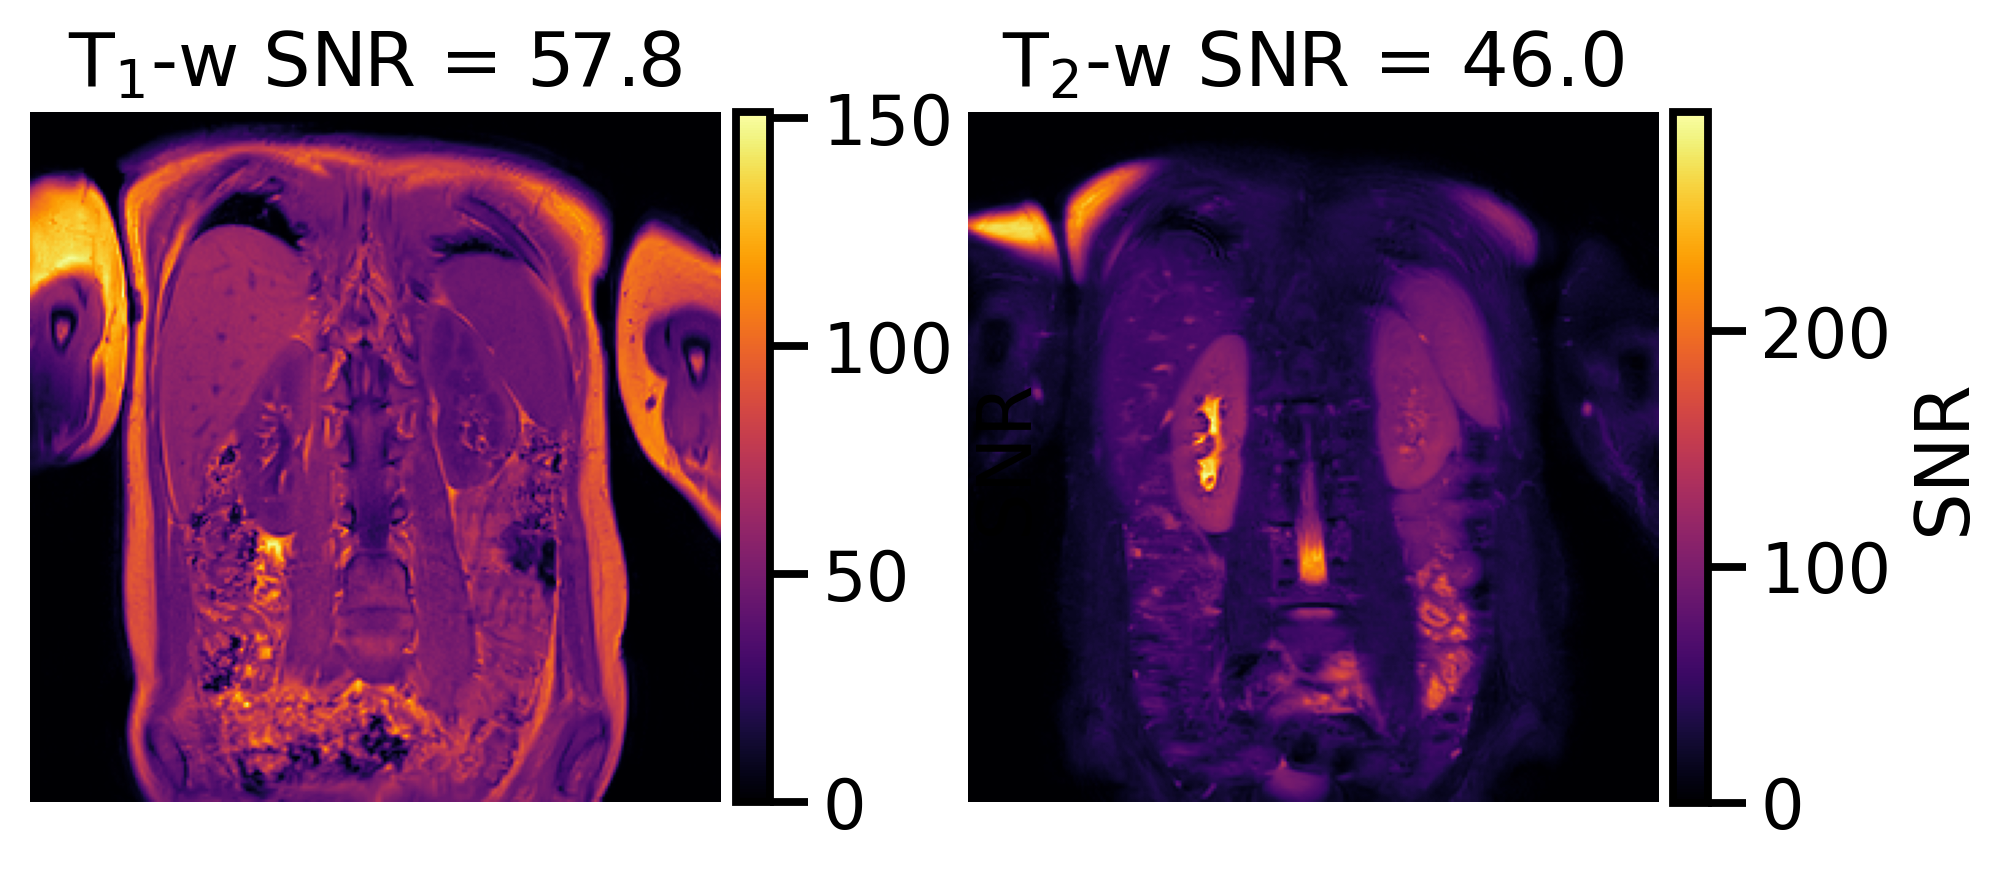
Figure 2: Image SNR maps of T1-weighted and T2-weighted images.
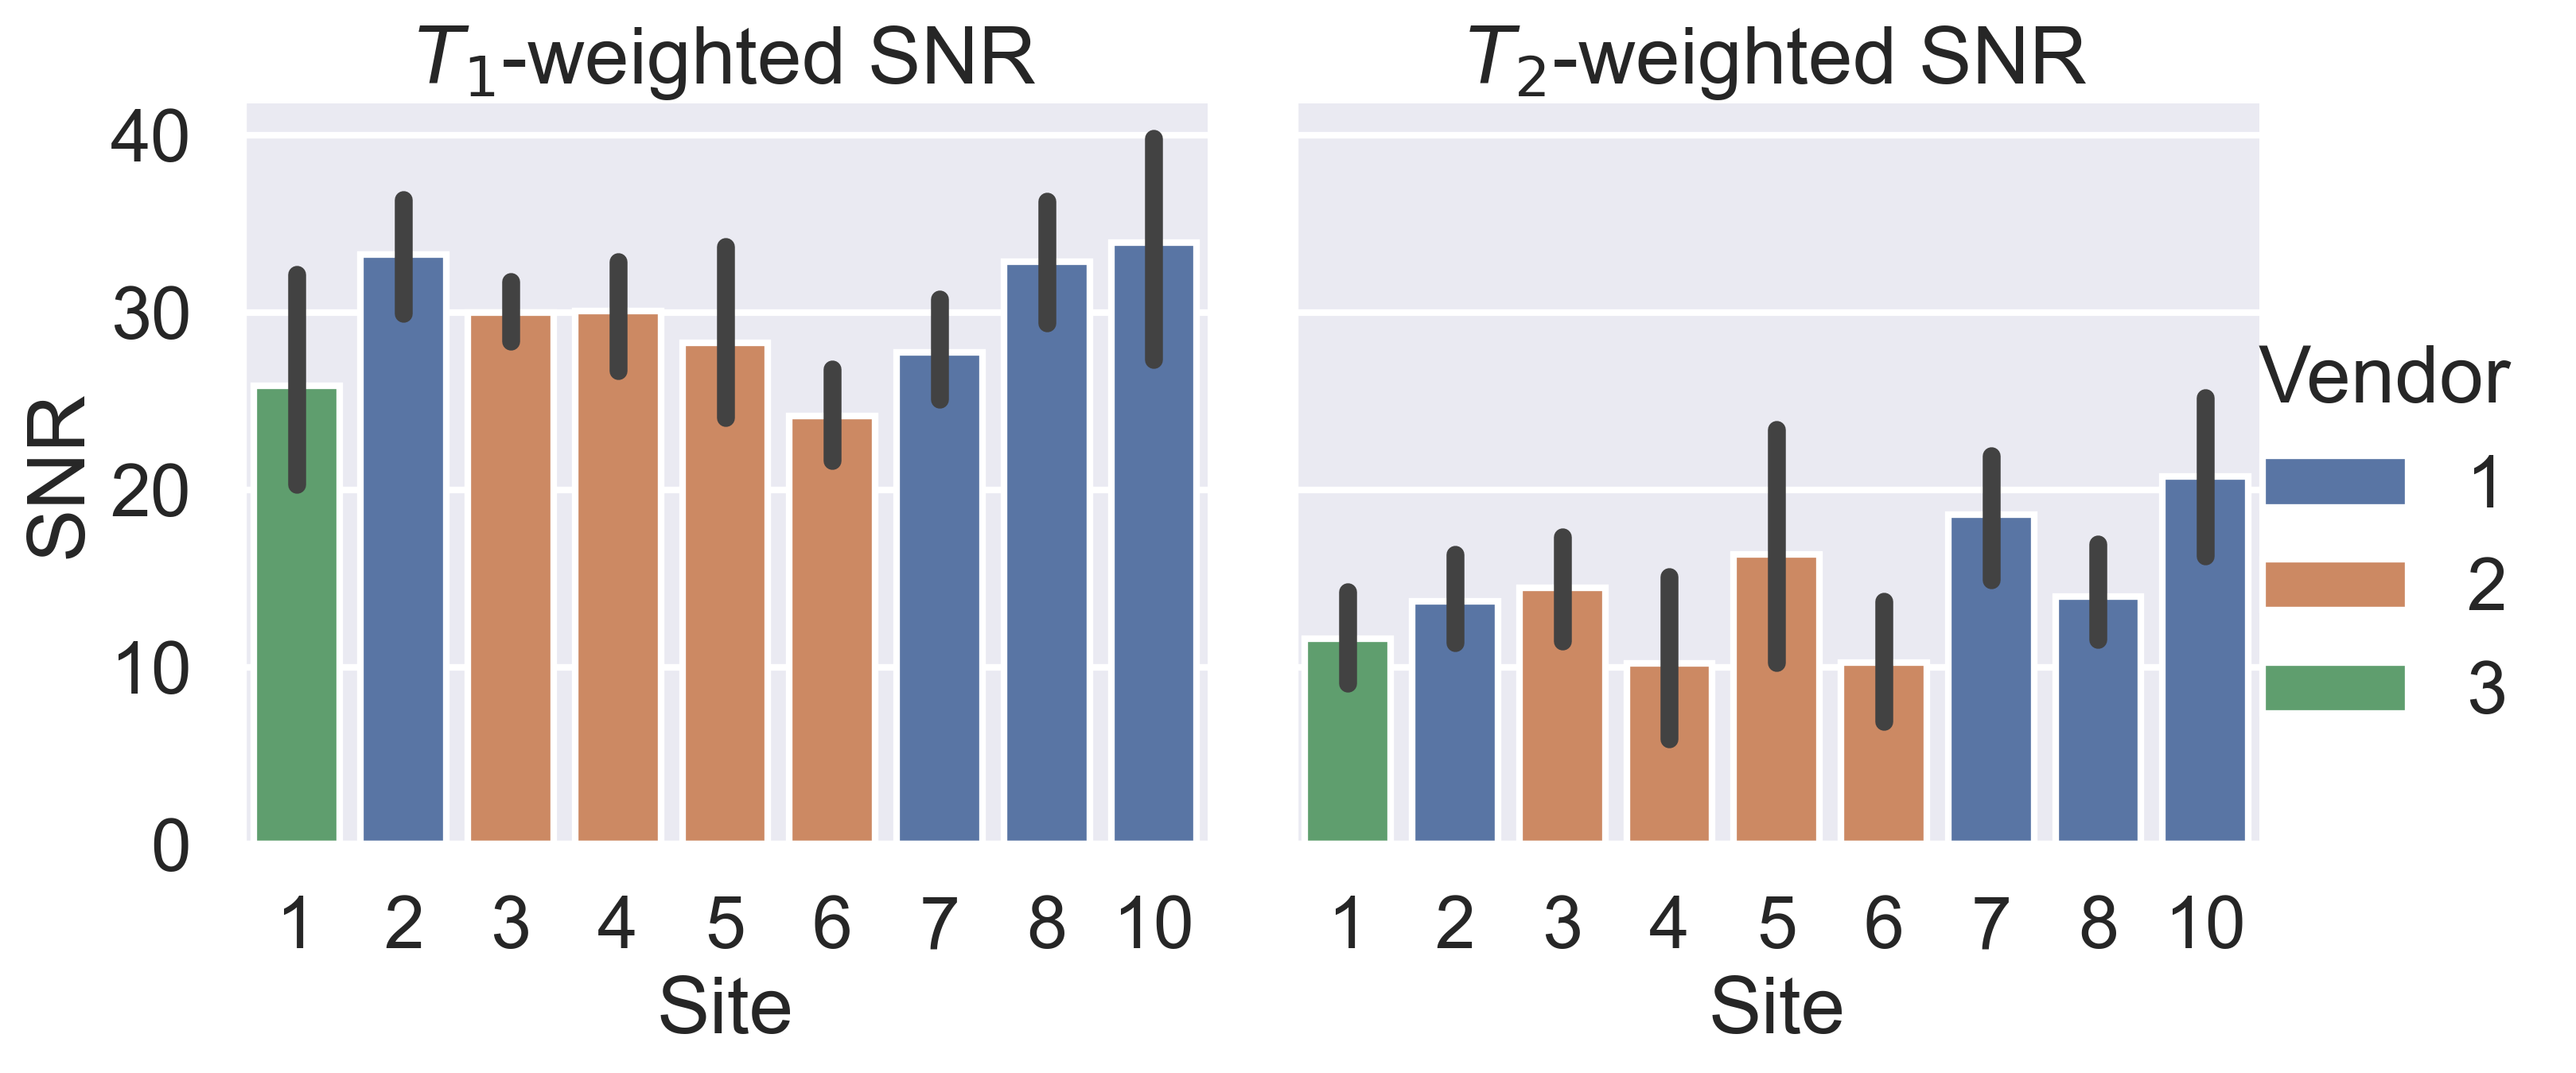
Figure 3: Image SNR across AFiRM sites for T1-weighted and T2-weighted anatomical images.