0539
Harnessing QA/QC protocols for diffusion MRI neuroimaging workflows with MRIQC1Dept. of Psychology and eScience Institute, University of Washington, Seattle, WA, United States, 2McGovern Institute for Brain Research, Massachusetts Institute of Technology, Cambridge, MA, United States, 3Dept. of Radiology, Lausanne University Hospital and University of Lausanne, Lausanne, Switzerland, 4Dept. of Psychology, Stanford University, Stanford, CA, United States
Synopsis
Keywords: Software Tools, Software Tools, QA/QC
Motivation: Reliable neuroimaging pipelines require the implementation of robust QA/QC protocols.
Goal(s): Developing an extension of MRIQC for the QA/QC of diffusion MRI data.
Approach: We build on MRIQC's infrastructure to generate individual visual reports of dMRI images and define new image quality metrics (IQMs).
Results: We developed a minimal processing pipeline for whole-brain dMRI data of human adults. The processing pipeline generates individual visual reports for the QA of unprocessed inputs. The pipeline also extracts IQMs to train automated decision-making, following MRIQC's established pattern.
Impact: MRIQC is a widely-adopted tool for the QA/QC of unprocessed MRI data. However, support for dMRI was previously lacking. This MRIQC extension will improve QA/QC of dMRI by bringing it to the highest standards and will facilitate the implementation of rigorous protocols in multimodal neuroimaging.
Introduction
Neuroimaging clinical and research workflows are continuously increasing in sophistication with the support of ever-growing technology. As a result of the growing complexity of workflows, establishing robust quality assessment and quality control (QA/QC) protocols is now widely accepted as key to ensuring the reliability of results1,2. A large body of evidence acknowledges that images of insufficient quality introduce biases sometimes comparable in size to the investigated effects across modalities3–5. While the NiPreps6 (NeuroImaging PREProcessing toolS) community had traditionally focused on functional MRI studies7, equivalent QA/QC protocol developments were lacking for the case of diffusion MRI (dMRI). Here, we extend MRIQC9 to support dMRI data.Methods
Data. We employed 100 randomly sampled dMRI images from the Healthy Brain Network10 (HBN) database. Data were accessed using DataLad11 through the Lifespan Informatics and Neuroimaging Center at the University of Pennsylvania (https://github.com/PennLINC/HBN_BIDS). We also employed 40 sessions of the Human Connectome PHantom (HCPh) project12 to evaluate the extension on more sophisticated data.Image processing. The new MRIQC extension implements a minimal pipeline to extract quality information from the input dMRI images, which must be stored within a BIDS-compliant13,14 dataset. Processing follows the following steps:
- Data introspection: estimates the number of diffusion shells (concentric diffusion weightings when sampling the so-called Q-space) and generates data views for utilization downstream. Datasets estimated with five or more shells are deemed diffusion spectrum imaging (DSI), where the sampling of the Q-space is cartesian as opposed to spherical.
- Reference volume generation and brain extraction: we use SynthStrip15 on the voxel-wise average across low-b (b < 50 s/mm2) volumes in the image.
- Global statistics extraction: if collated throughout the dMRI dataset (which is a common practice), a signal drift is calculated across the dMRI series. At this step, shell-wise average and standard deviation maps are generated to extract image quality metrics (IQMs) and generate reportlets (atomic visualizations for the QA of specific image facets that are then combined to build an ‘individual report’).
- Internal diffusion tensor imaging (DTI) model: using the subset of data with b-value closest to b = 1,000 s/mm2, we fit an internal (i.e., not exposed at the output for downstream use) DTI model with DIPY16. The DTI model is calculated to generate further reportlets and to extract IQMs.
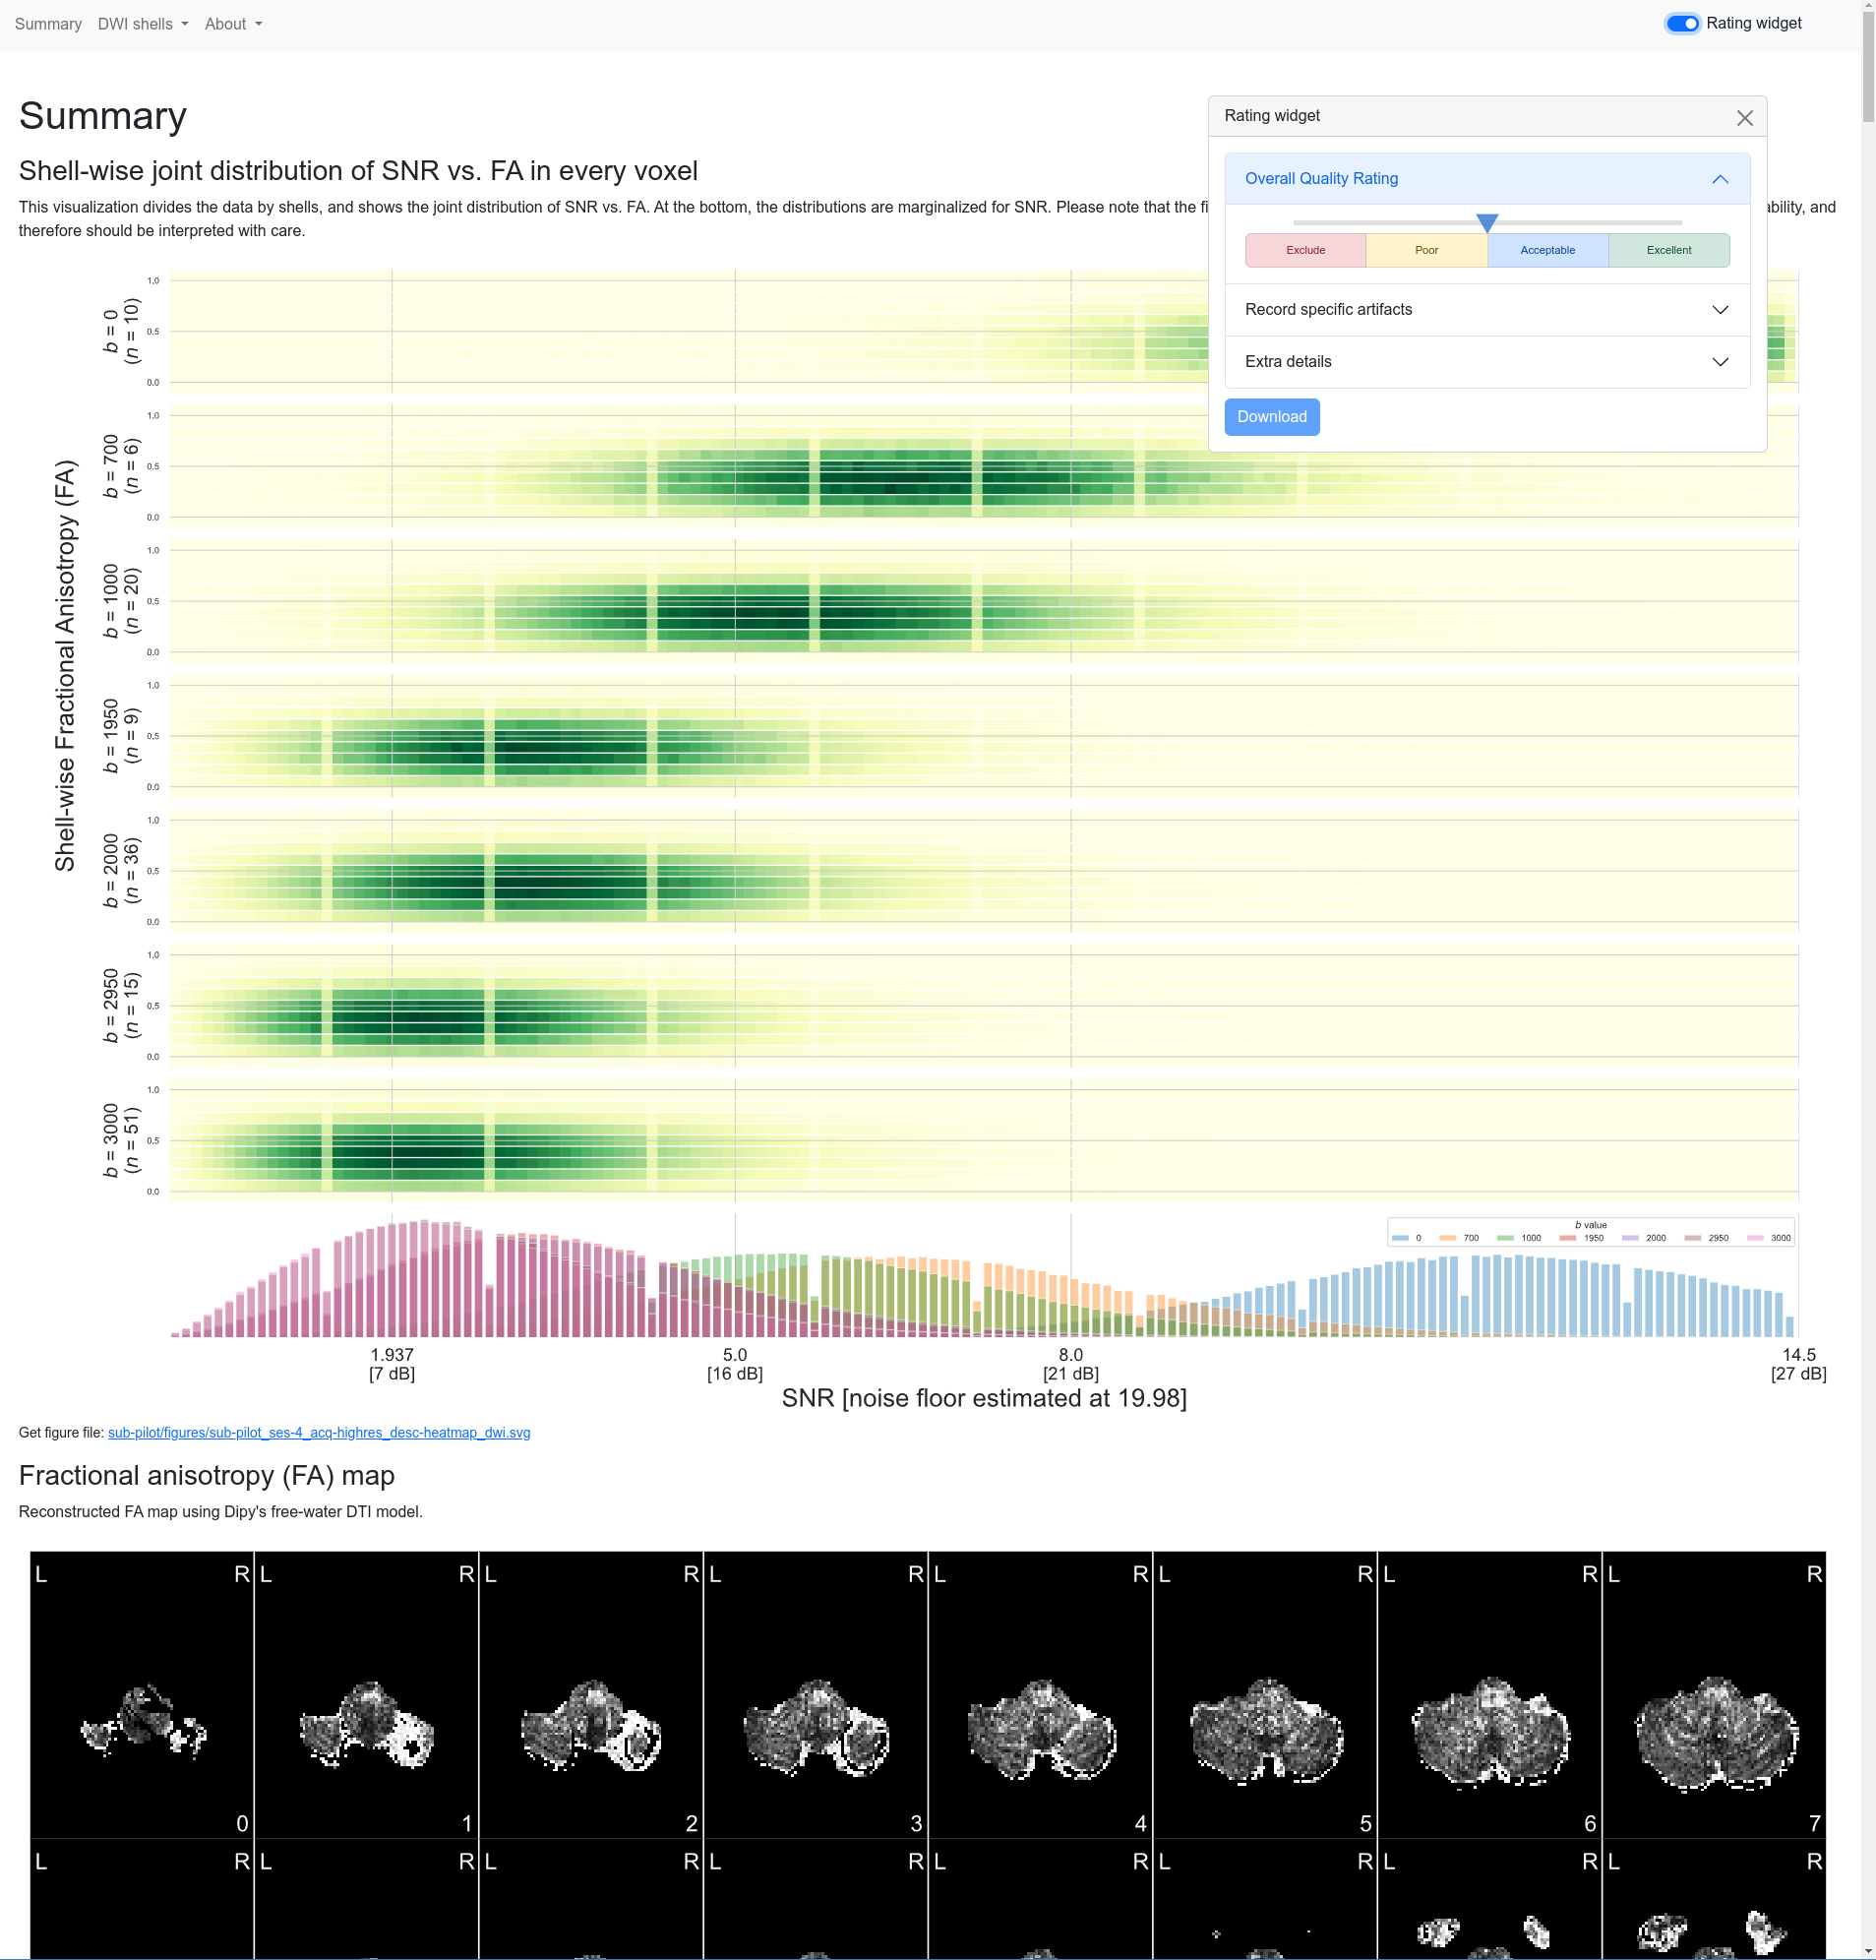
- Reportlet generation: the workflow generates several visualizations of the data and statistics (e.g., shell-wise mosaic views of standard deviation and average maps, shell-wise mosaic views of the background distribution, mosaics of the fractional anisotropy (FA) and other DTI-derived scalar maps, a plot with shell-wise heatmaps of SNR versus FA, and a developed version of the four-dimensional data adapted from functional MRI QA17).
- IQMs generation: currently, the workflow segments regions-of-interest and derived maps (e.g., by executing MRTrix’s dwidenoise) to estimate noise floor, spike percentage —global and slice-wise—, variance estimation on the low-b volumes, probabilistic identification and estimation of noise (PIESNO18), and highest-and-lowest estimation of signal-to-noise ratio within the corpus callosum.
- Visual report generation: the reportlets generated in step 5 are then combined into a single, shareable HTML document built with NiReports (https://github.com/nipreps/nireports), which includes the “rating widget” of MRIQC reports.
Results
MRIQC enables efficient screening of unprocessed dMRI data. The visual reports (Figure 1) are an effective way of extracting insights from the unprocessed data. Author OE spent a total of 5h 37min for the rating of the 140 datasets. The average rating time for the HBN data was 2 min 16 s per report (100 images, total 3h 46 min), and 2 min 45 s for the case of the HCPh dataset (40 images, total 1h 51 min).New IQMs were proposed for the automated assessment. We defined five new dMRI-specific IQMs that can now be employed with manual annotations to train automated decisions such as MRIQC-learn20.
Conclusion
This extension of MRIQC offers a comprehensive solution for QA/QC of unprocessed dMRI data of the human brain. MRIQC for dMRI fills a current gap in the field and facilitates implementing rigorous protocols in neuroimaging, ultimately enhancing the efficiency and reliability of multimodal MRI studies.Acknowledgements
This work is steered and maintained by the NiPreps Community. The development of this resource was supported by the NIMH (RF1MH121867, OE, AR). OE and CP receive support from the Swiss NSF #185872).Figures