0538
Improved across-scanner reproducibility using vendor-agnostic diffusion sequences1Brigham and Women’s Hospital, Harvard Medical School, Boston, MA, United States, 2School of Biomedical Engineering, Southern Medical University, Guangzhou, China, 3Fetal-Neonatal Neuroimaging and Developmental Science Center, Boston Children’s Hospital, Harvard Medical School, Boston, MA, United States, 4Athinoula A. Martinos Center for Biomedical Imaging, Massachusetts General Hospital, Charlestown, MA, United States, 5Department of Radiology, Harvard Medical School, Boston, MA, United States, 6Department of Biomedical Engineering, Case School of Engineering, Case Western Reserve University, Cleveland, OH, United States, 7fMRI Laboratory and Biomedical Engineering, University of Michigan, Ann Arbor, MI, United States, 8Division of Medical Physics, Department of Radiology, University Medical Center Freiburg, Freiburg, Germany
Synopsis
Keywords: Diffusion Acquisition, Diffusion Tensor Imaging
Motivation: The reproducibility of diffusion MRI (dMRI) data collected at multiple sites can be affected by differences between MRI scanners, especially scanners from different manufacturers.
Goal(s): To develop vendor-neutral dMRI pulse sequences using our Pulseq development platform and reduce the inter-scanner variability between scanners from different vendors.
Approach: Using a diffusion phantom and with three human subjects, we tested inter-scanner variability using Pulseq and vendor-specific product sequences. We report inter-scanner variations using standard error for mean diffusivity and fractional anisotropy.
Results: Pulseq sequence yielded dramatically better results (>2x reduction in variability) enhancing the reliability of dMRI measurements across scanners.
Impact: The vendor-neutral Pulseq-diffusion sequence has the potential to harmonize data acquisition and improve the robustness of diffusion MRI, making it an invaluable tool for advancing multi-site studies.
Introduction
Quantitative metrics derived from diffusion MRI (dMRI)1 are crucial in clinical research. Ensuring the reliability and consistency of dMRI results, especially in multi-center/multi-site studies is paramount. However, disparities arise due to differences in scanner hardware, software, imaging protocols, and calibration methods from various manufacturers, leading to significant measurement variations.2,3,4,5,6Pulseq, an open-source platform for sequence development, offers a vendor-neutral solution for creating MRI sequences that can be used across scanners from multiple vendors.7,8 This platform eliminates barriers to harmonizing MRI data acquisition and reconstruction.
In this study, we implemented the standard EPI-based dMRI sequence in Pulseq. We tested it on Siemens and GE scanners, systematically evaluating and comparing the within- and inter-scanner variability across the vendors, using both the product and Pulseq dMRI sequences. Our assessment covers both a diffusion phantom and human subjects, using standard error9 and Pearson's correlation to illustrate the within- and inter-scanner variability in measuring mean diffusivity (MD) and fractional anisotropy (FA).
Methods
A diffusion phantom10 and three healthy male subjects were enrolled for this study following approval from the IRB at BWH. The study was conducted on two 3T scanners (Siemens Prisma with 32-channel coil and GE Premier with 48-channel coil), using vendor-provided dMRI sequences and the one we developed using Pulseq. Scan parameters were identical: TR/TE/echo-spacing=11,000/58/0.69 ms, FOV=220×220 mm2, and 1.5 mm isotropic resolution, GRAPPA=3, PF=6/8, 60 diffusion directions, and b-value=1000 s/mm2.Repeatability assessments involved scan-rescan sessions for the phantom and subjects, with in-vivo scans performed on the same day (a total of 4 scans per subject spread over 2 hours). Custom MATLAB scripts were used to reconstruct Pulseq data, and eddy and TOPUP corrections were applied to mitigate distortions and eddy-current effects for all sequences.
For the phantom, mean diffusivity (MD) values were calculated from three consecutive slices, and MD and fractional anisotropy (FA) maps were derived from in-vivo data. Repeatability and reproducibility were assessed using Pearson’s Correlation and standard error analyses9 for MD measurements in the phantom. Standard errors were also calculated for in-vivo data in subcortical, cortical, and white matter using region-based analysis.
Results
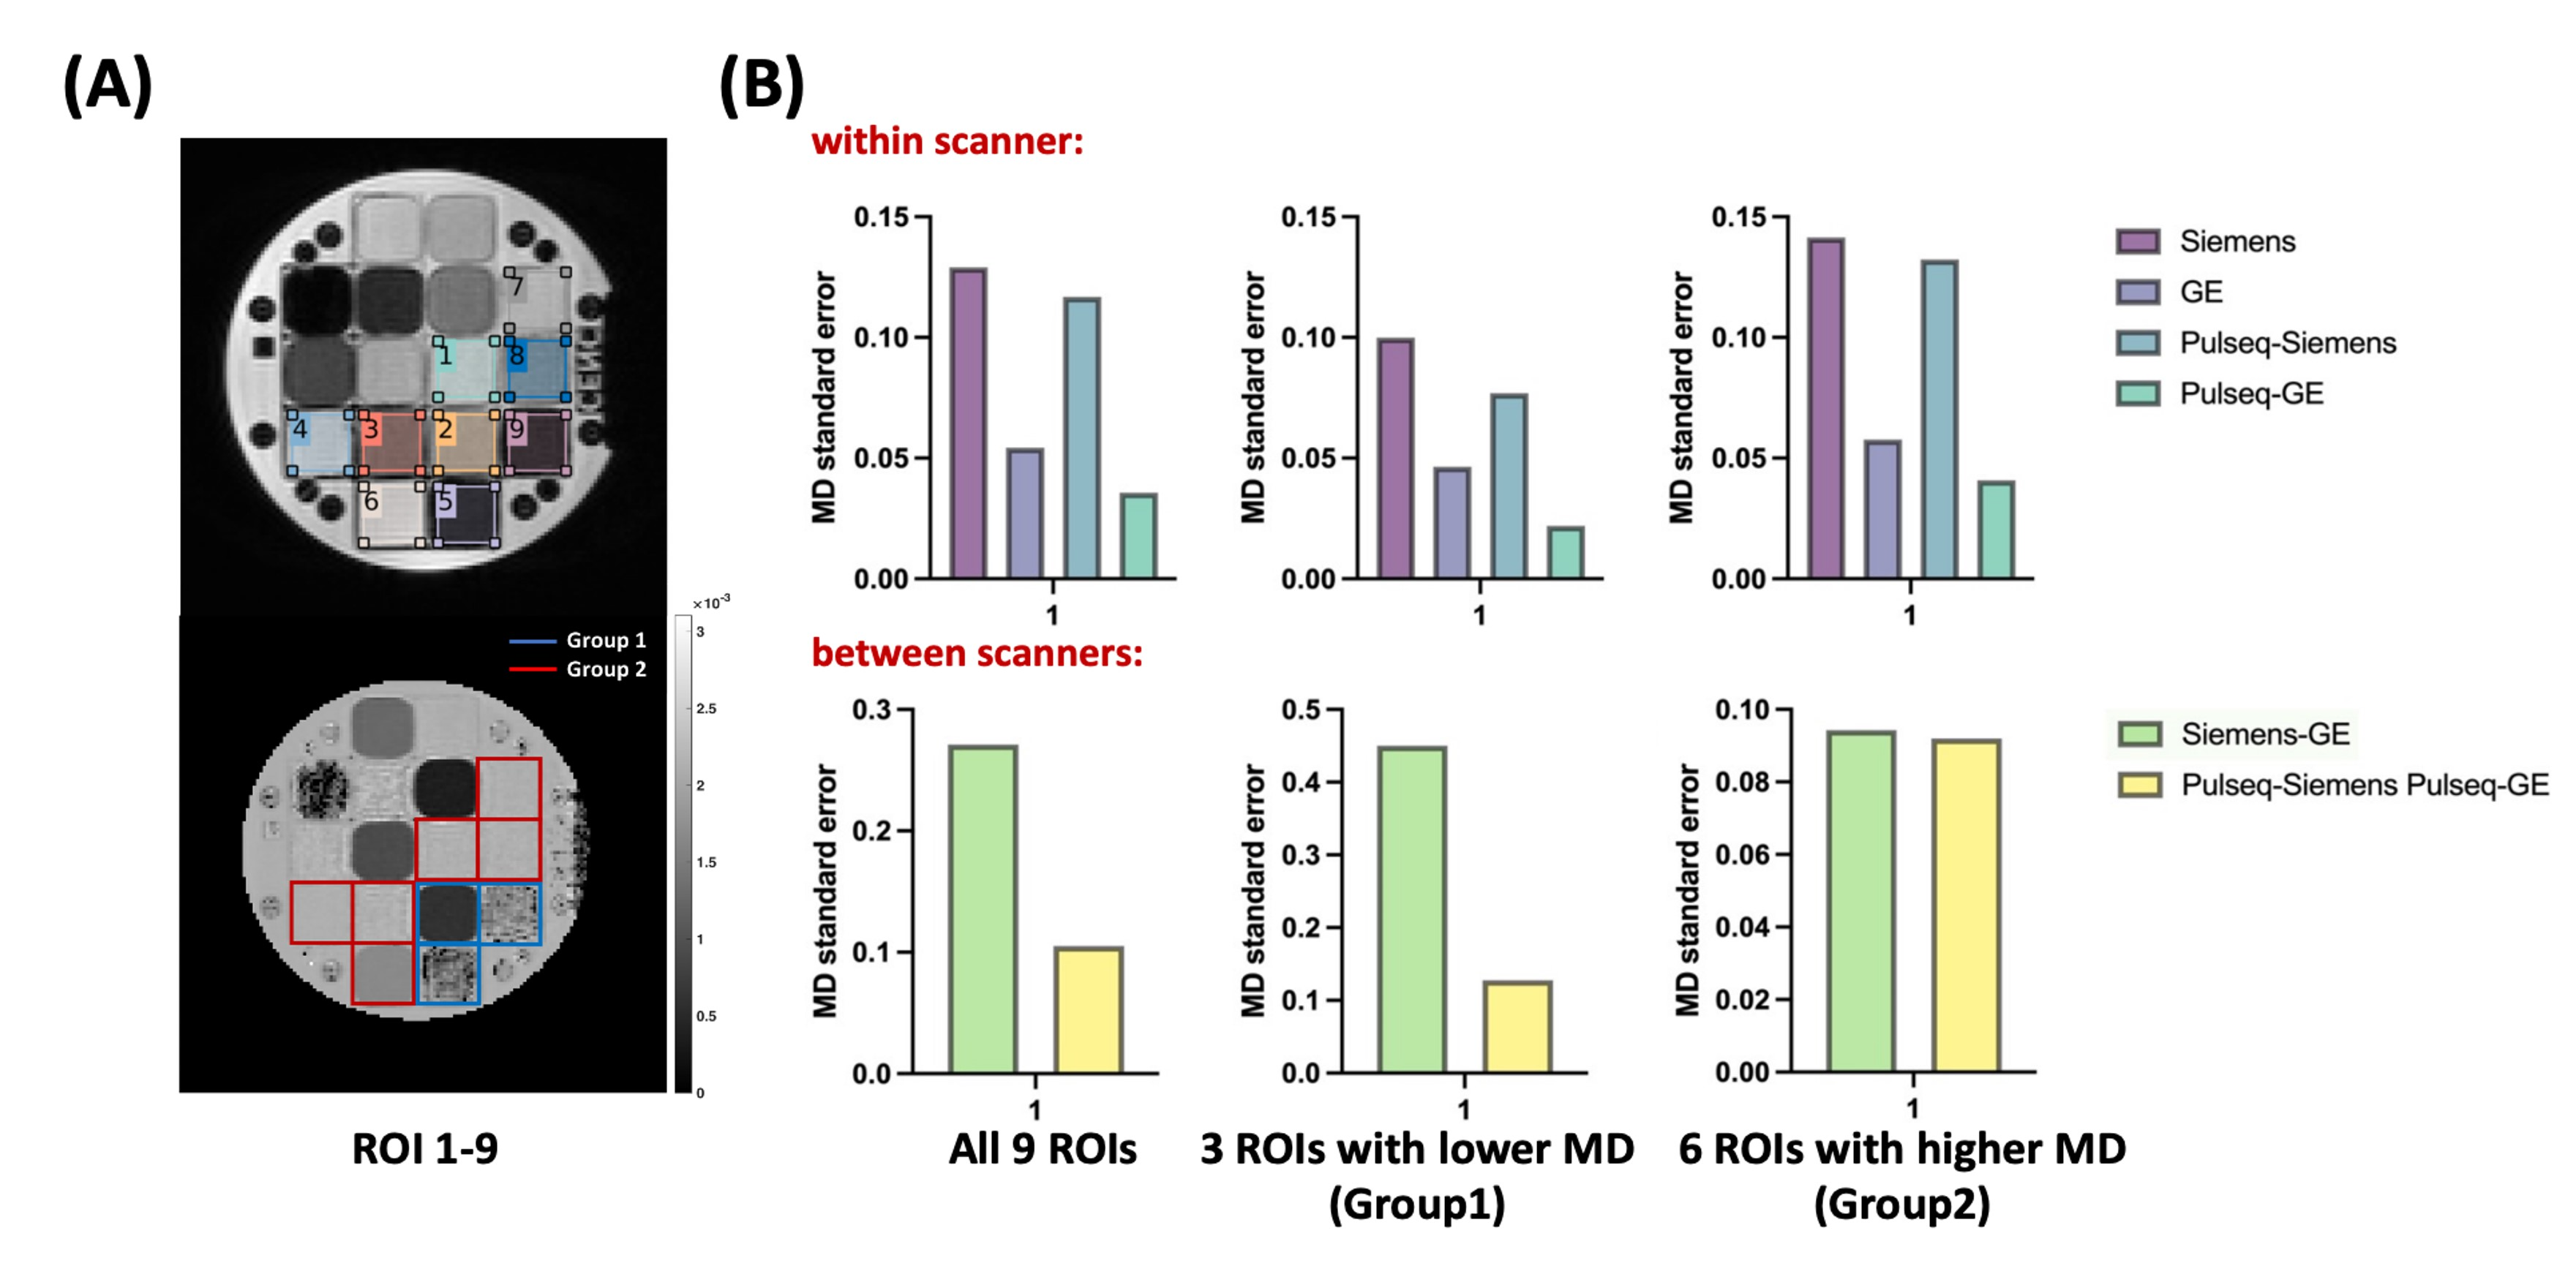
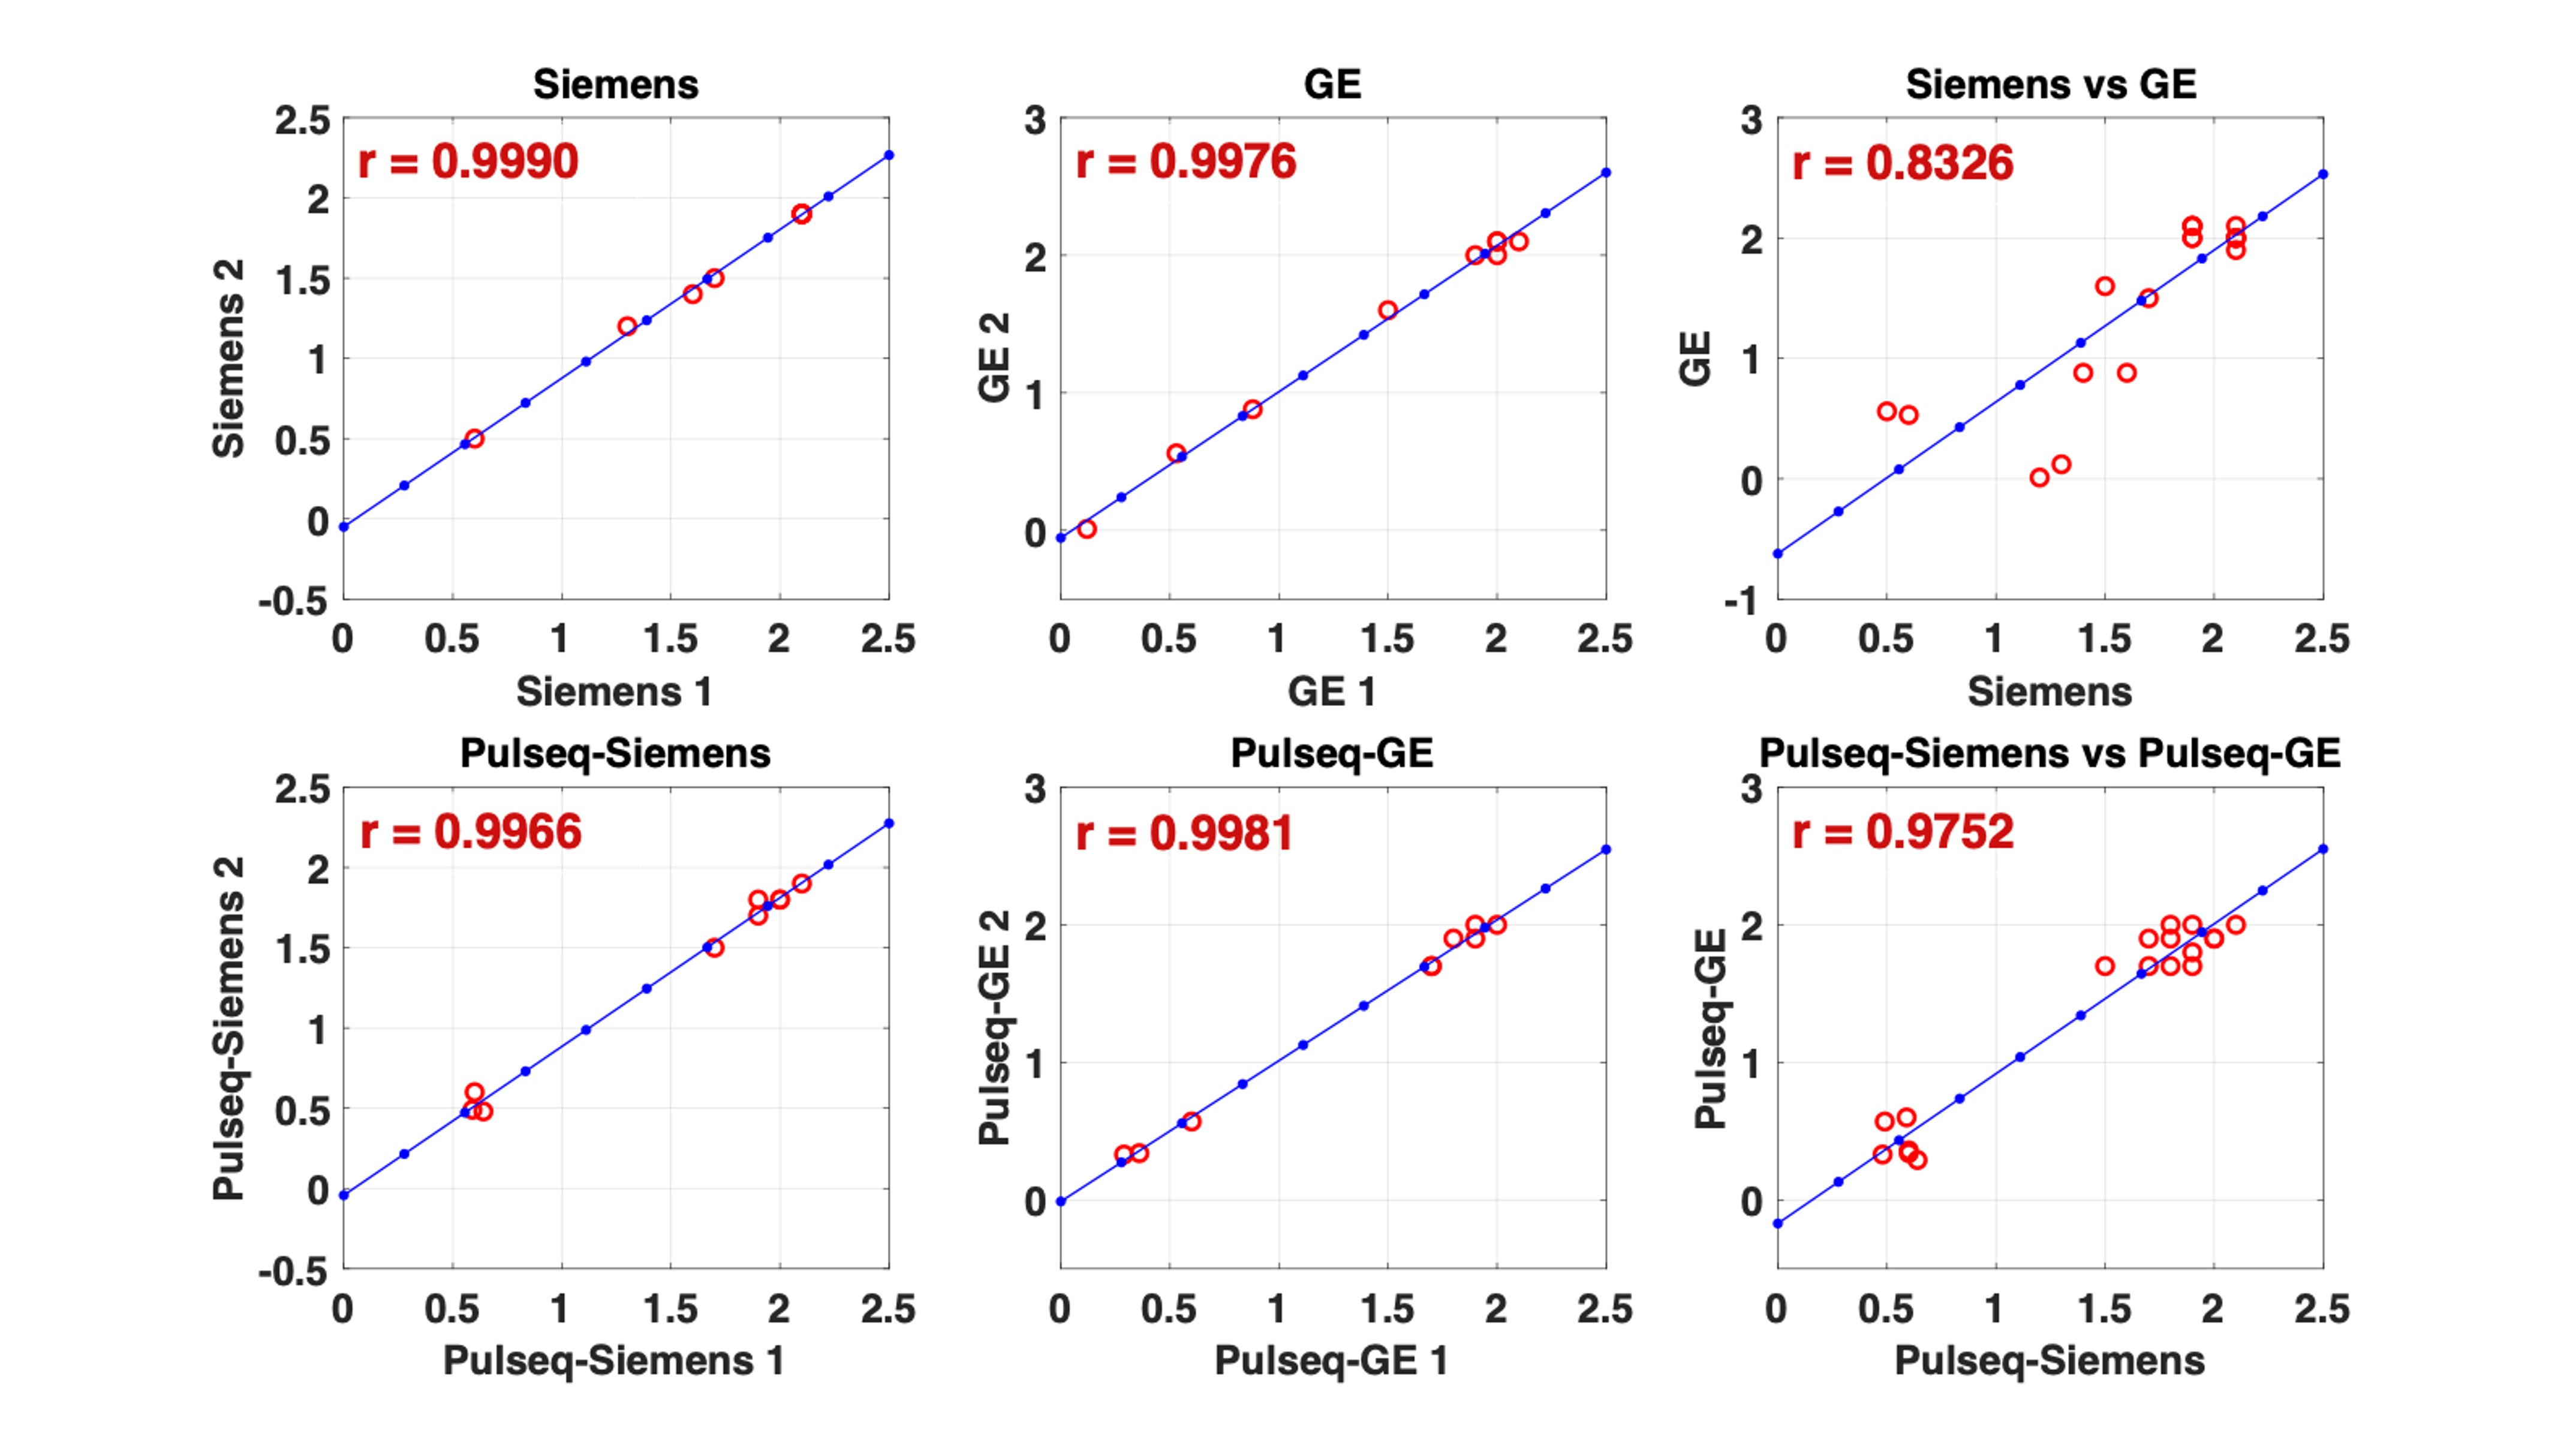
Figure 1(A) illustrates 9 ROIs in the phantom with varying diffusivities on an example slice. Figure 1(B) displays the standard errors (SE) for the MD values in both scan-rescan and inter-scanner sessions. Best repeatability results were observed using Pulseq sequences (overall). Compared to the vendor-provided sequences, our Pulseq sequence exhibited superior reproducibility (better by a factor of ~2.5x; see Fig.1B (all 9 ROIs)), particularly for ROIs with lower MD values.Figure 2 demonstrates Pearson's correlation of MD values between scan-rescan sessions and across different scanners. The inter-scanner correlation coefficient (r = 0.9752) for the Pulseq diffusion sequences closely approximated the scan-rescan correlations (ranging from 0.9966 to 0.9990) and was dramatically higher than the correlation obtained with product Siemens-GE sequences (r = 0.8352).
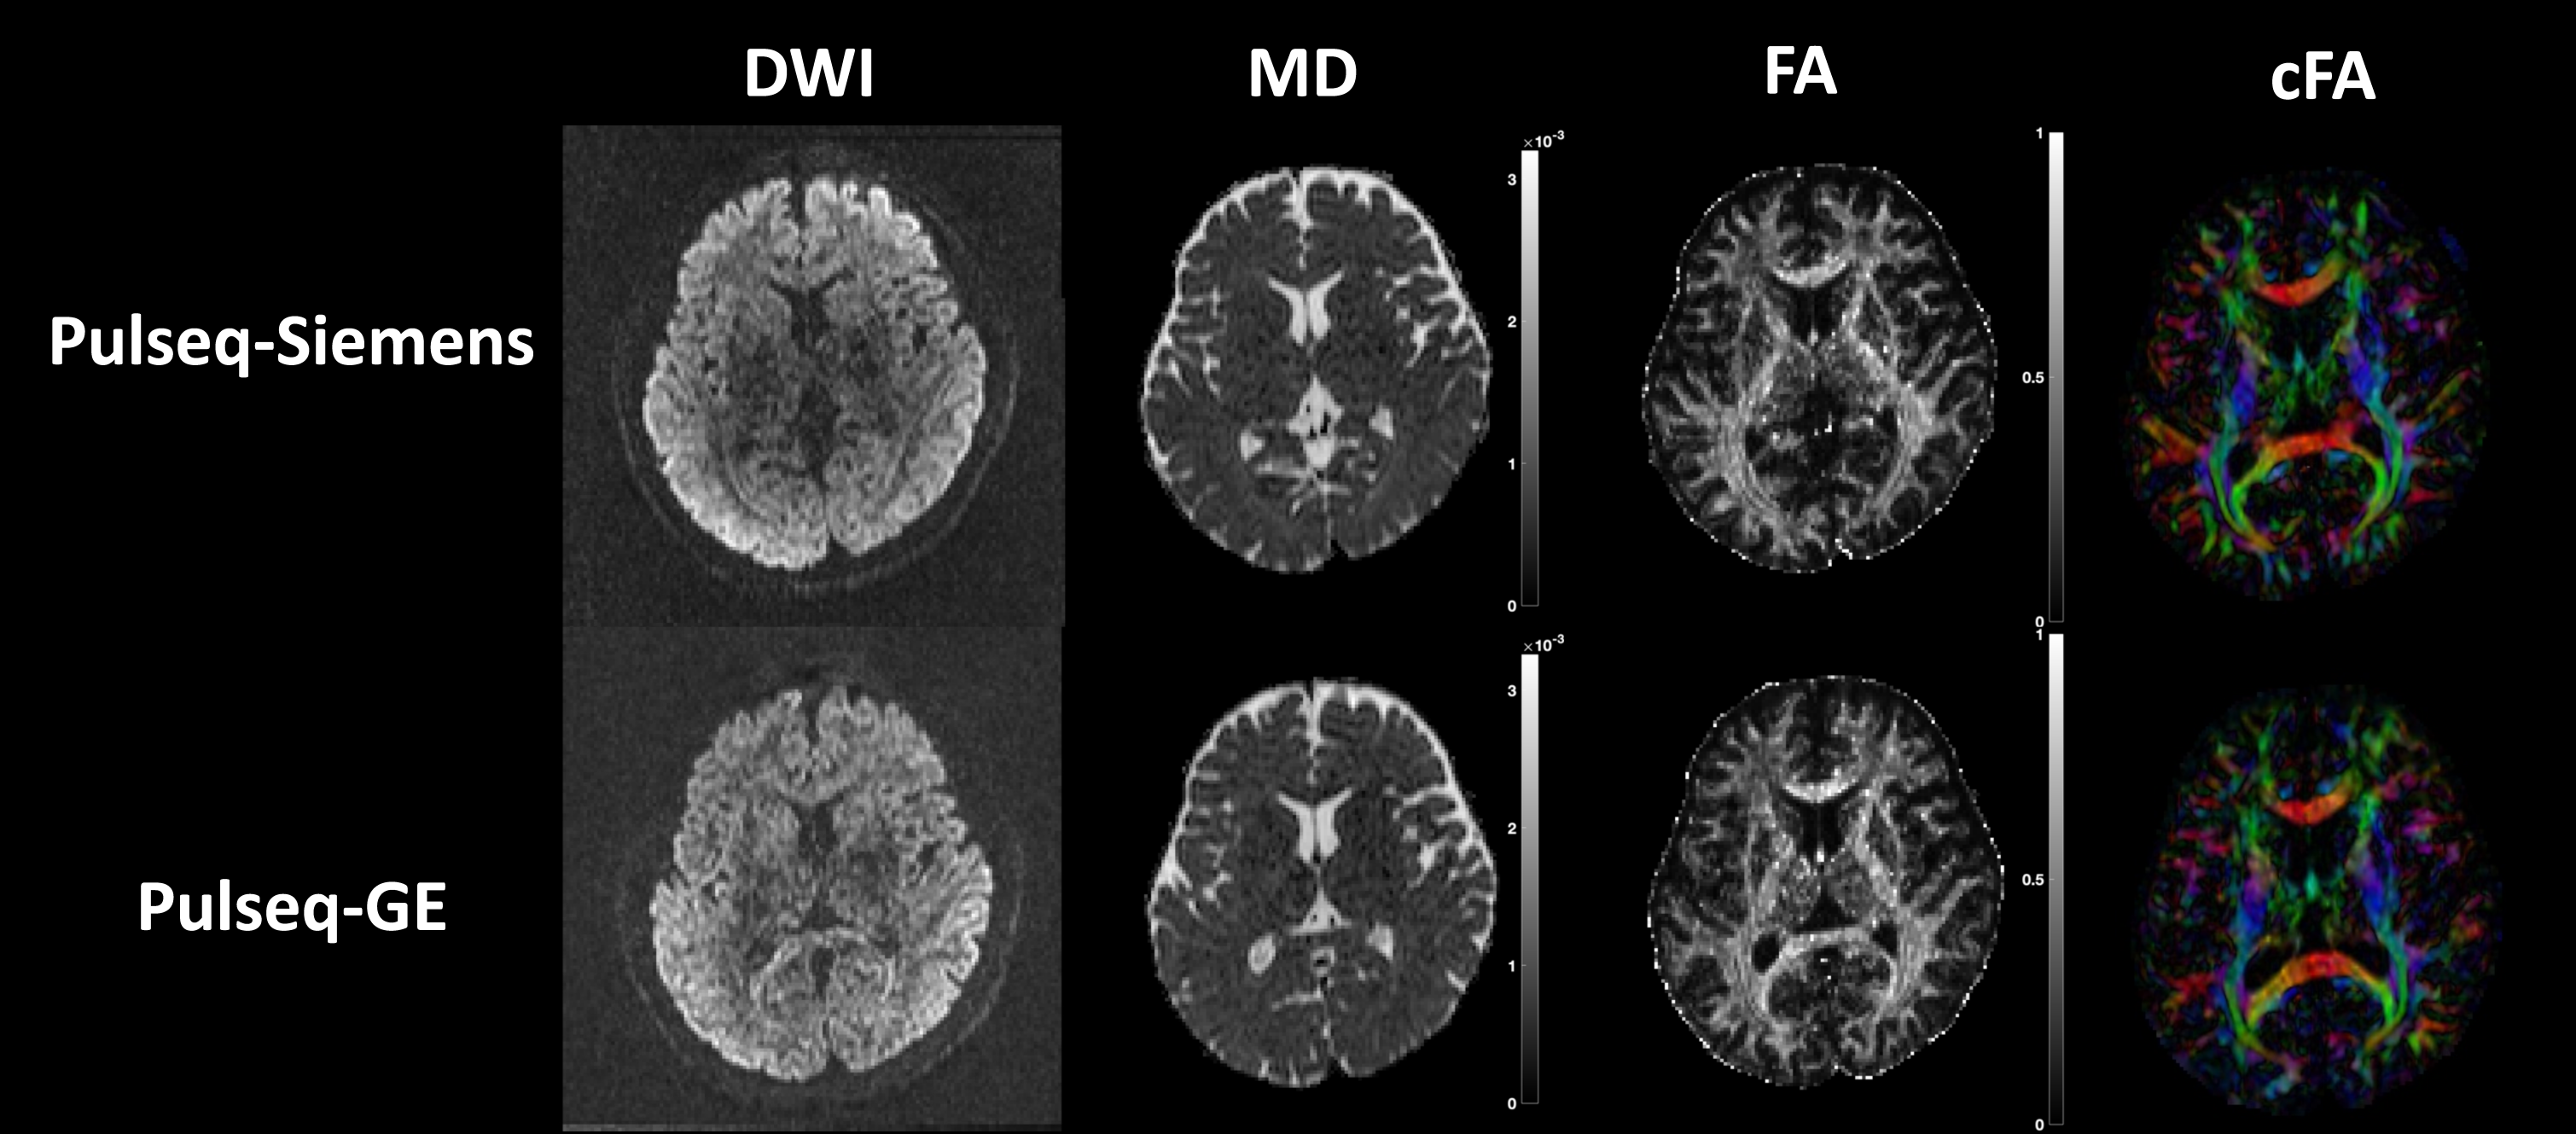
Figure 3 shows a representative DWI slice and diffusion-derived metrics, such as MD, FA, and color-encoded FA maps obtained using our Pulseq sequence on both scanners.
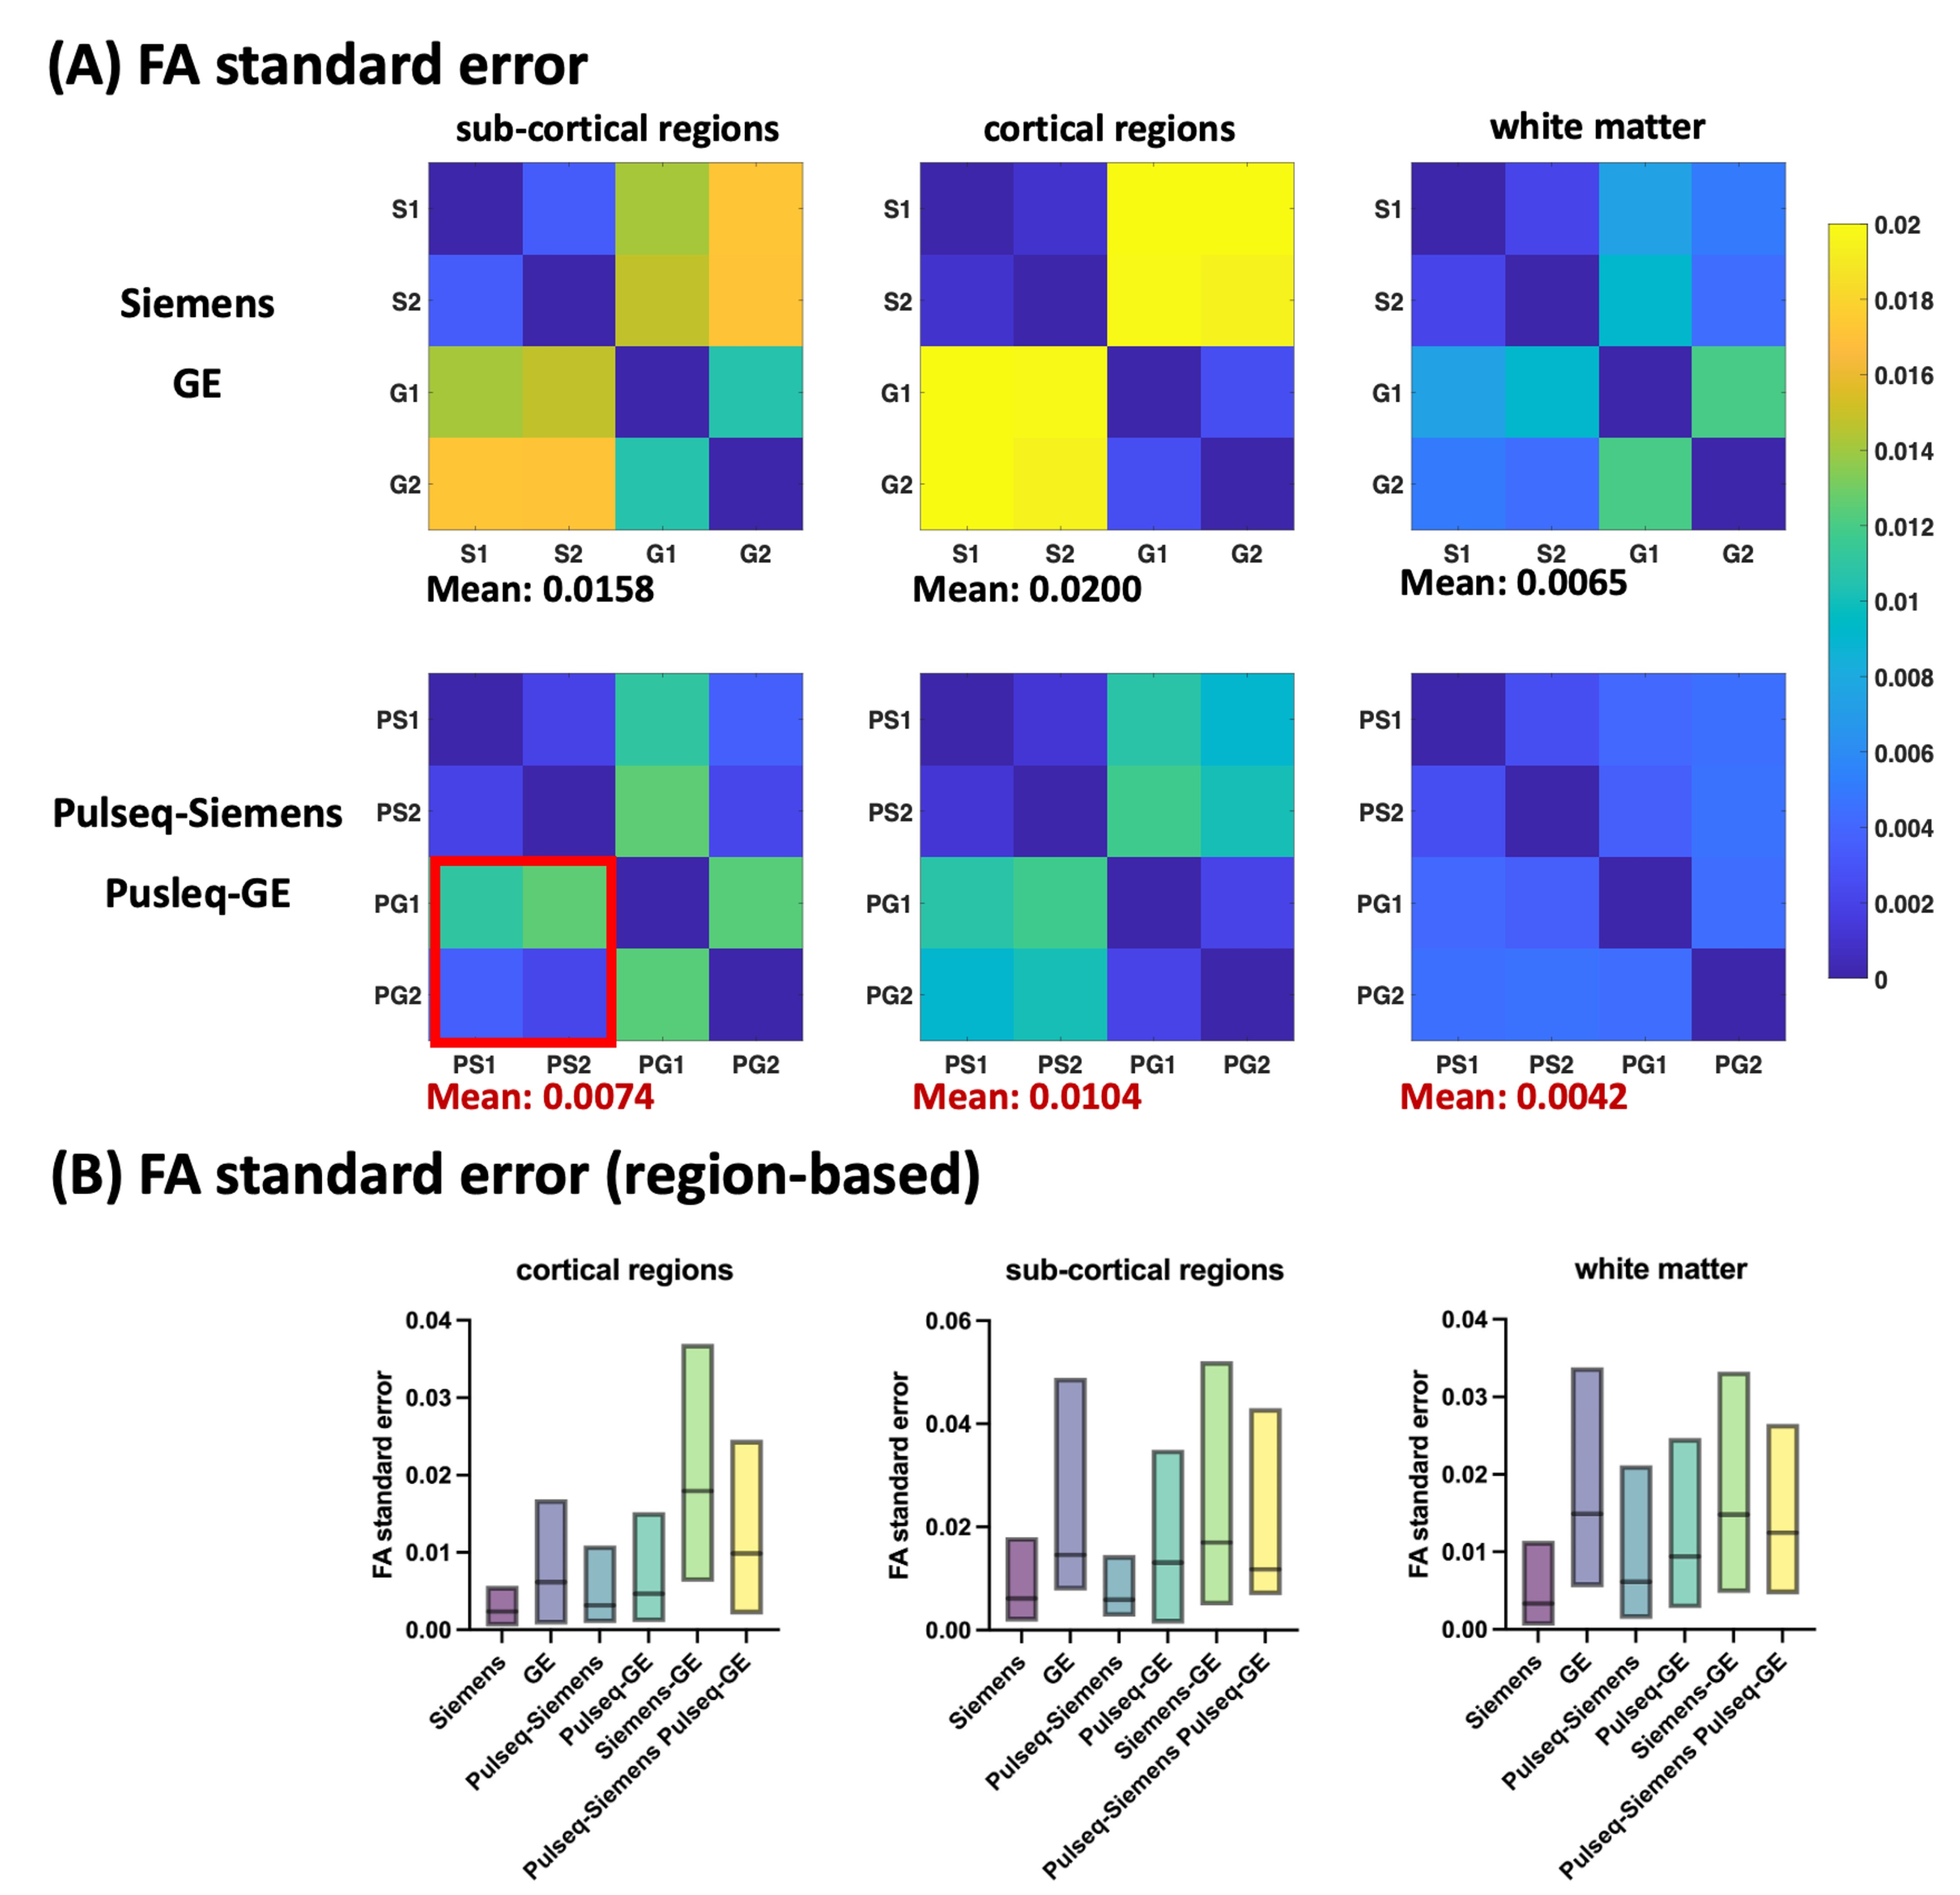
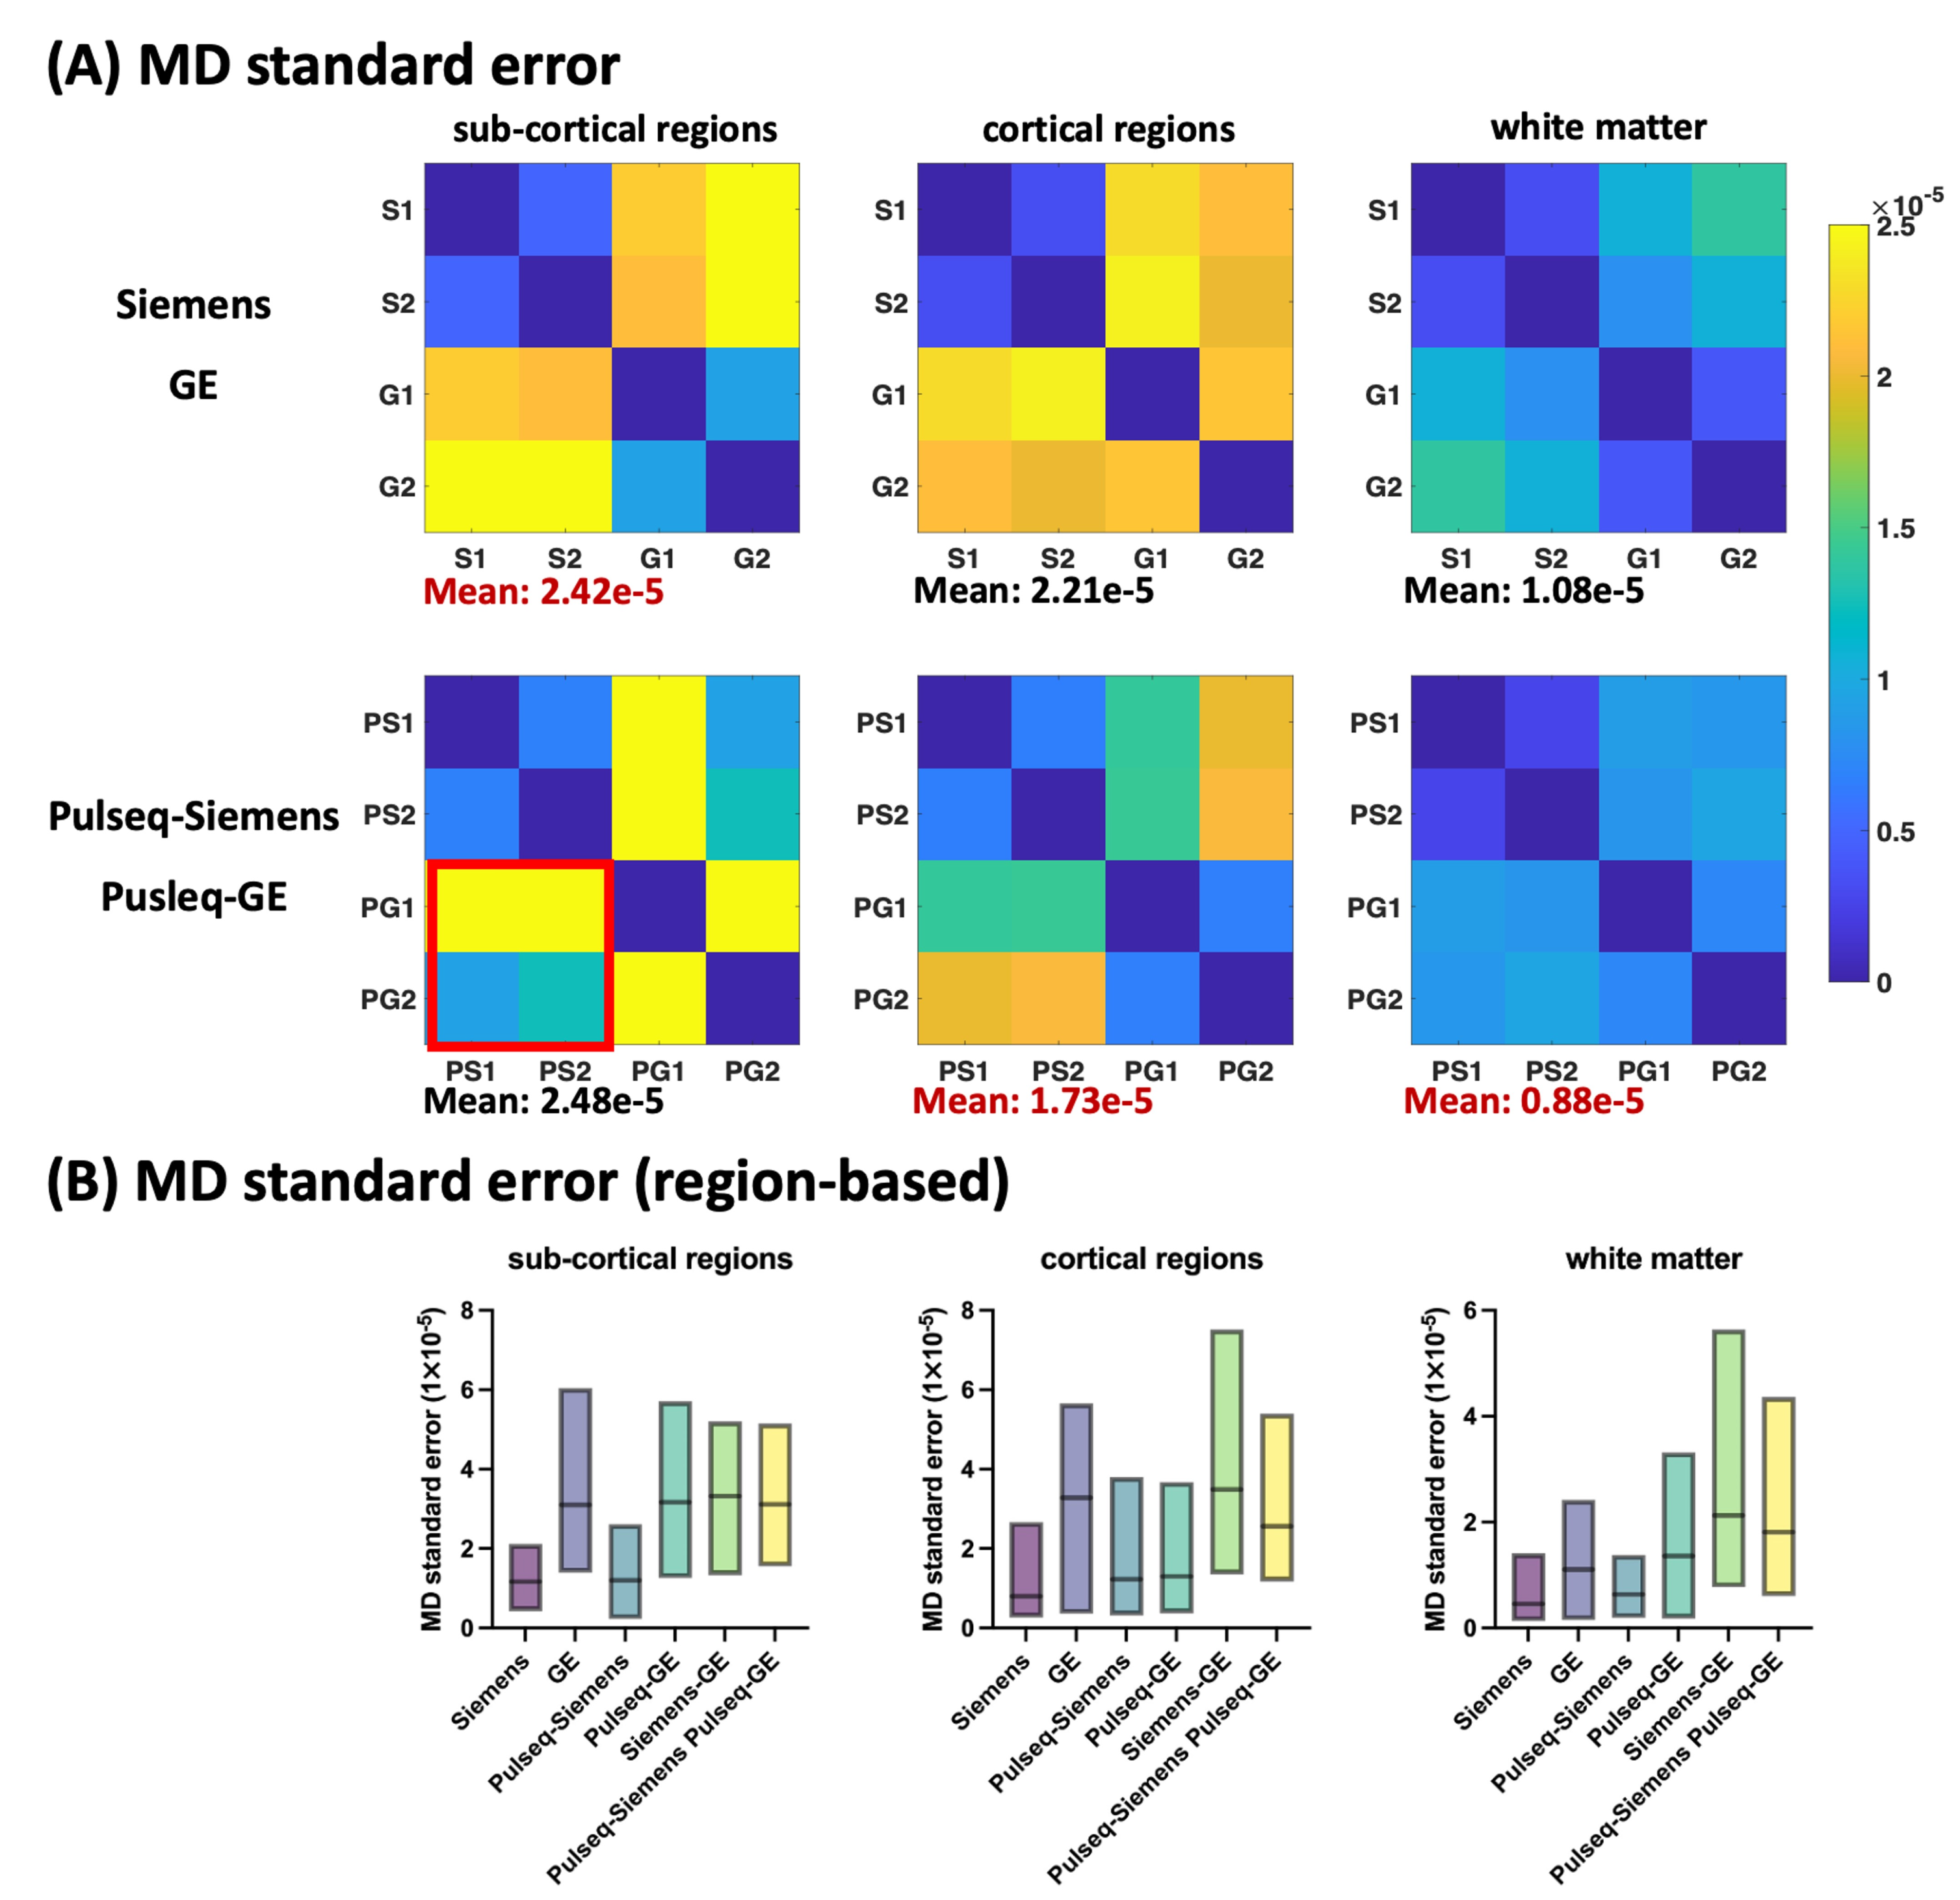
Figure 4 shows standard errors calculated from three subjects for both vendor-provided and Pulseq sequences. Figure 4(A) compares the SE in three brain regions (subcortical gray, cortical gray, and white matter), while Figure 4(B) shows the distribution of the SE across Freesurfer ROIs within these regions. Notably, the SE using Pulseq sequences across different scanners exhibited significantly lower variation, about half in cortical and subcortical regions and 35% lower in white matter, while maintaining similar within-scanner variability. Further, the distribution of the SE across all Freesurfer ROIs (large and small) for Pulseq sequence is much tighter than product sequences.
Similarly, Figure 5 displays the standard error in MD values. Pulseq sequences showed comparable SE in subcortical regions but 22% and 19% lower variability in cortical and white matter regions, respectively.
Discussion
In this work, we implemented standard dMRI sequences on a vendor-neutral sequence development platform “Pulseq” and demonstrated promising results with harmonized acquisition, which significantly enhanced the reliability and consistency of dMRI measurements across scanners from two different vendors. On the phantom, our Pulseq sequence showed more than a 2.5x reduction in standard error (variability) across Siemens and GE scanners. Further, on the human in-vivo data, our Pulseq sequences exhibited remarkably reduced standard error, maintaining scan-rescan repeatability while delivering lower variability in FA and MD (by about a factor of 2x in cortical/subcortical regions) compared to vendor-provided sequences.Conclusion
To conclude, we demonstrated that the Pulseq-diffusion sequence reduces the across-scanners variability significantly on both phantom and in-vivo data, which will benefit multi-center neuroimaging studies and improve the reproducibility of results.Acknowledgements
This study is supported by NIH grants R01MH116173, R01MH125860, and R01EB032378.References
1. Johansen-Berg H, Behrens TEJ. Diffusion MRI: From Quantitative Measurement to in Vivo Neuroanatomy. Academic Press. 2013.
2. Min J, Park M, Choi JW, Jahng GH, Moon WJ. Inter-vendor and inter-session reliability of diffusion tensor imaging: Implications for multicenter clinical imaging studies. Korean J Radiol 2018;19:777–82.
3. Karakuzu, A., Biswas, L., Cohen-Adad, J. & Stikov, N. Vendor-neutral sequences and fully transparent workflows improve inter-vendor reproducibility of quantitative MRI. Magn Reson Med 2022; 88:1212–1228.
4. Zhu T, Hu R, Qiu X, et al. Quantification of accuracy and precision of multi-center DTI measurements: A diffusion phantom and human brain study. Neuroimage 2011;56:1398–411.
5. Palacios EM, Martin AJ, Boss MA, et al. Toward precision and reproducibility of diffusion tensor imaging: A multicenter diffusion phantom and traveling volunteer study. American Journal of Neuroradiology 2017;38:537–45.
6. Malyarenko D, Galbán CJ, Londy FJ, et al. Multi-system repeatability and reproducibility of apparent diffusion coefficient measurement using an ice-water phantom. Journal of Magnetic Resonance Imaging 2013;37:1238–46.
7. Layton KJ, Kroboth S, Jia F, et al. Pulseq: A rapid and hardware-independent pulse sequence prototyping framework. Magn Reson Med 2017;77:1544–52.
8. Nielsen JF, Noll DC. TOPPE: A framework for rapid prototyping of MR pulse sequences. Magn Reson Med 2018;79:3128–34.
9. Matheson, G. J. We need to talk about reliability: Making better use of test-retest studies for study design and interpretation. PeerJ 2019.
10. Phantom Metrics “https://pstnet.com/products/mri-diffusion-calibration-phantom/”
Figures