0537
Assessment of the macrovascular contribution to resting-state fMRI functional connectivity at 3 Tesla1Department of Medical Biophysics, University of Toronto, Toronto, ON, Canada, 2Rotman Research Institute at Baycrest, Toronto, ON, Canada, 3Weldon School of Biomedical Engineering, Purdue University, West Lafayette, IN, United States, 4Biomedical Engineering, University of Toronto, Toronto, ON, Canada
Synopsis
Keywords: fMRI Analysis, fMRI (resting state)
Motivation: Resting-state fMRI (rs-fMRI) based functional connectivity (fcMRI) is widely used to image neuronal networks, but it could be biased by the contribution of macrovasculature.
Goal(s): This study aims to provide a better understanding of vascular rs-fMRI contributions and their interpretation.
Approach: Our study evaluated macrovascular contributions to experimental rs-fcMRI data.
Results: We found both arteries and veins to substantially modulate fcMRI metrics. We also found that vascular-driven fcMRI spatial variance was disproportionately high given the low vascular voxel count. In particular, veins contribute more to connectivity strength than arteries, while arteries contribute more to spatial variance than veins.
Impact: The macrovasculature was previously shown to modulate functional connectivity and reduce its neuronal specificity, but a systematic analysis is still lacking. This study demonstrates macrovascular contributions at 3 Tesla and paves the way for the correction of bias in rs-fMRI.
Introduction
The resting-state BOLD functional magnetic resonance imaging (rs-fMRI) technique is extensively used for mapping functional connectivity (rs-fcMRI)1,2. Most commonly, functional connectivity (FC) in rs-fcMRI is calculated by correlation analysis3,4, and high BOLD correlation is interpreted as synchronous neural activity. However, the brain’s macrovasculature exhibits strong correlations among themselves as well as the global mean BOLD signal5. Venous BOLD contributions were also found to significantly bias rs-fcMRI metrics6. The purpose of this study was to demonstrate macrovascular effects in rs-fMRI at both arterial and venous voxels at 3 Tesla.Method
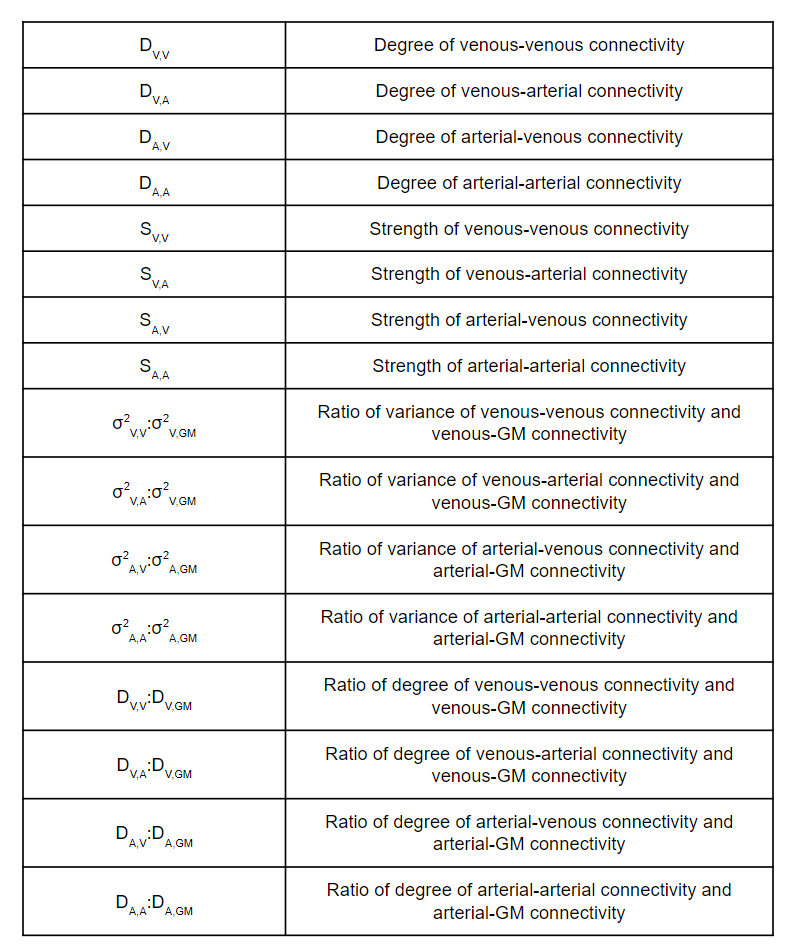
This study used data from the Midnight Scan Club (MSC) dataset7, which included 10 participants each providing 10 sessions of 30 min rs-fMRI data (eyes-open fixation). Time-of-flight (TOF) angiograms with ascending, descending, left-right and anterior-posterior encoding directions, acquired at in-plane resolutions of 0.6 - 1 mm, were registered to 1-mm isotropic T1 space and segmented using the Brain Charter Toolbox8 after manual quality control. Vascular segmentations from all angiograms and venograms were summed and then binarized to produce the final macrovascular anatomical network (mVAN). This was in turn downsampled to the rs-fMRI resolution of 4 mm isotropic. Arterial and venous map was manually separated after downsampling into different vascular masks. For details detailed methods, please refer to our preprint9.rs-fMRI data was preprocessed also as outlined in our preprint9. For each session of each participant, the voxel-wise vascular-driven connectivity metrics were calculated as pairwise correlations: (1) venous-venous; (2) arterial-arterial; and (3) arterial-venous. The metrics are summarized in Table 1. Voxelwise, the degree of connectivity (D) was defined as the number of correlations surpassing 0.1510,11, and the mean connectivity strength (S) and spatial variability (σ) were computed as the mean and variance of all correlations. D and S were also computed for the grey matter (GM) (encompassing the macrovascular voxels). We further calculated the ratio of macrovascular to whole-GM D and σ.
Results
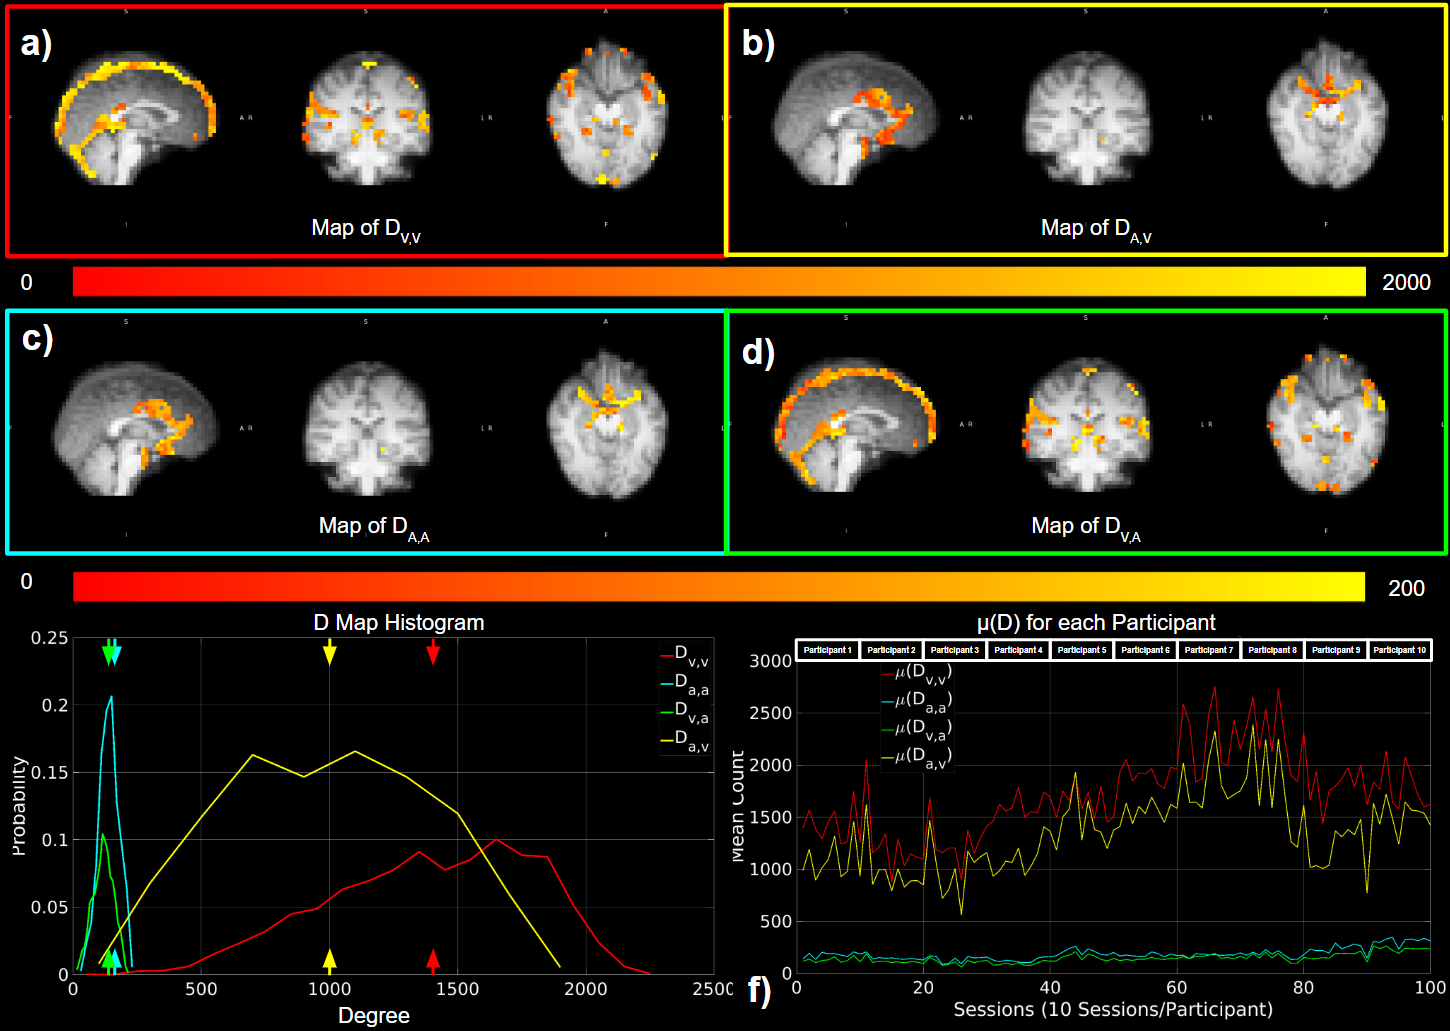
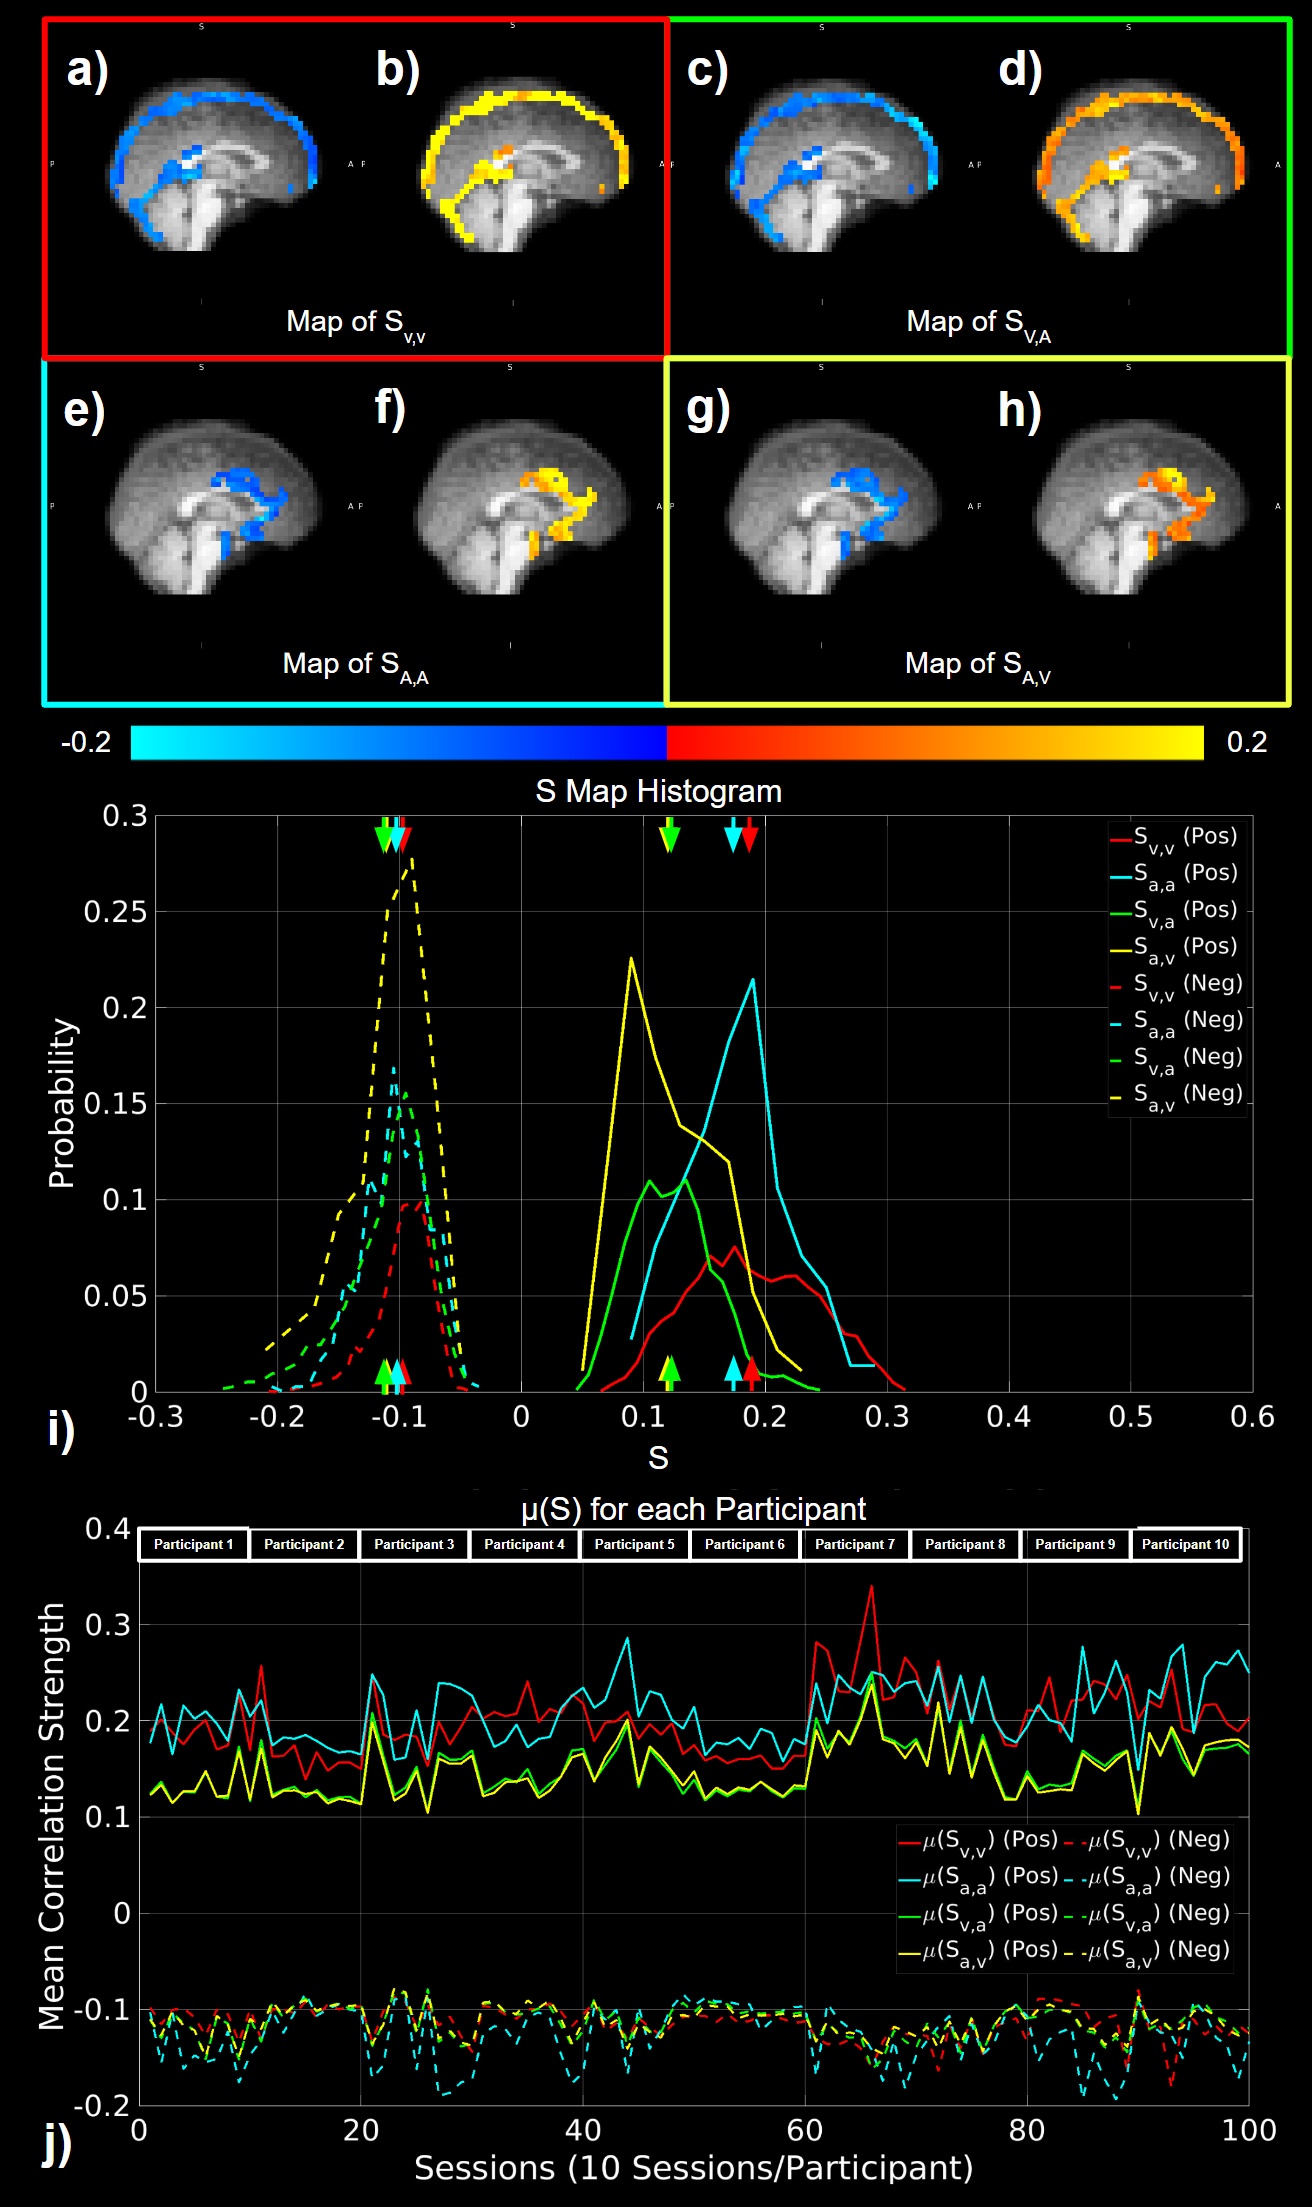
As shown in Fig. 1a-d, voxels with non-zero degrees of vascular-related correlations were found to span the entire macrovascular region, with higher values at the site of larger vessels (Fig. 1a-d). The D histograms show that DV,V values are higher than DA,A (Fig. 1e). These patterns are also evident in μ(D) across all participants in all scan sessions (Fig. 1f).SV,V and SA,A are both dominated by positive rather than negative correlations (Fig. 2a,b, e,f). However, SA,V and SV,A exhibit stronger negative correlations. These patterns were also evident in mean degree ratios for the above four groups of correlations across all participants in all scan sessions (Fig. 2j).
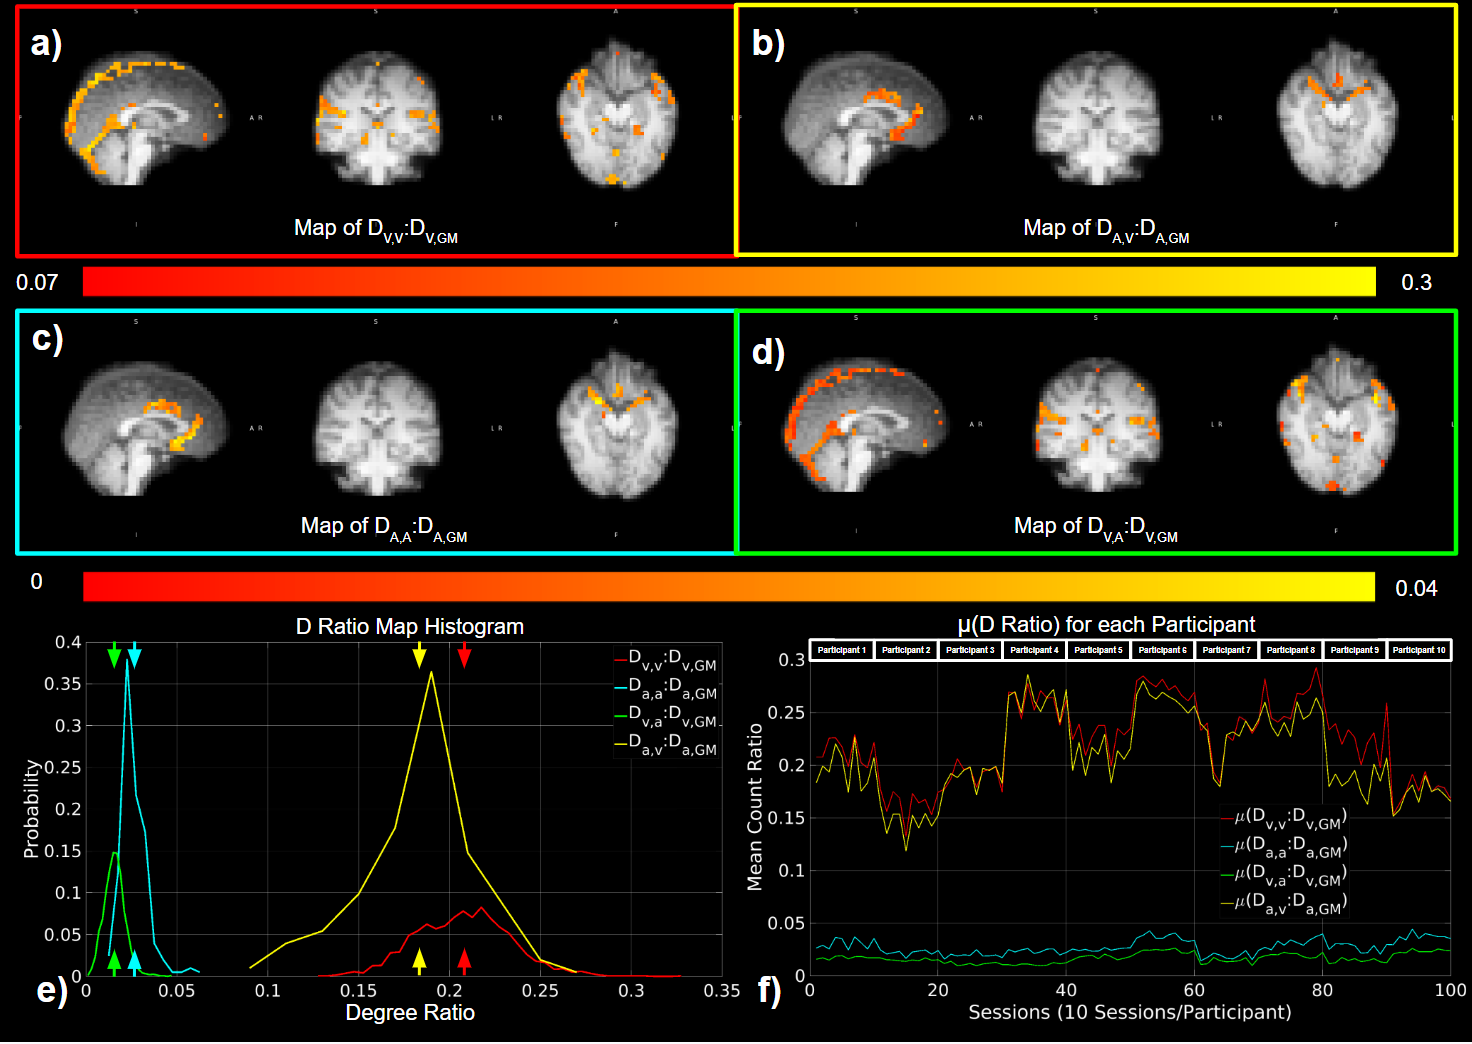
According to Fig. 3, a large portion of the significant correlations in DGM could be accounted for by vascular correlations. The arterial contributions DA,A:DA,GM (Fig. 3a,b) are lower than the venous contributions, as further illustrated by the histograms (Fig. 3e). These patterns were also evident in mean degree ratios for the above four groups of correlations across all participants in all scan sessions (Fig. 3f).
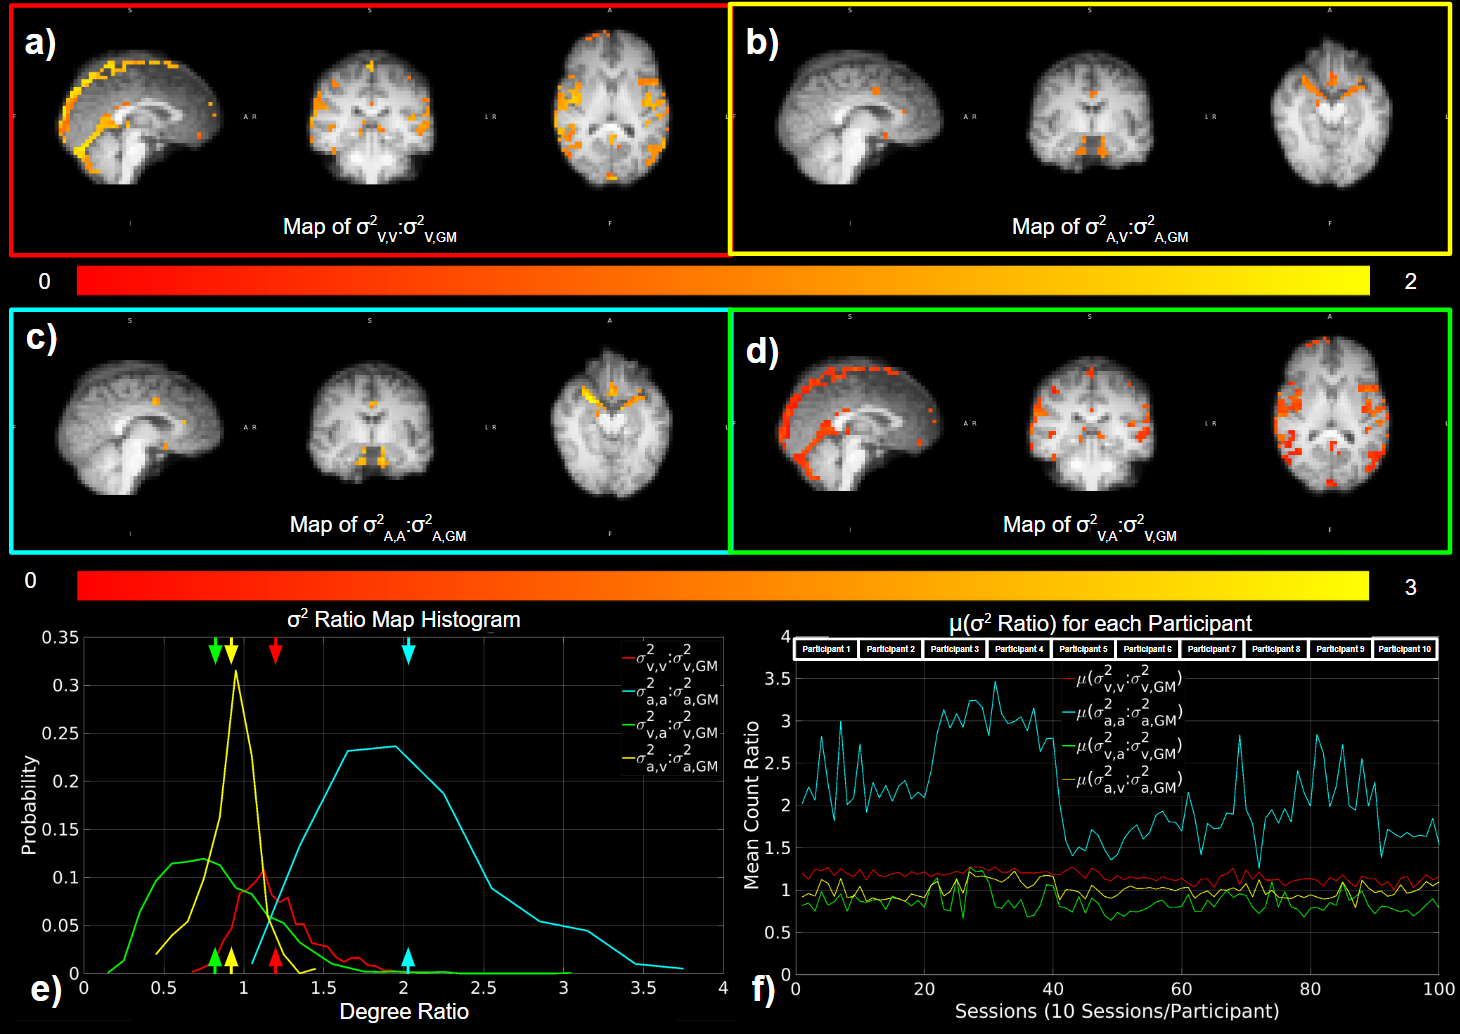
Regarding the σ ratio, contribution to spatial variability of whole-GM correlations was highest for arteries (Fig. 4a), followed by σ2V,A:σ2v,GM (Fig. 4b) and σ2V,V:σ2v,GM (Fig. 4c). All variance ratios were > 1.
Discussion
We found strong resting FC within the macrovasculature at 3 Tesla. Voxels containing the same vessel types (artery or vein) are more likely to show a positive correlation between their BOLD signals, while negative correlations are more likely between arterial and venous BOLD signals. These findings are consistent with findings by Tong et al. for the internal carotid arteries and jugular veins5. Moreover, such correlation patterns contribute significantly to GM FC through perivascular susceptibility, particularly in the vicinity of veins. Furthermore, the FC originating from the macrovasculature displayed disproportionately high correlation and spatial variability when compared to the spatial variability across all GM voxels. In particular, venous-venous correlations were associated with the highest connectivity degree (D ratio), while arterial-arterial correlation was associated with the highest degree of spatial variability.This study demonstrated that macrovasculature strongly biases rs-fcMRI measurements. The key to removing macrovascular bias is to locate the macrovasculature. Therefore, we recommend that angiograms and venograms be collected along with rs-fMRI with either TOF imaging or susceptibility-weighted imaging (SWI). A potentially feasible approach may involve biophysical modelling of the vascular susceptibility, not only in the voxel containing the vasculature but also in surrounding voxels. This will be the focus of our future work.
Acknowledgements
The authors would like to acknowledge financial support from Canadian Institutes of Health Research and the Canada Research Chairs Program (JJC).References
1. Srivastava, P., Fotiadis, P., Parkes, L. & Bassett, D. S. The expanding horizons of network neuroscience: From description to prediction and control. Neuroimage 258, 119250 (2022).
2. van den Heuvel, M. P. & Hulshoff Pol, H. E. Exploring the brain network: a review on resting-state fMRI functional connectivity. Eur. Neuropsychopharmacol. 20, 519–534 (2010).
3. Bandettini, P. A., Jesmanowicz, A., Wong, E. C. & Hyde, J. S. Processing strategies for time-course data sets in functional MRI of the human brain. Magn. Reson. Med. 30, 161–173 (1993).
4. Biswal, B., Yetkin, F. Z., Haughton, V. M. & Hyde, J. S. Functional connectivity in the motor cortex of resting human brain using echo-planar MRI. Magn. Reson. Med. 34, 537–541 (1995).
5. Tong, Y., Yao, J. F., Chen, J. J. & Frederick, B. D. The resting-state fMRI arterial signal predicts differential blood transit time through the brain. J. Cereb. Blood Flow Metab. 39, 1148–1160 (2019).
6. Huck, J. et al. Modeling venous bias in resting state functional MRI metrics. Hum. Brain Mapp. (2023) doi:10.1002/hbm.26431.
7. Gordon, E. M. et al. Precision Functional Mapping of Individual Human Brains. Neuron 95, 791–807.e7 (2017).
8. Bernier, M., Cunnane, S. C. & Whittingstall, K. The morphology of the human cerebrovascular system. Hum. Brain Mapp. 39, 4962–4975 (2018).
9. Zhong, X., Tong, Y. & Chen, J. J. Assessment of the macrovascular contribution to resting-state fMRI functional connectivity at 3 Tesla. bioRxiv 2023.10.19.563131 (2023) doi:10.1101/2023.10.19.563131.
10. Cole, M. W., Pathak, S. & Schneider, W. Identifying the brain’s most globally connected regions. Neuroimage 49, 3132–3148 (2010).
11. Buckner, R. L. et al. Cortical hubs revealed by intrinsic functional connectivity: mapping, assessment of stability, and relation to Alzheimer’s disease. J. Neurosci. 29, 1860–1873 (2009).
Figures